Archive for investing – Page 15

COT Stock Market Futures Charts: VIX, Dow, Nasdaq, SP500-Mini, Russell-2000, Emerging Markets

By CountingPips.com COT Home | Data Tables | Data Downloads | Newsletter

Here are the latest charts and statistics for the Commitment of Traders (COT) data published by the Commodities Futures Trading Commission (CFTC).

The latest COT data is updated through Tuesday June 01 2021 and shows a quick view of how large traders (for-profit speculators and commercial entities) were positioned in the futures markets.


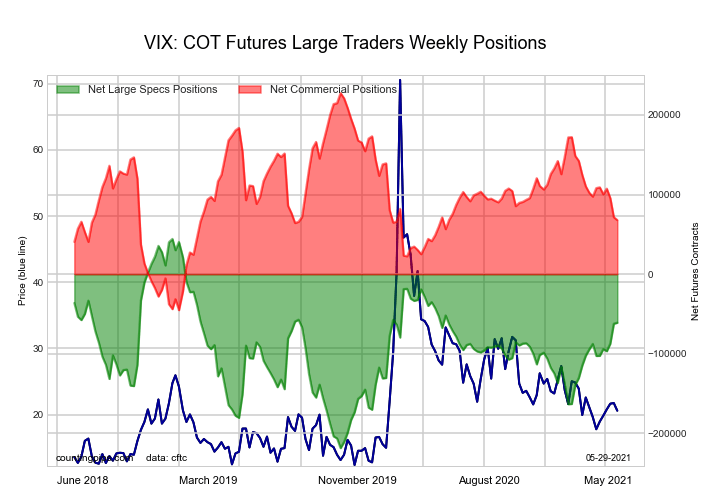
VIX Volatility Futures Futures:

The VIX Volatility Futures large speculator standing this week recorded a net position of -61,782 contracts in the data reported through Tuesday. This was a weekly decrease of -850 contracts from the previous week which had a total of -60,932 net contracts.

This week’s current strength score (the trader positioning range over the past three years, measured from 0 to 100) shows the speculators are currently Bullish with a score of 59.6 percent. The commercials are Bearish with a score of 41.1 percent and the small traders (not shown in chart) are Bearish with a score of 36.6 percent.

VIX Volatility Futures StatisticsSPECULATORSCOMMERCIALSSMALL TRADERS
– Percent of Open Interest Longs:23.550.66.2
– Percent of Open Interest Shorts:41.930.67.7
– Net Position:-61,78266,995-5,213
– Gross Longs:78,637169,61220,736
– Gross Shorts:140,419102,61725,949
– Long to Short Ratio:0.6 to 11.7 to 10.8 to 1
NET POSITION TREND:
– COT Index Score (3 Year Range Pct):59.641.136.6
– COT Index Reading (3 Year Range):BullishBearishBearish
NET POSITION MOVEMENT INDEX:
– 6-Week Change in Strength Index:15.5-15.55.3


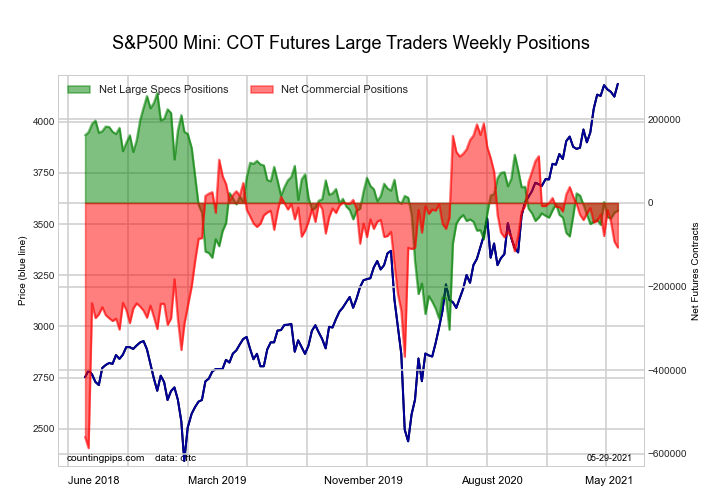
S&P500 Mini Futures Futures:

The S&P500 Mini Futures large speculator standing this week recorded a net position of -32,075 contracts in the data reported through Tuesday. This was a weekly lowering of -13,587 contracts from the previous week which had a total of -18,488 net contracts.

This week’s current strength score (the trader positioning range over the past three years, measured from 0 to 100) shows the speculators are currently Bearish with a score of 47.9 percent. The commercials are Bullish with a score of 60.4 percent and the small traders (not shown in chart) are Bullish with a score of 50.7 percent.

S&P500 Mini Futures StatisticsSPECULATORSCOMMERCIALSSMALL TRADERS
– Percent of Open Interest Longs:14.169.413.7
– Percent of Open Interest Shorts:15.373.68.3
– Net Position:-32,075-117,612149,687
– Gross Longs:390,3761,920,377379,225
– Gross Shorts:422,4512,037,989229,538
– Long to Short Ratio:0.9 to 10.9 to 11.7 to 1
NET POSITION TREND:
– COT Index Score (3 Year Range Pct):47.960.450.7
– COT Index Reading (3 Year Range):BearishBullishBullish
NET POSITION MOVEMENT INDEX:
– 6-Week Change in Strength Index:3.5-11.612.9


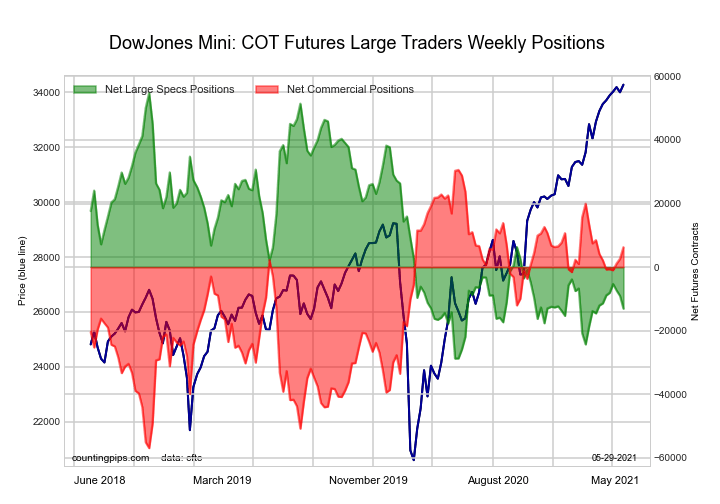
Dow Jones Mini Futures Futures:

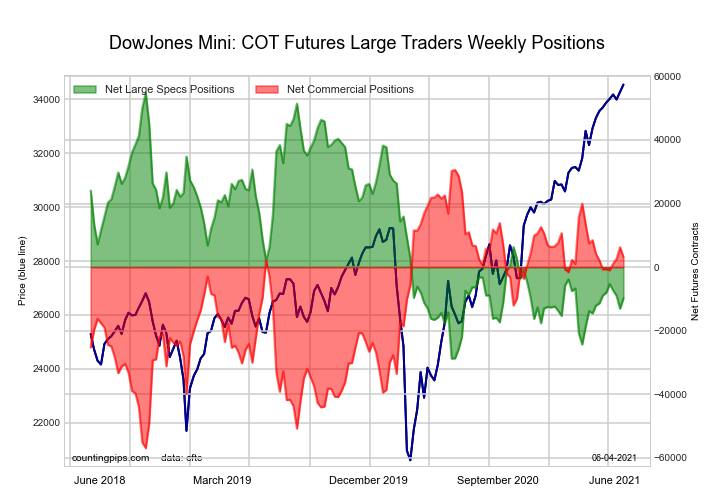
The Dow Jones Mini Futures large speculator standing this week recorded a net position of -9,765 contracts in the data reported through Tuesday. This was a weekly lift of 3,279 contracts from the previous week which had a total of -13,044 net contracts.

This week’s current strength score (the trader positioning range over the past three years, measured from 0 to 100) shows the speculators are currently Bearish with a score of 22.7 percent. The commercials are Bullish with a score of 68.7 percent and the small traders (not shown in chart) are Bullish-Extreme with a score of 82.0 percent.

Dow Jones Mini Futures StatisticsSPECULATORSCOMMERCIALSSMALL TRADERS
– Percent of Open Interest Longs:33.246.817.6
– Percent of Open Interest Shorts:42.743.711.2
– Net Position:-9,7653,1686,597
– Gross Longs:34,28048,33518,192
– Gross Shorts:44,04545,16711,595
– Long to Short Ratio:0.8 to 11.1 to 11.6 to 1
NET POSITION TREND:
– COT Index Score (3 Year Range Pct):22.768.782.0
– COT Index Reading (3 Year Range):BearishBullishBullish-Extreme
NET POSITION MOVEMENT INDEX:
– 6-Week Change in Strength Index:-1.14.5-18.0


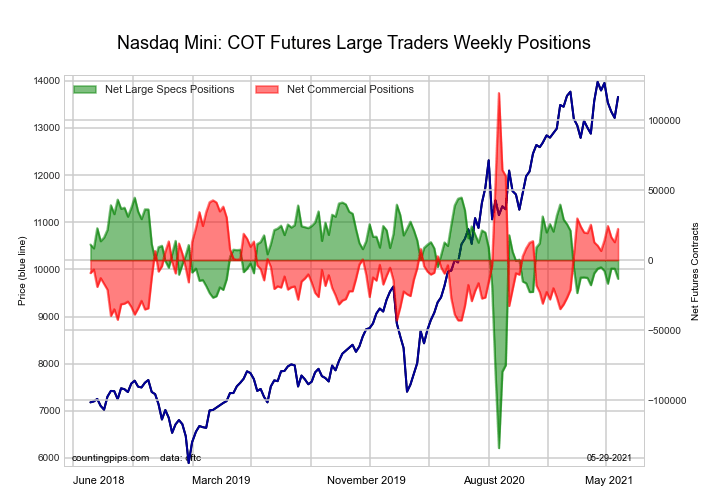
Nasdaq Mini Futures Futures:

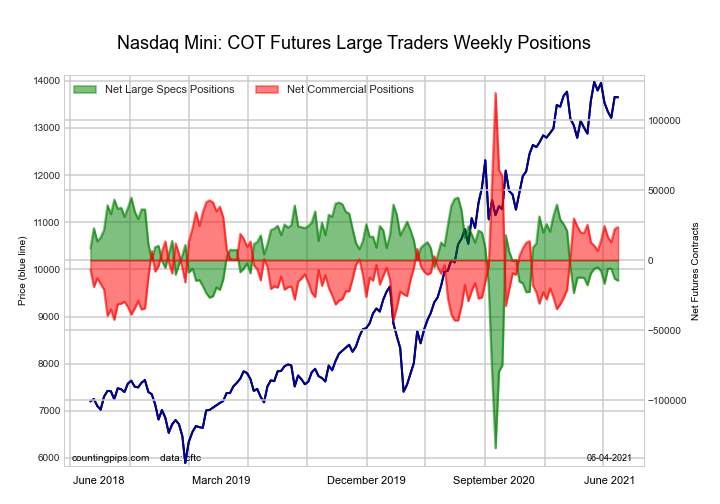
The Nasdaq Mini Futures large speculator standing this week recorded a net position of -14,549 contracts in the data reported through Tuesday. This was a weekly decline of -1,254 contracts from the previous week which had a total of -13,295 net contracts.

This week’s current strength score (the trader positioning range over the past three years, measured from 0 to 100) shows the speculators are currently Bullish with a score of 66.9 percent. The commercials are Bearish with a score of 41.0 percent and the small traders (not shown in chart) are Bearish with a score of 23.8 percent.

Nasdaq Mini Futures StatisticsSPECULATORSCOMMERCIALSSMALL TRADERS
– Percent of Open Interest Longs:22.360.115.6
– Percent of Open Interest Shorts:28.450.219.4
– Net Position:-14,54923,564-9,015
– Gross Longs:53,160143,25337,164
– Gross Shorts:67,709119,68946,179
– Long to Short Ratio:0.8 to 11.2 to 10.8 to 1
NET POSITION TREND:
– COT Index Score (3 Year Range Pct):66.941.023.8
– COT Index Reading (3 Year Range):BullishBearishBearish
NET POSITION MOVEMENT INDEX:
– 6-Week Change in Strength Index:-5.310.4-16.8


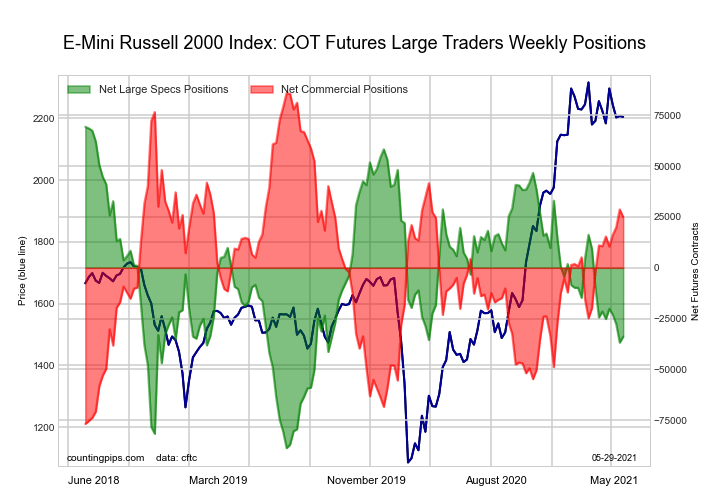
Russell 2000 Mini Futures Futures:

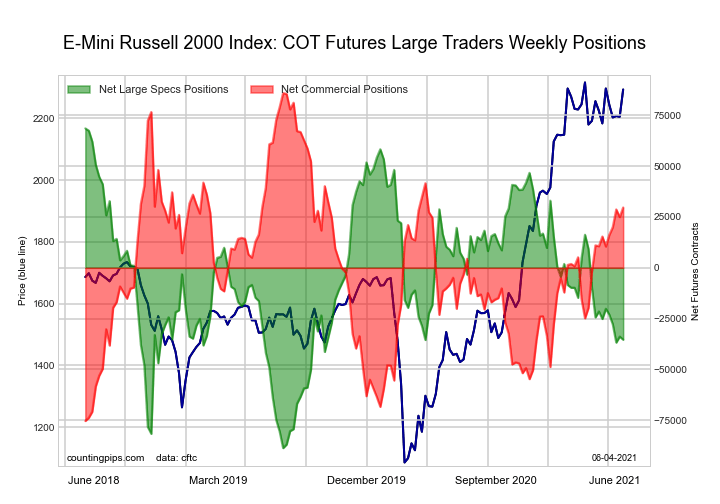
The Russell 2000 Mini Futures large speculator standing this week recorded a net position of -35,386 contracts in the data reported through Tuesday. This was a weekly decrease of -1,526 contracts from the previous week which had a total of -33,860 net contracts.

This week’s current strength score (the trader positioning range over the past three years, measured from 0 to 100) shows the speculators are currently Bearish with a score of 33.9 percent. The commercials are Bullish with a score of 65.1 percent and the small traders (not shown in chart) are Bearish with a score of 49.2 percent.

Russell 2000 Mini Futures StatisticsSPECULATORSCOMMERCIALSSMALL TRADERS
– Percent of Open Interest Longs:15.477.95.8
– Percent of Open Interest Shorts:23.271.44.5
– Net Position:-35,38629,6745,712
– Gross Longs:70,310355,62026,460
– Gross Shorts:105,696325,94620,748
– Long to Short Ratio:0.7 to 11.1 to 11.3 to 1
NET POSITION TREND:
– COT Index Score (3 Year Range Pct):33.965.149.2
– COT Index Reading (3 Year Range):BearishBullishBearish
NET POSITION MOVEMENT INDEX:
– 6-Week Change in Strength Index:-6.58.8-11.5


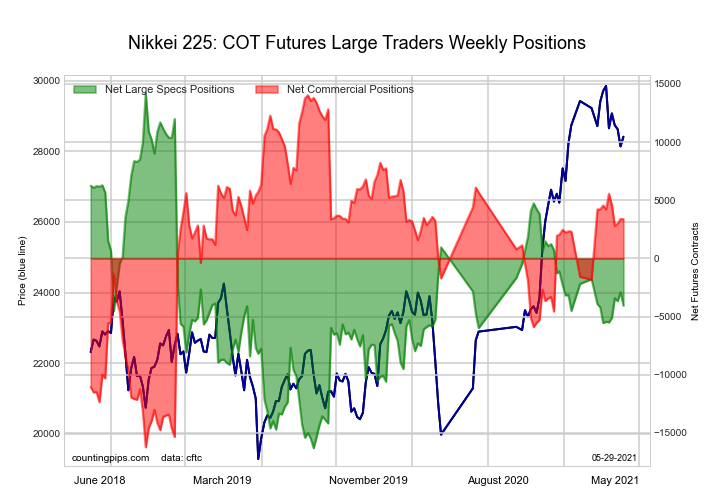
Nikkei Stock Average (USD) Futures Futures:

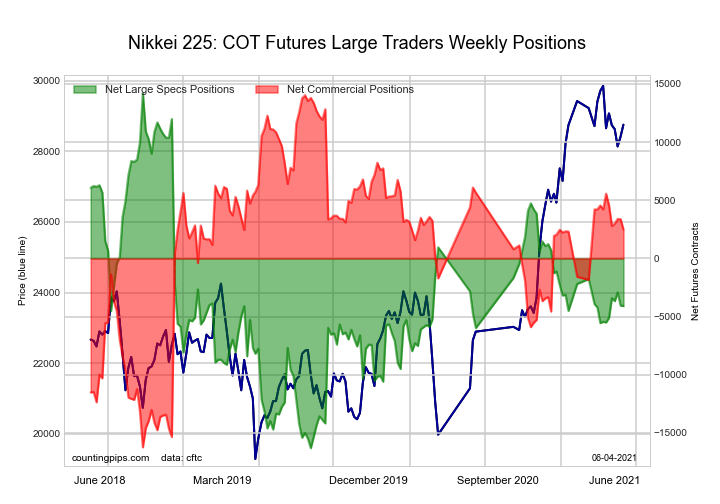
The Nikkei Stock Average (USD) Futures large speculator standing this week recorded a net position of -4,091 contracts in the data reported through Tuesday. This was a weekly lowering of -45 contracts from the previous week which had a total of -4,046 net contracts.

This week’s current strength score (the trader positioning range over the past three years, measured from 0 to 100) shows the speculators are currently Bearish with a score of 40.0 percent. The commercials are Bullish with a score of 61.9 percent and the small traders (not shown in chart) are Bearish with a score of 37.5 percent.

Nikkei Stock Average Futures StatisticsSPECULATORSCOMMERCIALSSMALL TRADERS
– Percent of Open Interest Longs:15.953.430.4
– Percent of Open Interest Shorts:39.938.821.0
– Net Position:-4,0912,4881,603
– Gross Longs:2,6999,0925,171
– Gross Shorts:6,7906,6043,568
– Long to Short Ratio:0.4 to 11.4 to 11.4 to 1
NET POSITION TREND:
– COT Index Score (3 Year Range Pct):40.061.937.5
– COT Index Reading (3 Year Range):BearishBullishBearish
NET POSITION MOVEMENT INDEX:
– 6-Week Change in Strength Index:4.6-10.119.7


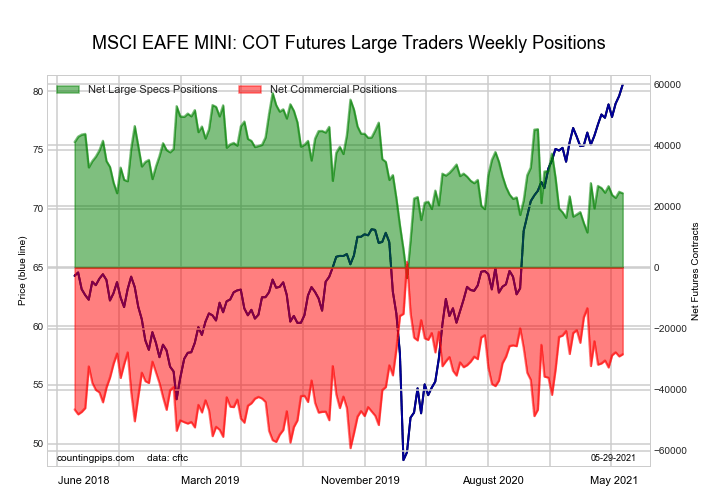
MSCI EAFE Mini Futures Futures:

The MSCI EAFE Mini Futures large speculator standing this week recorded a net position of 29,956 contracts in the data reported through Tuesday. This was a weekly lift of 5,602 contracts from the previous week which had a total of 24,354 net contracts.

This week’s current strength score (the trader positioning range over the past three years, measured from 0 to 100) shows the speculators are currently Bullish with a score of 55.1 percent. The commercials are Bearish with a score of 40.5 percent and the small traders (not shown in chart) are Bullish with a score of 56.9 percent.

MSCI EAFE Mini Futures StatisticsSPECULATORSCOMMERCIALSSMALL TRADERS
– Percent of Open Interest Longs:9.587.72.5
– Percent of Open Interest Shorts:2.196.31.3
– Net Position:29,956-34,4744,518
– Gross Longs:38,312353,0909,883
– Gross Shorts:8,356387,5645,365
– Long to Short Ratio:4.6 to 10.9 to 11.8 to 1
NET POSITION TREND:
– COT Index Score (3 Year Range Pct):55.140.556.9
– COT Index Reading (3 Year Range):BullishBearishBullish
NET POSITION MOVEMENT INDEX:
– 6-Week Change in Strength Index:8.9-6.6-12.8


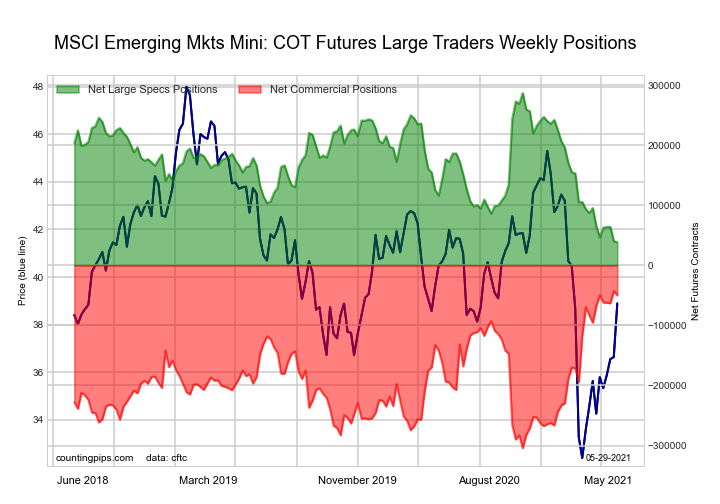
MSCI Emerging Mkts Mini Futures Futures:

The MSCI Emerging Mkts Mini Futures large speculator standing this week recorded a net position of 38,211 contracts in the data reported through Tuesday. This was a weekly lowering of -2,219 contracts from the previous week which had a total of 40,430 net contracts.

This week’s current strength score (the trader positioning range over the past three years, measured from 0 to 100) shows the speculators are currently Bearish-Extreme with a score of 0.0 percent. The commercials are Bullish-Extreme with a score of 97.2 percent and the small traders (not shown in chart) are Bearish with a score of 40.4 percent.

MSCI Emerging Mkts Mini Futures StatisticsSPECULATORSCOMMERCIALSSMALL TRADERS
– Percent of Open Interest Longs:14.382.22.4
– Percent of Open Interest Shorts:11.086.51.3
– Net Position:38,211-49,88611,675
– Gross Longs:165,150950,68527,250
– Gross Shorts:126,9391,000,57115,575
– Long to Short Ratio:1.3 to 11.0 to 11.7 to 1
NET POSITION TREND:
– COT Index Score (3 Year Range Pct):0.097.240.4
– COT Index Reading (3 Year Range):Bearish-ExtremeBullish-ExtremeBearish
NET POSITION MOVEMENT INDEX:
– 6-Week Change in Strength Index:-11.06.87.3


Article By CountingPips.comReceive our weekly COT Reports by Email

*COT Report: The COT data, released weekly to the public each Friday, is updated through the most recent Tuesday (data is 3 days old) and shows a quick view of how large speculators or non-commercials (for-profit traders) were positioned in the futures markets.

The CFTC categorizes trader positions according to commercial hedgers (traders who use futures contracts for hedging as part of the business), non-commercials (large traders who speculate to realize trading profits) and nonreportable traders (usually small traders/speculators).

Find CFTC criteria here: (http://www.cftc.gov/MarketReports/CommitmentsofTraders/ExplanatoryNotes/index.htm).

COT Soft Commodities Futures Charts: Hogs, Sugar, Coffee, Corn, Soybeans, Wheat, Cattle

By CountingPips.com COT Home | Data Tables | Data Downloads | Newsletter

Here are the latest charts and statistics for the Commitment of Traders (COT) data published by the Commodities Futures Trading Commission (CFTC).

The latest COT data is updated through Tuesday June 01 2021 and shows a quick view of how large traders (for-profit speculators and commercial entities) were positioned in the futures markets.


CORN Futures:

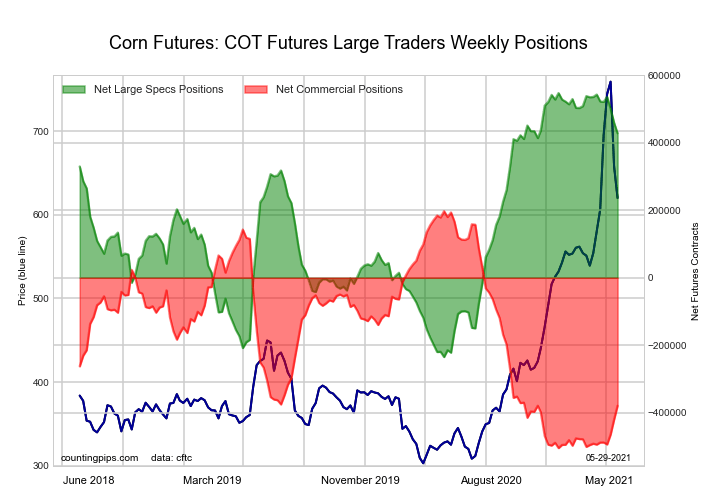
The CORN large speculator standing this week equaled a net position of 452,376 contracts in the data reported through Tuesday. This was a weekly increase of 23,950 contracts from the previous week which had a total of 428,426 net contracts.

This week’s current strength score (the trader positioning range over the past three years, measured from 0 to 100) shows the speculators are currently Bullish-Extreme with a score of 87.8 percent. The commercials are Bearish-Extreme with a score of 14.2 percent and the small traders (not shown in chart) are Bearish-Extreme with a score of 9.5 percent.

CORN Futures StatisticsSPECULATORSCOMMERCIALSSMALL TRADERS
– Percent of Open Interest Longs:30.648.28.2
– Percent of Open Interest Shorts:4.571.510.9
– Net Position:452,376-405,083-47,293
– Gross Longs:531,338836,578142,392
– Gross Shorts:78,9621,241,661189,685
– Long to Short Ratio:6.7 to 10.7 to 10.8 to 1
NET POSITION TREND:
– COT Index Score (3 Year Range Pct):87.814.29.5
– COT Index Reading (3 Year Range):Bullish-ExtremeBearish-ExtremeBearish-Extreme
NET POSITION MOVEMENT INDEX:
– 6-Week Change in Strength Index:-9.011.9-8.1


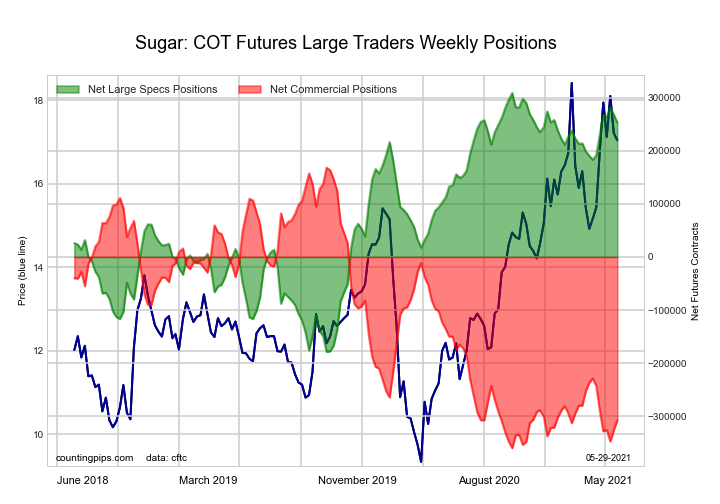
SUGAR Futures:

The SUGAR large speculator standing this week equaled a net position of 269,226 contracts in the data reported through Tuesday. This was a weekly lift of 16,235 contracts from the previous week which had a total of 252,991 net contracts.

This week’s current strength score (the trader positioning range over the past three years, measured from 0 to 100) shows the speculators are currently Bullish-Extreme with a score of 91.9 percent. The commercials are Bearish-Extreme with a score of 5.9 percent and the small traders (not shown in chart) are Bullish-Extreme with a score of 80.9 percent.

SUGAR Futures StatisticsSPECULATORSCOMMERCIALSSMALL TRADERS
– Percent of Open Interest Longs:30.245.09.6
– Percent of Open Interest Shorts:3.977.03.9
– Net Position:269,226-328,28359,057
– Gross Longs:309,620461,25198,664
– Gross Shorts:40,394789,53439,607
– Long to Short Ratio:7.7 to 10.6 to 12.5 to 1
NET POSITION TREND:
– COT Index Score (3 Year Range Pct):91.95.980.9
– COT Index Reading (3 Year Range):Bullish-ExtremeBearish-ExtremeBullish-Extreme
NET POSITION MOVEMENT INDEX:
– 6-Week Change in Strength Index:8.2-7.4-1.1


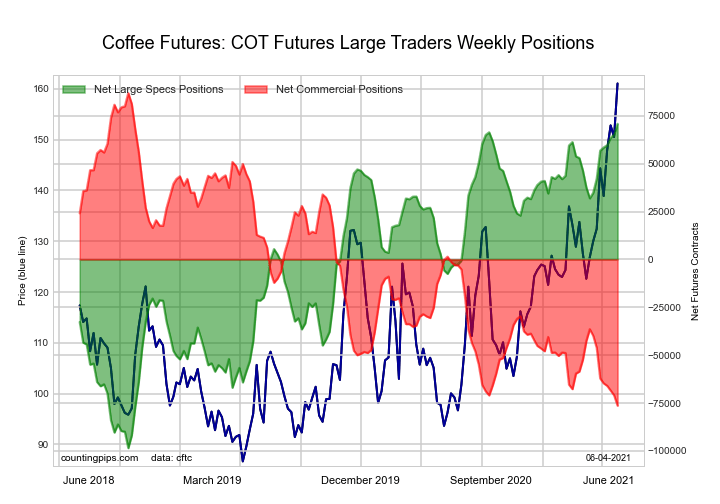
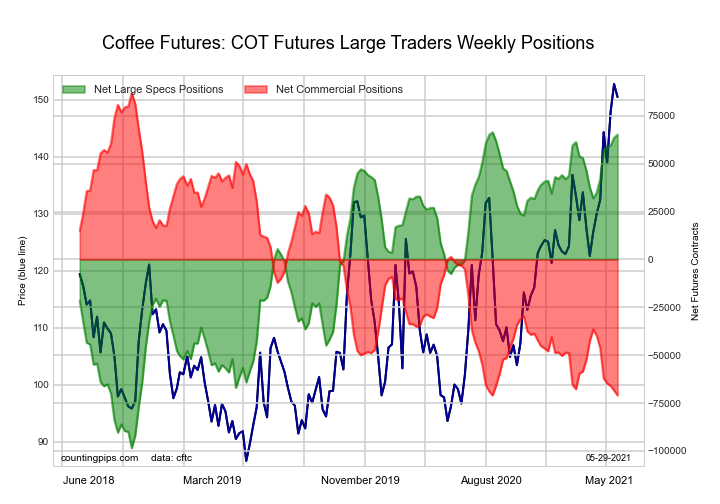
COFFEE Futures:

The COFFEE large speculator standing this week equaled a net position of 70,773 contracts in the data reported through Tuesday. This was a weekly advance of 5,659 contracts from the previous week which had a total of 65,114 net contracts.

This week’s current strength score (the trader positioning range over the past three years, measured from 0 to 100) shows the speculators are currently Bullish-Extreme with a score of 100.0 percent. The commercials are Bearish-Extreme with a score of 0.0 percent and the small traders (not shown in chart) are Bearish with a score of 26.7 percent.

COFFEE Futures StatisticsSPECULATORSCOMMERCIALSSMALL TRADERS
– Percent of Open Interest Longs:31.444.64.7
– Percent of Open Interest Shorts:6.871.02.8
– Net Position:70,773-76,3185,545
– Gross Longs:90,442128,59413,600
– Gross Shorts:19,669204,9128,055
– Long to Short Ratio:4.6 to 10.6 to 11.7 to 1
NET POSITION TREND:
– COT Index Score (3 Year Range Pct):100.00.026.7
– COT Index Reading (3 Year Range):Bullish-ExtremeBearish-ExtremeBearish
NET POSITION MOVEMENT INDEX:
– 6-Week Change in Strength Index:16.9-18.510.2


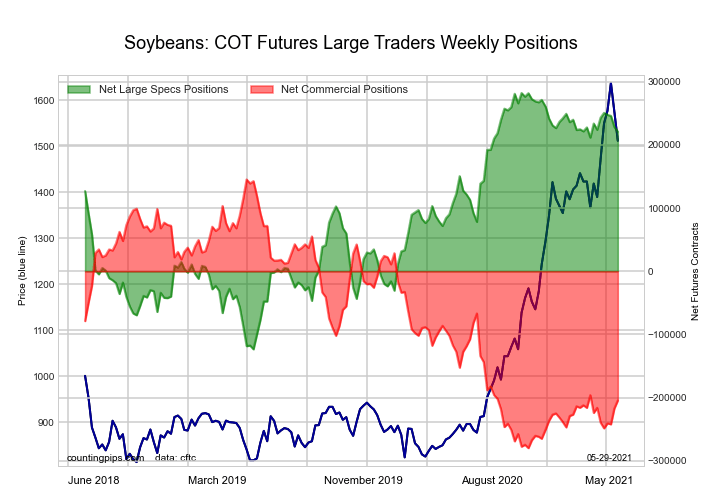
SOYBEANS Futures:

The SOYBEANS large speculator standing this week equaled a net position of 224,076 contracts in the data reported through Tuesday. This was a weekly advance of 3,021 contracts from the previous week which had a total of 221,055 net contracts.

This week’s current strength score (the trader positioning range over the past three years, measured from 0 to 100) shows the speculators are currently Bullish-Extreme with a score of 85.7 percent. The commercials are Bearish-Extreme with a score of 15.6 percent and the small traders (not shown in chart) are Bullish with a score of 54.2 percent.

SOYBEANS Futures StatisticsSPECULATORSCOMMERCIALSSMALL TRADERS
– Percent of Open Interest Longs:34.244.97.1
– Percent of Open Interest Shorts:6.571.38.4
– Net Position:224,076-213,475-10,601
– Gross Longs:276,257362,85557,600
– Gross Shorts:52,181576,33068,201
– Long to Short Ratio:5.3 to 10.6 to 10.8 to 1
NET POSITION TREND:
– COT Index Score (3 Year Range Pct):85.715.654.2
– COT Index Reading (3 Year Range):Bullish-ExtremeBearish-ExtremeBullish
NET POSITION MOVEMENT INDEX:
– 6-Week Change in Strength Index:-4.76.1-11.4


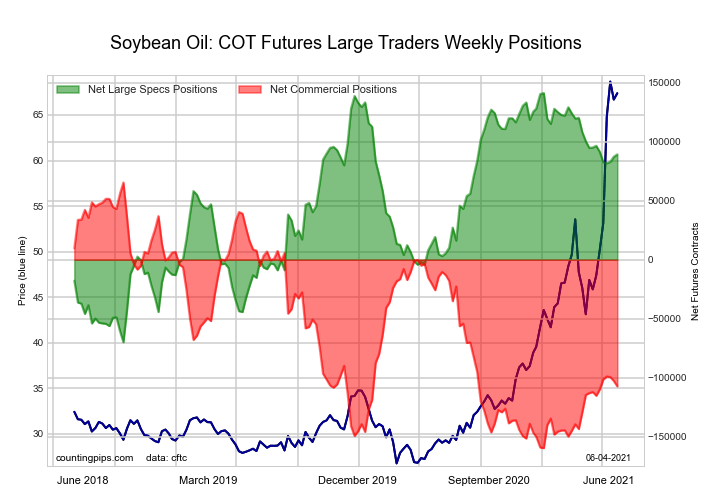
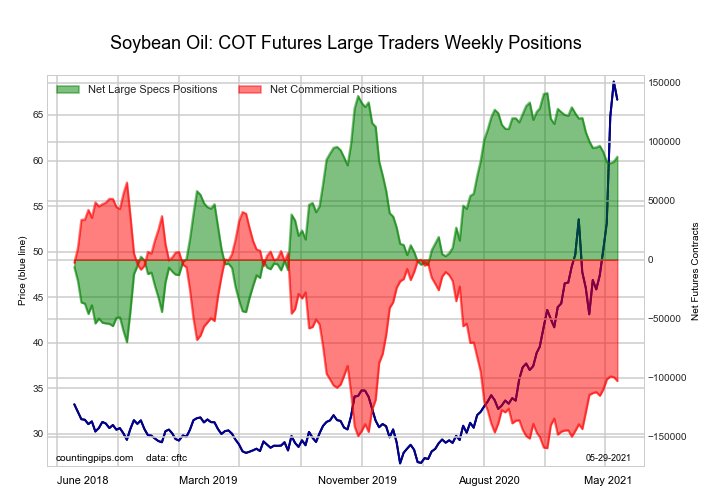
SOYBEAN OIL Futures:

The SOYBEAN OIL large speculator standing this week equaled a net position of 89,233 contracts in the data reported through Tuesday. This was a weekly rise of 2,030 contracts from the previous week which had a total of 87,203 net contracts.

This week’s current strength score (the trader positioning range over the past three years, measured from 0 to 100) shows the speculators are currently Bullish with a score of 75.4 percent. The commercials are Bearish with a score of 23.3 percent and the small traders (not shown in chart) are Bullish-Extreme with a score of 80.6 percent.

SOYBEAN OIL Futures StatisticsSPECULATORSCOMMERCIALSSMALL TRADERS
– Percent of Open Interest Longs:23.846.68.4
– Percent of Open Interest Shorts:7.266.65.1
– Net Position:89,233-107,22217,989
– Gross Longs:127,933250,07745,175
– Gross Shorts:38,700357,29927,186
– Long to Short Ratio:3.3 to 10.7 to 11.7 to 1
NET POSITION TREND:
– COT Index Score (3 Year Range Pct):75.423.380.6
– COT Index Reading (3 Year Range):BullishBearishBullish-Extreme
NET POSITION MOVEMENT INDEX:
– 6-Week Change in Strength Index:-3.43.5-2.7


SOYBEAN MEAL Futures:

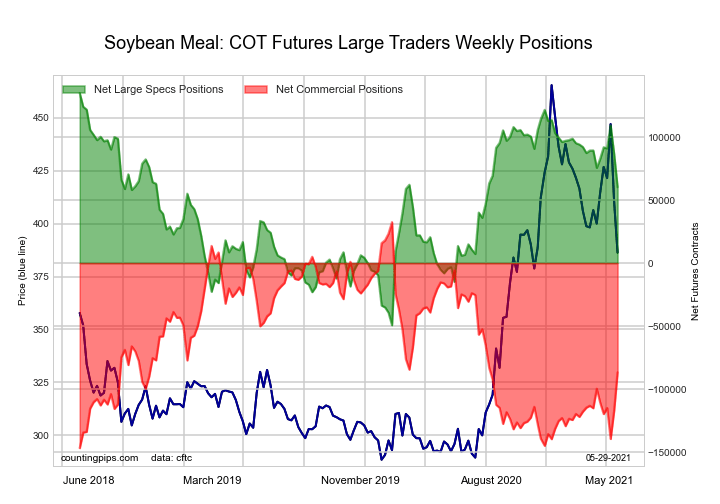
The SOYBEAN MEAL large speculator standing this week equaled a net position of 55,536 contracts in the data reported through Tuesday. This was a weekly fall of -4,758 contracts from the previous week which had a total of 60,294 net contracts.

This week’s current strength score (the trader positioning range over the past three years, measured from 0 to 100) shows the speculators are currently Bullish with a score of 60.5 percent. The commercials are Bearish with a score of 36.2 percent and the small traders (not shown in chart) are Bullish with a score of 71.4 percent.

SOYBEAN MEAL Futures StatisticsSPECULATORSCOMMERCIALSSMALL TRADERS
– Percent of Open Interest Longs:21.651.412.5
– Percent of Open Interest Shorts:7.771.56.2
– Net Position:55,536-80,69225,156
– Gross Longs:86,450205,85950,157
– Gross Shorts:30,914286,55125,001
– Long to Short Ratio:2.8 to 10.7 to 12.0 to 1
NET POSITION TREND:
– COT Index Score (3 Year Range Pct):60.536.271.4
– COT Index Reading (3 Year Range):BullishBearishBullish
NET POSITION MOVEMENT INDEX:
– 6-Week Change in Strength Index:-15.817.0-11.3


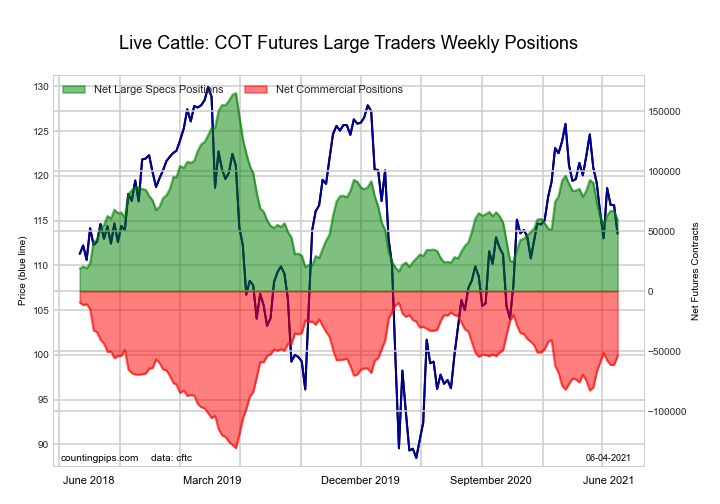
LIVE CATTLE Futures:

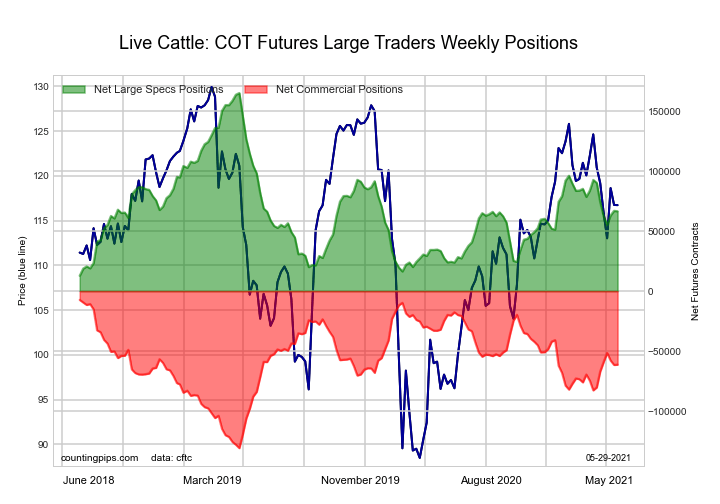
The LIVE CATTLE large speculator standing this week equaled a net position of 59,486 contracts in the data reported through Tuesday. This was a weekly reduction of -7,105 contracts from the previous week which had a total of 66,591 net contracts.

This week’s current strength score (the trader positioning range over the past three years, measured from 0 to 100) shows the speculators are currently Bearish with a score of 28.9 percent. The commercials are Bullish with a score of 63.4 percent and the small traders (not shown in chart) are Bullish with a score of 73.4 percent.

LIVE CATTLE Futures StatisticsSPECULATORSCOMMERCIALSSMALL TRADERS
– Percent of Open Interest Longs:37.439.09.6
– Percent of Open Interest Shorts:18.056.511.4
– Net Position:59,486-53,868-5,618
– Gross Longs:114,916119,93429,502
– Gross Shorts:55,430173,80235,120
– Long to Short Ratio:2.1 to 10.7 to 10.8 to 1
NET POSITION TREND:
– COT Index Score (3 Year Range Pct):28.963.473.4
– COT Index Reading (3 Year Range):BearishBullishBullish
NET POSITION MOVEMENT INDEX:
– 6-Week Change in Strength Index:-9.910.83.8


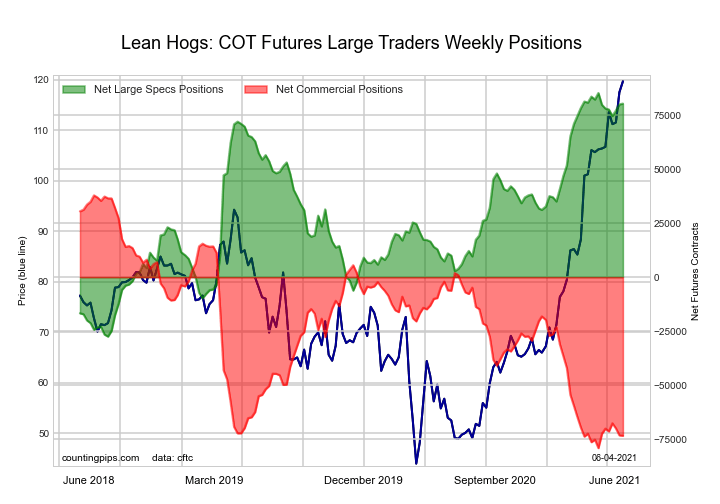
LEAN HOGS Futures:

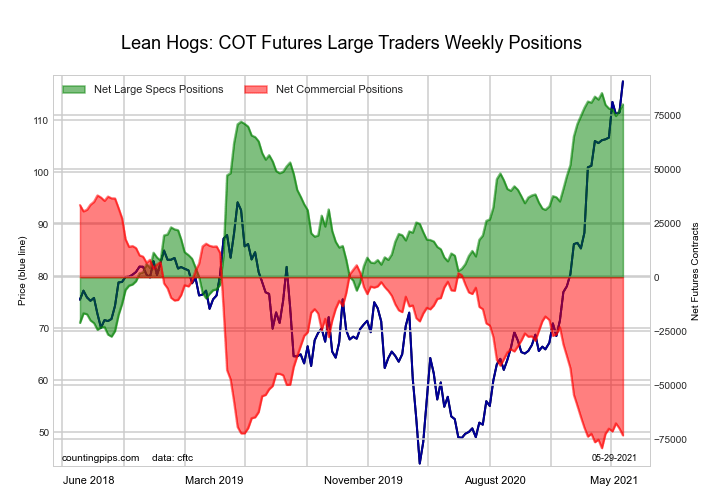
The LEAN HOGS large speculator standing this week equaled a net position of 80,295 contracts in the data reported through Tuesday. This was a weekly boost of 320 contracts from the previous week which had a total of 79,975 net contracts.

This week’s current strength score (the trader positioning range over the past three years, measured from 0 to 100) shows the speculators are currently Bullish-Extreme with a score of 95.6 percent. The commercials are Bearish-Extreme with a score of 4.9 percent and the small traders (not shown in chart) are Bearish with a score of 44.8 percent.

LEAN HOGS Futures StatisticsSPECULATORSCOMMERCIALSSMALL TRADERS
– Percent of Open Interest Longs:40.729.49.1
– Percent of Open Interest Shorts:13.754.111.4
– Net Position:80,295-73,356-6,939
– Gross Longs:120,88287,34327,073
– Gross Shorts:40,587160,69934,012
– Long to Short Ratio:3.0 to 10.5 to 10.8 to 1
NET POSITION TREND:
– COT Index Score (3 Year Range Pct):95.64.944.8
– COT Index Reading (3 Year Range):Bullish-ExtremeBearish-ExtremeBearish
NET POSITION MOVEMENT INDEX:
– 6-Week Change in Strength Index:0.5-0.71.7


COTTON Futures:

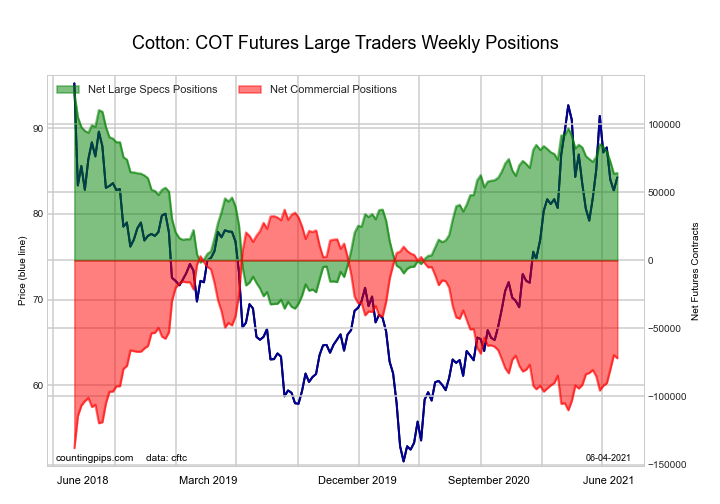
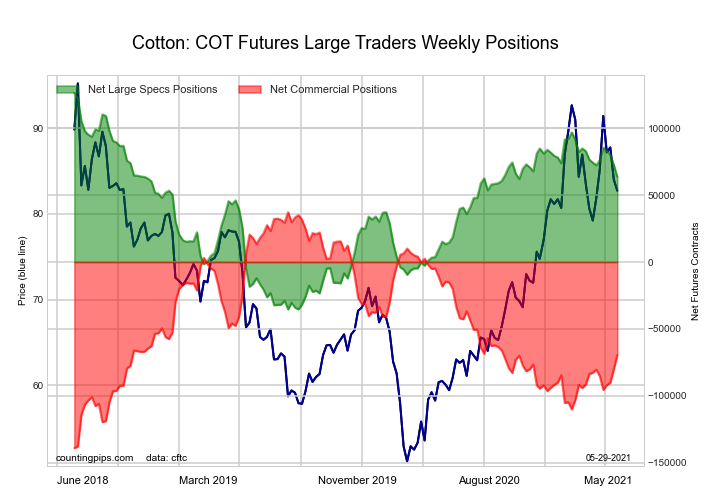
The COTTON large speculator standing this week equaled a net position of 64,206 contracts in the data reported through Tuesday. This was a weekly gain of 553 contracts from the previous week which had a total of 63,653 net contracts.

This week’s current strength score (the trader positioning range over the past three years, measured from 0 to 100) shows the speculators are currently Bullish with a score of 62.9 percent. The commercials are Bearish with a score of 37.7 percent and the small traders (not shown in chart) are Bullish with a score of 57.3 percent.

COTTON Futures StatisticsSPECULATORSCOMMERCIALSSMALL TRADERS
– Percent of Open Interest Longs:34.045.76.8
– Percent of Open Interest Shorts:6.176.93.5
– Net Position:64,206-71,8597,653
– Gross Longs:78,220105,16915,657
– Gross Shorts:14,014177,0288,004
– Long to Short Ratio:5.6 to 10.6 to 12.0 to 1
NET POSITION TREND:
– COT Index Score (3 Year Range Pct):62.937.757.3
– COT Index Reading (3 Year Range):BullishBearishBullish
NET POSITION MOVEMENT INDEX:
– 6-Week Change in Strength Index:-7.67.6-8.2


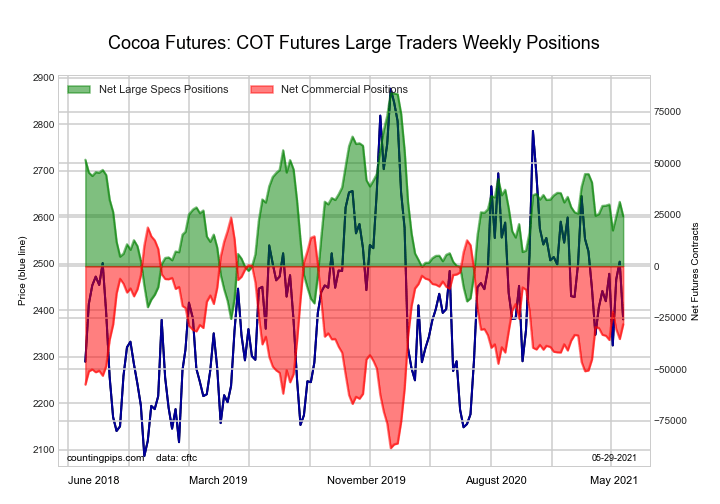
COCOA Futures:

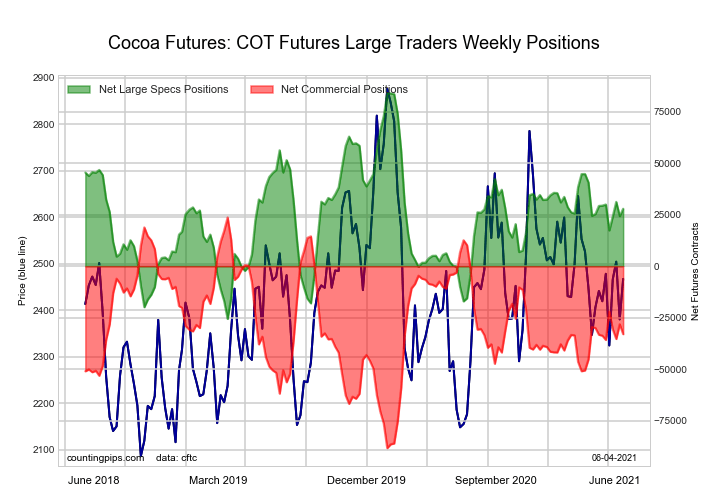
The COCOA large speculator standing this week equaled a net position of 27,878 contracts in the data reported through Tuesday. This was a weekly rise of 3,575 contracts from the previous week which had a total of 24,303 net contracts.

This week’s current strength score (the trader positioning range over the past three years, measured from 0 to 100) shows the speculators are currently Bearish with a score of 48.7 percent. The commercials are Bearish with a score of 49.4 percent and the small traders (not shown in chart) are Bullish with a score of 66.5 percent.

COCOA Futures StatisticsSPECULATORSCOMMERCIALSSMALL TRADERS
– Percent of Open Interest Longs:28.545.35.6
– Percent of Open Interest Shorts:15.261.13.2
– Net Position:27,878-32,9825,104
– Gross Longs:59,64594,89711,712
– Gross Shorts:31,767127,8796,608
– Long to Short Ratio:1.9 to 10.7 to 11.8 to 1
NET POSITION TREND:
– COT Index Score (3 Year Range Pct):48.749.466.5
– COT Index Reading (3 Year Range):BearishBearishBullish
NET POSITION MOVEMENT INDEX:
– 6-Week Change in Strength Index:-1.40.69.4


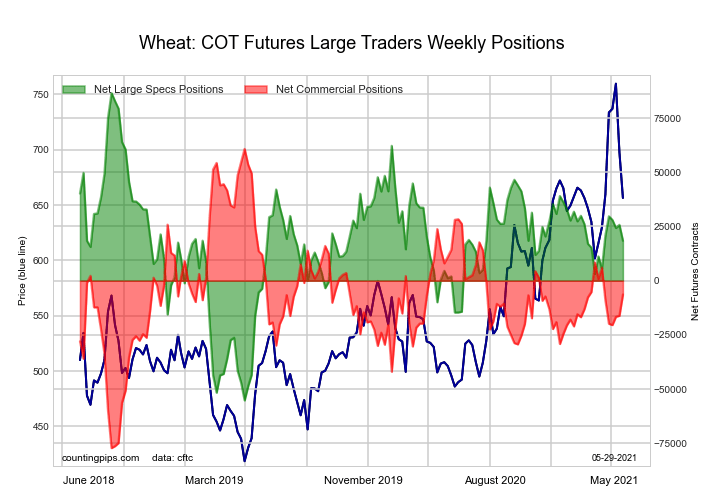
WHEAT Futures:

The WHEAT large speculator standing this week equaled a net position of 18,795 contracts in the data reported through Tuesday. This was a weekly advance of 384 contracts from the previous week which had a total of 18,411 net contracts.

This week’s current strength score (the trader positioning range over the past three years, measured from 0 to 100) shows the speculators are currently Bullish with a score of 52.2 percent. The commercials are Bearish with a score of 49.7 percent and the small traders (not shown in chart) are Bullish with a score of 52.7 percent.

WHEAT Futures StatisticsSPECULATORSCOMMERCIALSSMALL TRADERS
– Percent of Open Interest Longs:28.536.77.0
– Percent of Open Interest Shorts:23.838.89.6
– Net Position:18,795-8,556-10,239
– Gross Longs:113,330145,72827,774
– Gross Shorts:94,535154,28438,013
– Long to Short Ratio:1.2 to 10.9 to 10.7 to 1
NET POSITION TREND:
– COT Index Score (3 Year Range Pct):52.249.752.7
– COT Index Reading (3 Year Range):BullishBearishBullish
NET POSITION MOVEMENT INDEX:
– 6-Week Change in Strength Index:-1.60.48.1


Article By CountingPips.comReceive our weekly COT Reports by Email

*COT Report: The COT data, released weekly to the public each Friday, is updated through the most recent Tuesday (data is 3 days old) and shows a quick view of how large speculators or non-commercials (for-profit traders) were positioned in the futures markets.

The CFTC categorizes trader positions according to commercial hedgers (traders who use futures contracts for hedging as part of the business), non-commercials (large traders who speculate to realize trading profits) and nonreportable traders (usually small traders/speculators).

Find CFTC criteria here: (http://www.cftc.gov/MarketReports/CommitmentsofTraders/ExplanatoryNotes/index.htm).

COT Currency Futures Charts: Bitcoin, US Dollar, Euro, Ruble, Real, Franc, Yen & Aussie

By CountingPips.com COT Home | Data Tables | Data Downloads | Newsletter

Here are the latest charts and statistics for the Commitment of Traders (COT) data published by the Commodities Futures Trading Commission (CFTC).

The latest COT data is updated through Tuesday May 25 2021 and shows a quick view of how large traders (for-profit speculators and commercial entities) were positioned in the futures markets. All currency positions are in direct relation to the US dollar where, for example, a bet for the euro is a bet that the euro will rise versus the dollar while a bet against the euro will be a bet that the euro will decline versus the dollar.


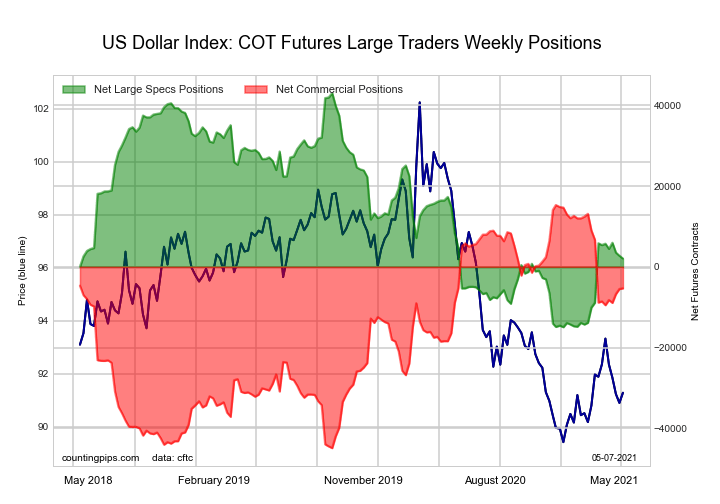
US Dollar Index Futures:


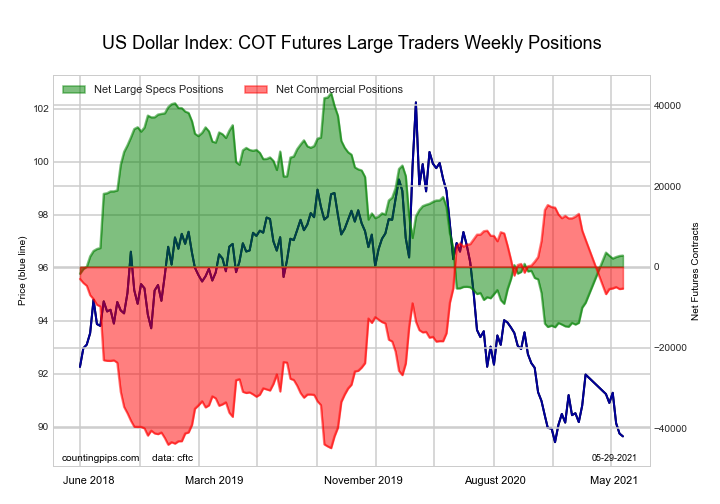
The US Dollar Index large speculator standing this week resulted in a net position of 2,780 contracts in the data reported through Tuesday. This was a weekly increase of 96 contracts from the previous week which had a total of 2,684 net contracts.

This week’s current strength score (the trader positioning range over the past three years, measured from 0 to 100) shows the speculators are currently Bearish with a score of 30.6 percent. The commercials are Bullish with a score of 65.6 percent and the small traders (not shown in chart) are Bullish with a score of 53.2 percent.

US DOLLAR INDEX StatisticsSPECULATORSCOMMERCIALSSMALL TRADERS
– Percent of Open Interest Longs:63.912.614.3
– Percent of Open Interest Shorts:57.425.18.2
– Net Position:2,780-5,3902,610
– Gross Longs:27,4885,4136,159
– Gross Shorts:24,70810,8033,549
– Long to Short Ratio:1.1 to 10.5 to 11.7 to 1
NET POSITION TREND:
– COT Index Score (3 Year Range Pct):30.665.653.2
– COT Index Reading (3 Year Range):BearishBullishBullish
NET POSITION MOVEMENT INDEX:
– 6-Week Change in Strength Index:-5.55.9-4.7


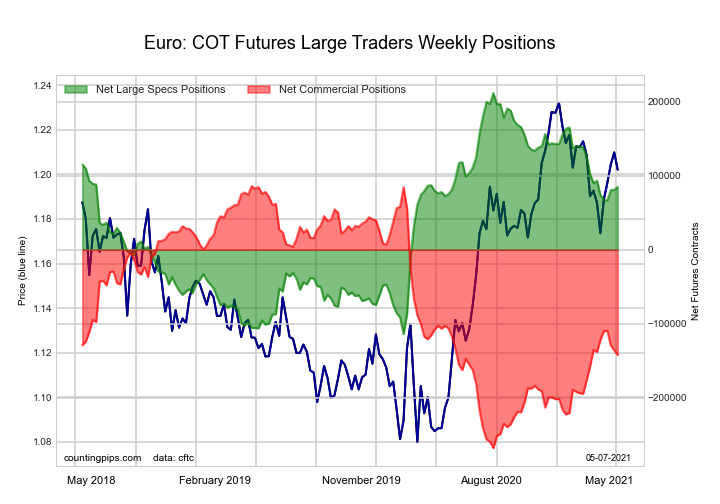
Euro Currency Futures:


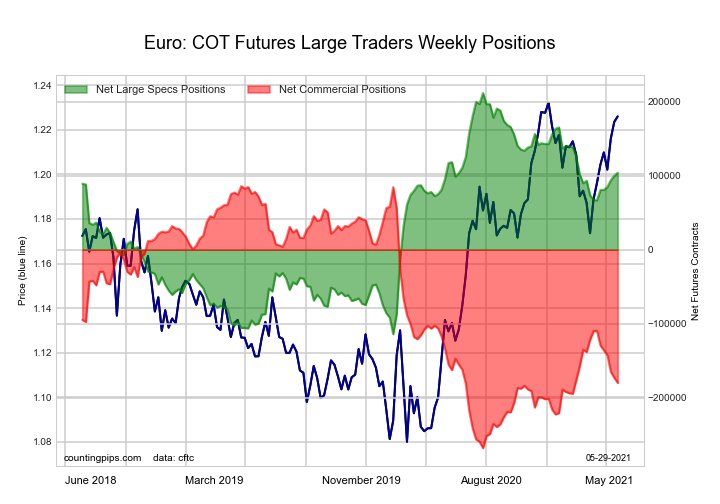
The Euro Currency large speculator standing this week resulted in a net position of 104,000 contracts in the data reported through Tuesday. This was a weekly gain of 4,142 contracts from the previous week which had a total of 99,858 net contracts.

This week’s current strength score (the trader positioning range over the past three years, measured from 0 to 100) shows the speculators are currently Bullish with a score of 66.9 percent. The commercials are Bearish with a score of 24.9 percent and the small traders (not shown in chart) are Bullish-Extreme with a score of 100.0 percent.

EURO Currency StatisticsSPECULATORSCOMMERCIALSSMALL TRADERS
– Percent of Open Interest Longs:32.051.715.1
– Percent of Open Interest Shorts:17.976.14.8
– Net Position:104,000-179,86675,866
– Gross Longs:236,103381,869111,477
– Gross Shorts:132,103561,73535,611
– Long to Short Ratio:1.8 to 10.7 to 13.1 to 1
NET POSITION TREND:
– COT Index Score (3 Year Range Pct):66.924.9100.0
– COT Index Reading (3 Year Range):BullishBearishBullish-Extreme
NET POSITION MOVEMENT INDEX:
– 6-Week Change in Strength Index:11.4-19.846.9


British Pound Sterling Futures:


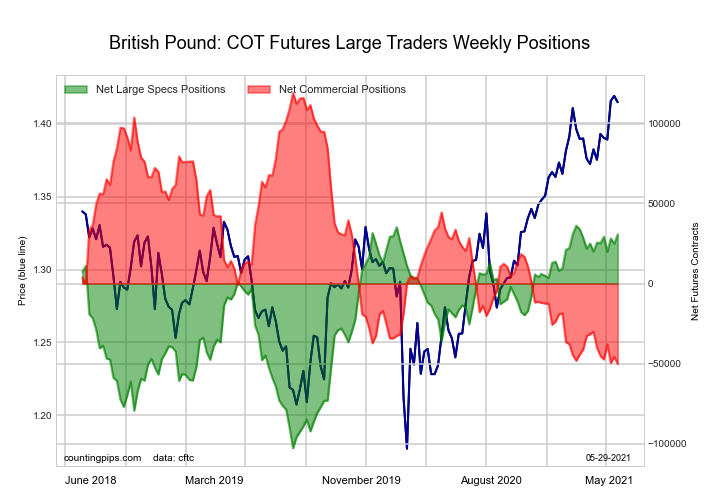
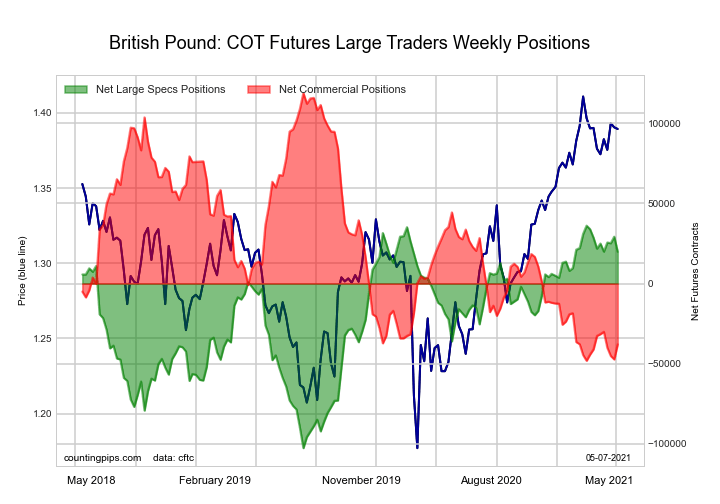
The British Pound Sterling large speculator standing this week resulted in a net position of 30,659 contracts in the data reported through Tuesday. This was a weekly lift of 5,759 contracts from the previous week which had a total of 24,900 net contracts.

This week’s current strength score (the trader positioning range over the past three years, measured from 0 to 100) shows the speculators are currently Bullish-Extreme with a score of 96.1 percent. The commercials are Bearish-Extreme with a score of 0.0 percent and the small traders (not shown in chart) are Bullish-Extreme with a score of 96.1 percent.

BRITISH POUND StatisticsSPECULATORSCOMMERCIALSSMALL TRADERS
– Percent of Open Interest Longs:37.937.224.2
– Percent of Open Interest Shorts:19.866.912.7
– Net Position:30,659-50,19019,531
– Gross Longs:64,19363,05840,988
– Gross Shorts:33,534113,24821,457
– Long to Short Ratio:1.9 to 10.6 to 11.9 to 1
NET POSITION TREND:
– COT Index Score (3 Year Range Pct):96.10.096.1
– COT Index Reading (3 Year Range):Bullish-ExtremeBearish-ExtremeBullish-Extreme
NET POSITION MOVEMENT INDEX:
– 6-Week Change in Strength Index:3.7-6.010.5


Japanese Yen Futures:


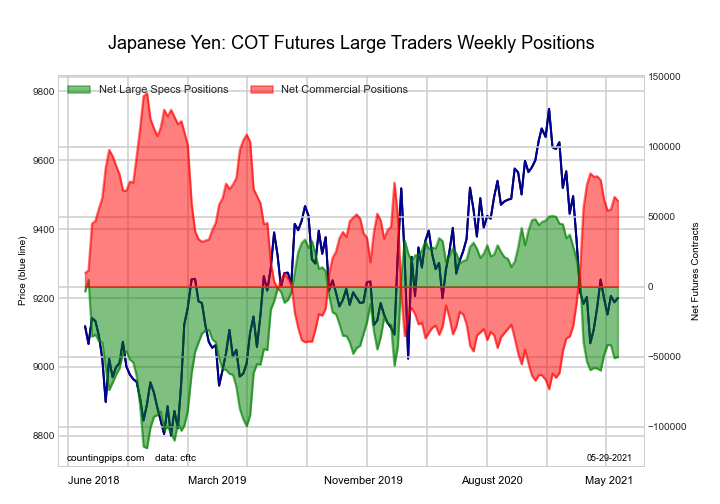
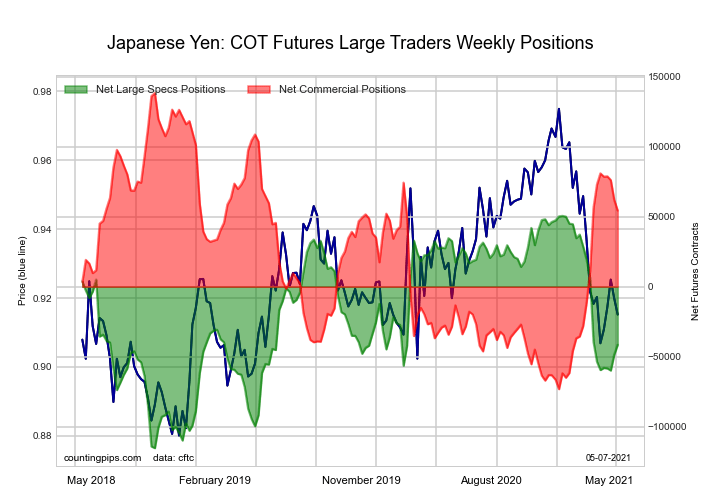
The Japanese Yen large speculator standing this week resulted in a net position of -50,156 contracts in the data reported through Tuesday. This was a weekly increase of 792 contracts from the previous week which had a total of -50,948 net contracts.

This week’s current strength score (the trader positioning range over the past three years, measured from 0 to 100) shows the speculators are currently Bearish with a score of 39.2 percent. The commercials are Bullish with a score of 63.6 percent and the small traders (not shown in chart) are Bearish with a score of 34.8 percent.

JAPANESE YEN StatisticsSPECULATORSCOMMERCIALSSMALL TRADERS
– Percent of Open Interest Longs:15.870.112.5
– Percent of Open Interest Shorts:48.530.019.8
– Net Position:-50,15661,353-11,197
– Gross Longs:24,163107,37719,120
– Gross Shorts:74,31946,02430,317
– Long to Short Ratio:0.3 to 12.3 to 10.6 to 1
NET POSITION TREND:
– COT Index Score (3 Year Range Pct):39.263.634.8
– COT Index Reading (3 Year Range):BearishBullishBearish
NET POSITION MOVEMENT INDEX:
– 6-Week Change in Strength Index:4.9-8.217.7


Swiss Franc Futures:


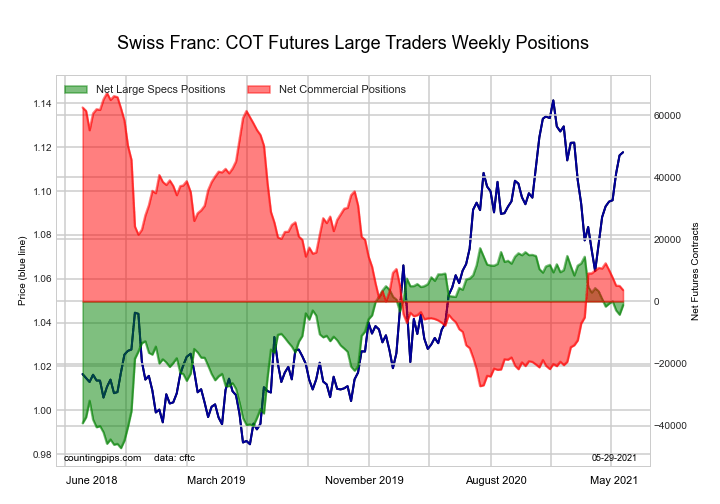
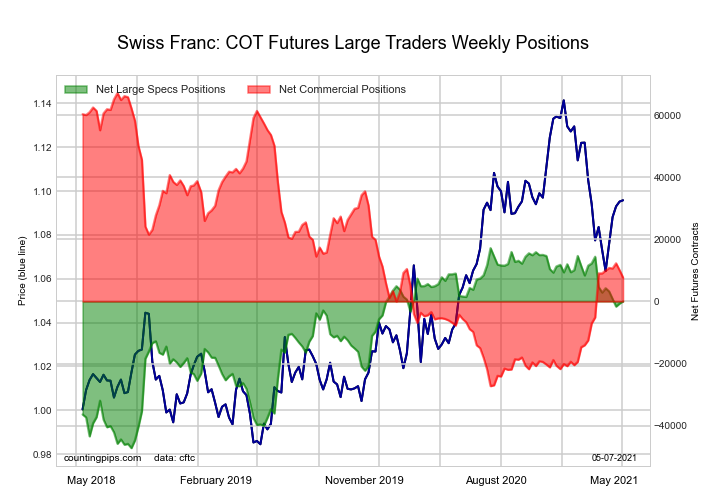
The Swiss Franc large speculator standing this week resulted in a net position of -1,203 contracts in the data reported through Tuesday. This was a weekly lift of 3,062 contracts from the previous week which had a total of -4,265 net contracts.

This week’s current strength score (the trader positioning range over the past three years, measured from 0 to 100) shows the speculators are currently Bullish with a score of 71.5 percent. The commercials are Bearish with a score of 32.8 percent and the small traders (not shown in chart) are Bullish with a score of 59.0 percent.

SWISS FRANC StatisticsSPECULATORSCOMMERCIALSSMALL TRADERS
– Percent of Open Interest Longs:28.141.430.4
– Percent of Open Interest Shorts:30.832.936.1
– Net Position:-1,2033,679-2,476
– Gross Longs:12,22317,99713,233
– Gross Shorts:13,42614,31815,709
– Long to Short Ratio:0.9 to 11.3 to 10.8 to 1
NET POSITION TREND:
– COT Index Score (3 Year Range Pct):71.532.859.0
– COT Index Reading (3 Year Range):BullishBearishBullish
NET POSITION MOVEMENT INDEX:
– 6-Week Change in Strength Index:-3.1-7.424.5


Canadian Dollar Futures:


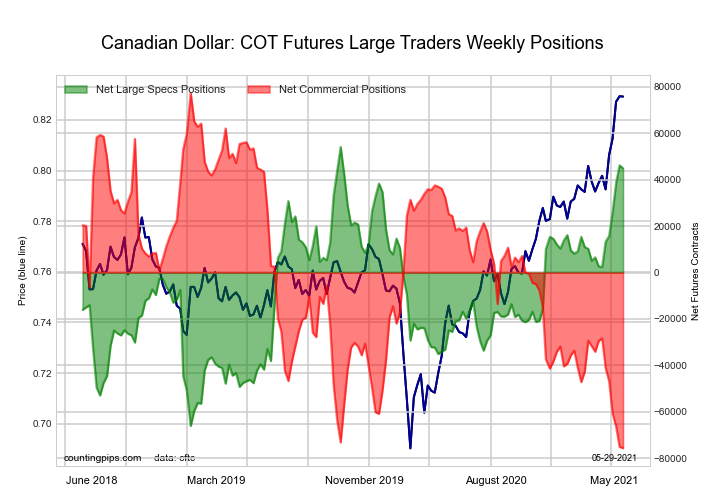
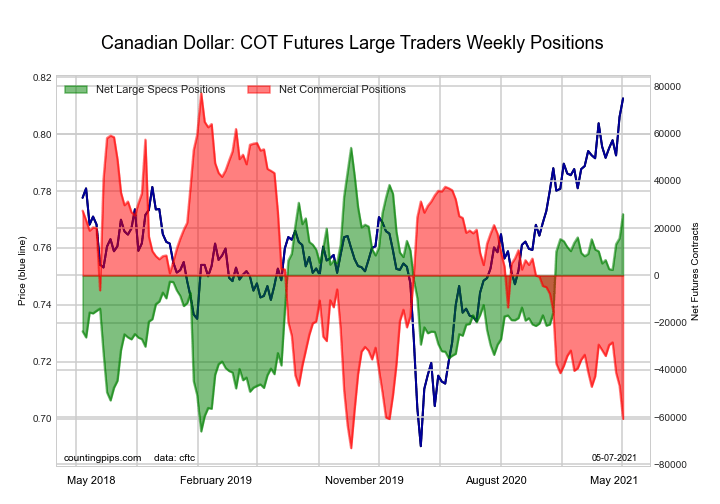
The Canadian Dollar large speculator standing this week resulted in a net position of 44,811 contracts in the data reported through Tuesday. This was a weekly decrease of -1,301 contracts from the previous week which had a total of 46,112 net contracts.

This week’s current strength score (the trader positioning range over the past three years, measured from 0 to 100) shows the speculators are currently Bullish-Extreme with a score of 92.3 percent. The commercials are Bearish-Extreme with a score of 0.0 percent and the small traders (not shown in chart) are Bullish-Extreme with a score of 93.1 percent.

CANADIAN DOLLAR StatisticsSPECULATORSCOMMERCIALSSMALL TRADERS
– Percent of Open Interest Longs:39.535.923.1
– Percent of Open Interest Shorts:18.571.38.7
– Net Position:44,811-75,53530,724
– Gross Longs:84,18376,43949,306
– Gross Shorts:39,372151,97418,582
– Long to Short Ratio:2.1 to 10.5 to 12.7 to 1
NET POSITION TREND:
– COT Index Score (3 Year Range Pct):92.30.093.1
– COT Index Reading (3 Year Range):Bullish-ExtremeBearish-ExtremeBullish-Extreme
NET POSITION MOVEMENT INDEX:
– 6-Week Change in Strength Index:35.3-30.97.2


Australian Dollar Futures:


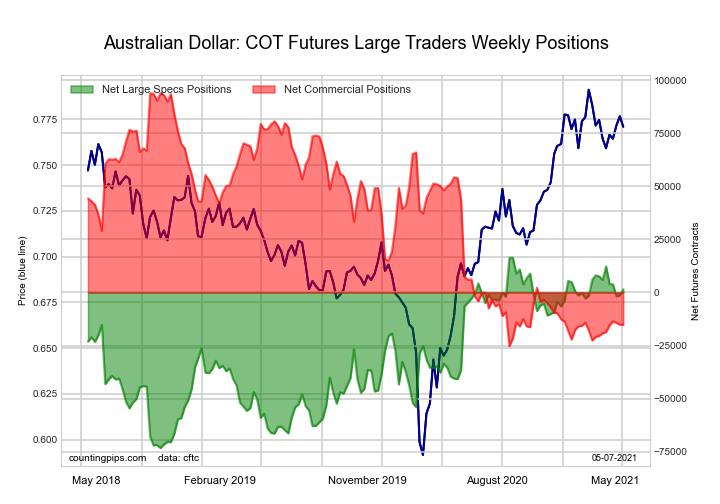
The Australian Dollar large speculator standing this week resulted in a net position of -809 contracts in the data reported through Tuesday. This was a weekly lowering of -3,811 contracts from the previous week which had a total of 3,002 net contracts.

This week’s current strength score (the trader positioning range over the past three years, measured from 0 to 100) shows the speculators are currently Bullish-Extreme with a score of 80.9 percent. The commercials are Bearish-Extreme with a score of 10.5 percent and the small traders (not shown in chart) are Bullish-Extreme with a score of 87.0 percent.

AUSTRALIAN DOLLAR StatisticsSPECULATORSCOMMERCIALSSMALL TRADERS
– Percent of Open Interest Longs:40.936.721.9
– Percent of Open Interest Shorts:41.546.111.8
– Net Position:-809-12,78913,598
– Gross Longs:55,09849,40129,543
– Gross Shorts:55,90762,19015,945
– Long to Short Ratio:1.0 to 10.8 to 11.9 to 1
NET POSITION TREND:
– COT Index Score (3 Year Range Pct):80.910.587.0
– COT Index Reading (3 Year Range):Bullish-ExtremeBearish-ExtremeBullish-Extreme
NET POSITION MOVEMENT INDEX:
– 6-Week Change in Strength Index:-5.10.68.4


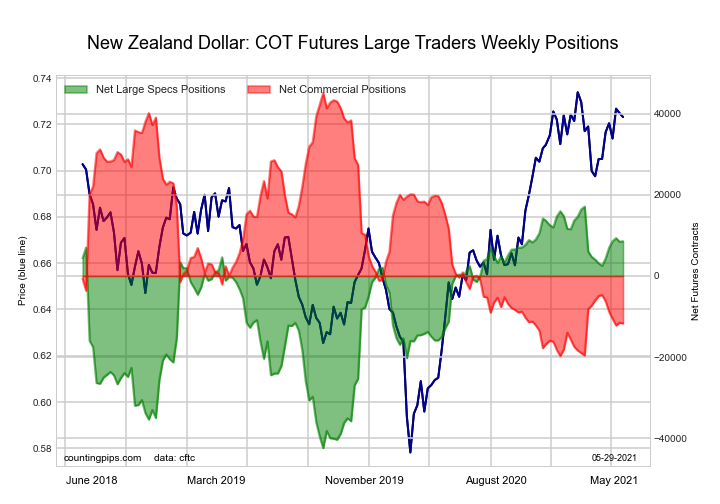
New Zealand Dollar Futures:


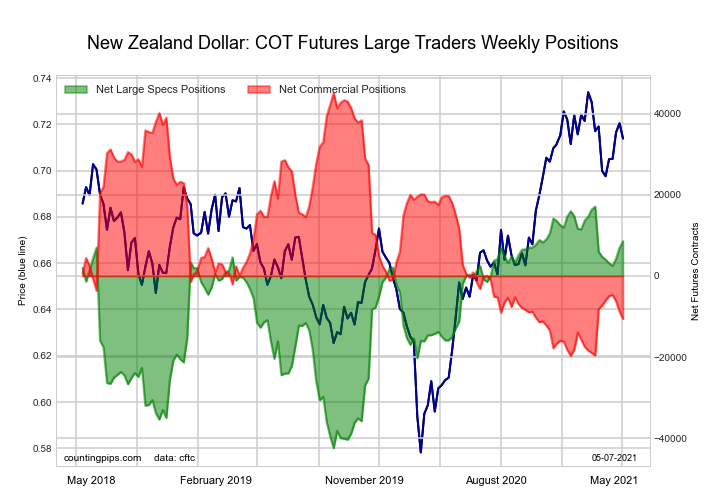
The New Zealand Dollar large speculator standing this week resulted in a net position of 8,585 contracts in the data reported through Tuesday. This was a weekly gain of 135 contracts from the previous week which had a total of 8,450 net contracts.

This week’s current strength score (the trader positioning range over the past three years, measured from 0 to 100) shows the speculators are currently Bullish-Extreme with a score of 85.7 percent. The commercials are Bearish-Extreme with a score of 12.4 percent and the small traders (not shown in chart) are Bullish-Extreme with a score of 88.0 percent.

NEW ZEALAND DOLLAR StatisticsSPECULATORSCOMMERCIALSSMALL TRADERS
– Percent of Open Interest Longs:55.329.313.3
– Percent of Open Interest Shorts:35.855.86.2
– Net Position:8,585-11,7073,122
– Gross Longs:24,44612,9735,873
– Gross Shorts:15,86124,6802,751
– Long to Short Ratio:1.5 to 10.5 to 12.1 to 1
NET POSITION TREND:
– COT Index Score (3 Year Range Pct):85.712.488.0
– COT Index Reading (3 Year Range):Bullish-ExtremeBearish-ExtremeBullish-Extreme
NET POSITION MOVEMENT INDEX:
– 6-Week Change in Strength Index:10.2-10.810.7


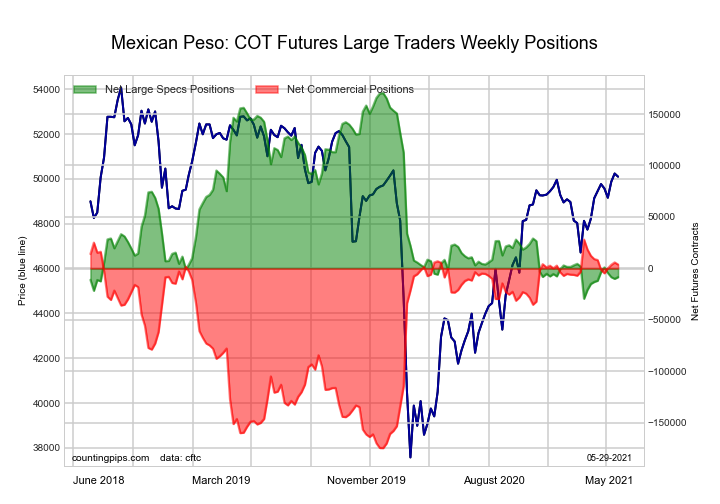
Mexican Peso Futures:


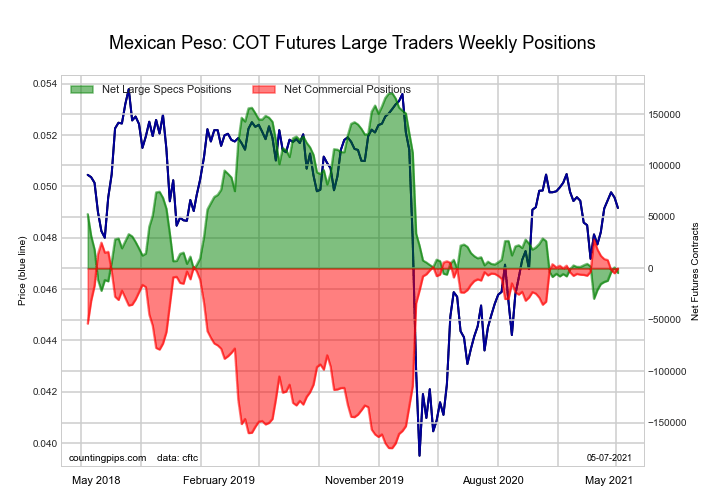
The Mexican Peso large speculator standing this week resulted in a net position of -8,498 contracts in the data reported through Tuesday. This was a weekly advance of 1,620 contracts from the previous week which had a total of -10,118 net contracts.

This week’s current strength score (the trader positioning range over the past three years, measured from 0 to 100) shows the speculators are currently Bearish-Extreme with a score of 10.5 percent. The commercials are Bullish-Extreme with a score of 88.0 percent and the small traders (not shown in chart) are Bullish with a score of 63.1 percent.

MEXICAN PESO StatisticsSPECULATORSCOMMERCIALSSMALL TRADERS
– Percent of Open Interest Longs:43.547.95.2
– Percent of Open Interest Shorts:49.345.32.0
– Net Position:-8,4983,7684,730
– Gross Longs:63,86870,3617,663
– Gross Shorts:72,36666,5932,933
– Long to Short Ratio:0.9 to 11.1 to 12.6 to 1
NET POSITION TREND:
– COT Index Score (3 Year Range Pct):10.588.063.1
– COT Index Reading (3 Year Range):Bearish-ExtremeBullish-ExtremeBullish
NET POSITION MOVEMENT INDEX:
– 6-Week Change in Strength Index:1.7-2.13.6


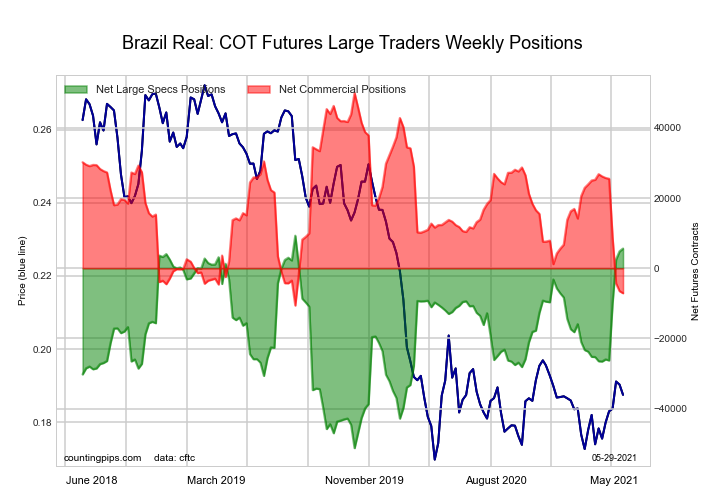
Brazilian Real Futures:


The Brazilian Real large speculator standing this week resulted in a net position of 5,607 contracts in the data reported through Tuesday. This was a weekly gain of 776 contracts from the previous week which had a total of 4,831 net contracts.

This week’s current strength score (the trader positioning range over the past three years, measured from 0 to 100) shows the speculators are currently Bullish-Extreme with a score of 94.0 percent. The commercials are Bearish-Extreme with a score of 5.8 percent and the small traders (not shown in chart) are Bullish-Extreme with a score of 90.6 percent.

BRAZIL REAL StatisticsSPECULATORSCOMMERCIALSSMALL TRADERS
– Percent of Open Interest Longs:39.355.25.2
– Percent of Open Interest Shorts:30.866.02.9
– Net Position:5,607-7,1131,506
– Gross Longs:25,83636,2513,427
– Gross Shorts:20,22943,3641,921
– Long to Short Ratio:1.3 to 10.8 to 11.8 to 1
NET POSITION TREND:
– COT Index Score (3 Year Range Pct):94.05.890.6
– COT Index Reading (3 Year Range):Bullish-ExtremeBearish-ExtremeBullish-Extreme
NET POSITION MOVEMENT INDEX:
– 6-Week Change in Strength Index:53.2-55.014.1


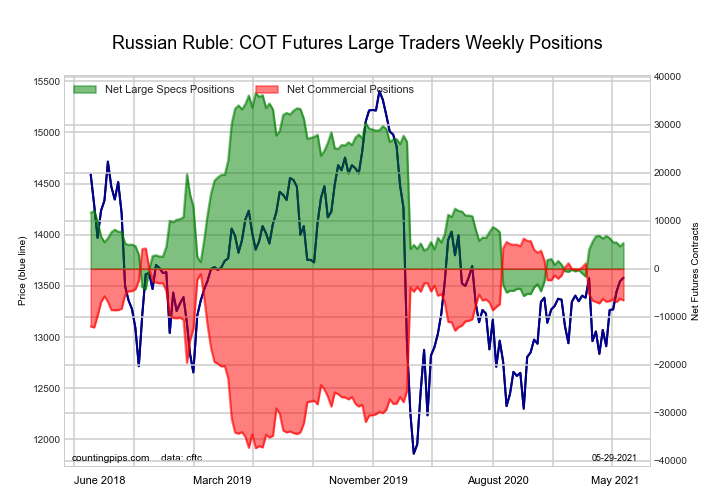
Russian Ruble Futures:


The Russian Ruble large speculator standing this week resulted in a net position of 5,372 contracts in the data reported through Tuesday. This was a weekly lift of 692 contracts from the previous week which had a total of 4,680 net contracts.

This week’s current strength score (the trader positioning range over the past three years, measured from 0 to 100) shows the speculators are currently Bearish with a score of 26.1 percent. The commercials are Bullish with a score of 70.5 percent and the small traders (not shown in chart) are Bullish-Extreme with a score of 82.1 percent.

RUSSIAN RUBLE StatisticsSPECULATORSCOMMERCIALSSMALL TRADERS
– Percent of Open Interest Longs:36.356.86.9
– Percent of Open Interest Shorts:20.975.53.6
– Net Position:5,372-6,5521,180
– Gross Longs:12,71819,9272,429
– Gross Shorts:7,34626,4791,249
– Long to Short Ratio:1.7 to 10.8 to 11.9 to 1
NET POSITION TREND:
– COT Index Score (3 Year Range Pct):26.170.582.1
– COT Index Reading (3 Year Range):BearishBullishBullish-Extreme
NET POSITION MOVEMENT INDEX:
– 6-Week Change in Strength Index:-2.2-0.742.4


Bitcoin Futures:


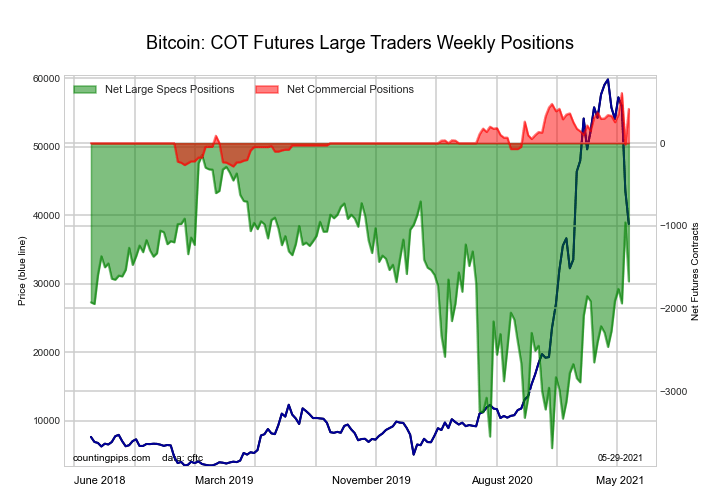
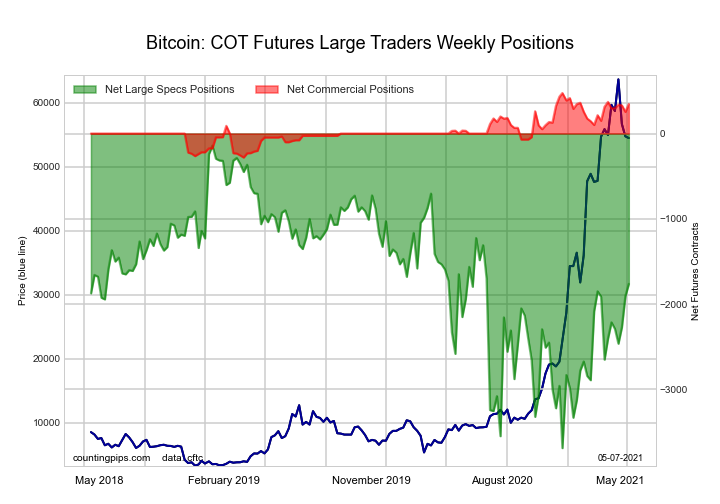
The Bitcoin large speculator standing this week resulted in a net position of -1,672 contracts in the data reported through Tuesday. This was a weekly lowering of -713 contracts from the previous week which had a total of -959 net contracts.

This week’s current strength score (the trader positioning range over the past three years, measured from 0 to 100) shows the speculators are currently Bullish with a score of 56.9 percent. The commercials are Bullish with a score of 78.4 percent and the small traders (not shown in chart) are Bearish with a score of 31.0 percent.

BITCOIN StatisticsSPECULATORSCOMMERCIALSSMALL TRADERS
– Percent of Open Interest Longs:56.57.123.3
– Percent of Open Interest Shorts:75.32.49.2
– Net Position:-1,6724151,257
– Gross Longs:5,0246312,071
– Gross Shorts:6,696216814
– Long to Short Ratio:0.8 to 12.9 to 12.5 to 1
NET POSITION TREND:
– COT Index Score (3 Year Range Pct):56.978.431.0
– COT Index Reading (3 Year Range):BullishBullishBearish
NET POSITION MOVEMENT INDEX:
– 6-Week Change in Strength Index:22.48.4-28.6


Article By CountingPips.comReceive our weekly COT Reports by Email

*COT Report: The COT data, released weekly to the public each Friday, is updated through the most recent Tuesday (data is 3 days old) and shows a quick view of how large speculators or non-commercials (for-profit traders) were positioned in the futures markets.

The CFTC categorizes trader positions according to commercial hedgers (traders who use futures contracts for hedging as part of the business), non-commercials (large traders who speculate to realize trading profits) and nonreportable traders (usually small traders/speculators).

Find CFTC criteria here: (http://www.cftc.gov/MarketReports/CommitmentsofTraders/ExplanatoryNotes/index.htm).
COT Metals Futures Charts: Copper, Silver, Gold, Platinum & Palladium

By CountingPips.com COT Home | Data Tables | Data Downloads | Newsletter

Here are the latest charts and statistics for the Commitment of Traders (COT) data published by the Commodities Futures Trading Commission (CFTC).

The latest COT data is updated through Tuesday May 25 2021 and shows a quick view of how large traders (for-profit speculators and commercial entities) were positioned in the futures markets.


Gold Comex Futures Futures:


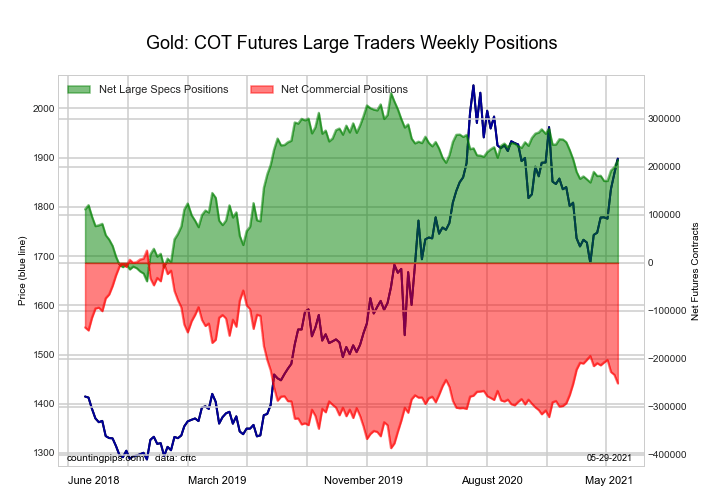
The Gold Comex Futures large speculator standing this week reached a net position of 214,642 contracts in the data reported through Tuesday. This was a weekly lift of 15,753 contracts from the previous week which had a total of 198,889 net contracts.

This week’s current strength score (the trader positioning range over the past three years, measured from 0 to 100) shows the speculators are currently Bullish with a score of 64.5 percent. The commercials are Bearish with a score of 32.7 percent and the small traders (not shown in chart) are Bullish with a score of 71.6 percent.

Gold Futures StatisticsSPECULATORSCOMMERCIALSSMALL TRADERS
– Percent of Open Interest Longs:56.521.811.7
– Percent of Open Interest Shorts:14.470.94.6
– Net Position:214,642-250,86936,227
– Gross Longs:288,266111,02459,511
– Gross Shorts:73,624361,89323,284
– Long to Short Ratio:3.9 to 10.3 to 12.6 to 1
NET POSITION TREND:
– COT Index Score (3 Year Range Pct):64.532.771.6
– COT Index Reading (3 Year Range):BullishBearishBullish
NET POSITION MOVEMENT INDEX:
– 6-Week Change in Strength Index:8.6-10.220.3


Silver Comex Futures Futures:


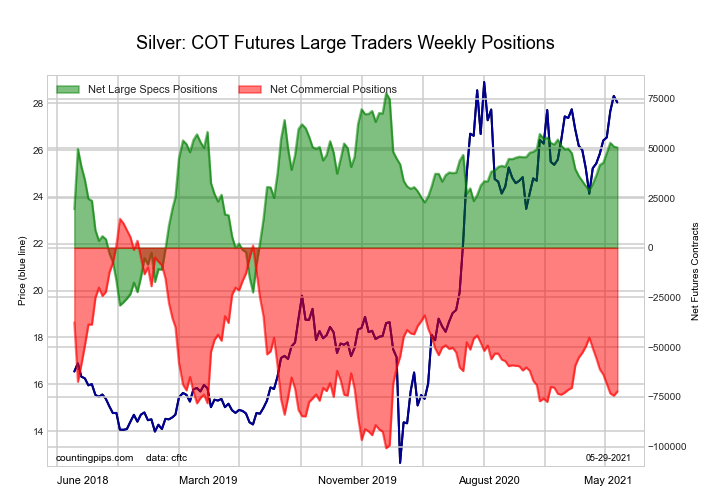
The Silver Comex Futures large speculator standing this week reached a net position of 50,482 contracts in the data reported through Tuesday. This was a weekly lowering of -499 contracts from the previous week which had a total of 50,981 net contracts.

This week’s current strength score (the trader positioning range over the past three years, measured from 0 to 100) shows the speculators are currently Bullish with a score of 74.4 percent. The commercials are Bearish with a score of 24.7 percent and the small traders (not shown in chart) are Bullish with a score of 68.6 percent.

Silver Futures StatisticsSPECULATORSCOMMERCIALSSMALL TRADERS
– Percent of Open Interest Longs:47.628.517.4
– Percent of Open Interest Shorts:19.668.45.3
– Net Position:50,482-72,27421,792
– Gross Longs:86,01351,48731,411
– Gross Shorts:35,531123,7619,619
– Long to Short Ratio:2.4 to 10.4 to 13.3 to 1
NET POSITION TREND:
– COT Index Score (3 Year Range Pct):74.424.768.6
– COT Index Reading (3 Year Range):BullishBearishBullish
NET POSITION MOVEMENT INDEX:
– 6-Week Change in Strength Index:13.2-14.516.4


Copper Grade #1 Futures Futures:


The Copper Grade #1 Futures large speculator standing this week reached a net position of 23,713 contracts in the data reported through Tuesday. This was a weekly decrease of -15,265 contracts from the previous week which had a total of 38,978 net contracts.

This week’s current strength score (the trader positioning range over the past three years, measured from 0 to 100) shows the speculators are currently Bullish with a score of 59.4 percent. The commercials are Bearish with a score of 34.6 percent and the small traders (not shown in chart) are Bullish-Extreme with a score of 98.5 percent.

Copper Futures StatisticsSPECULATORSCOMMERCIALSSMALL TRADERS
– Percent of Open Interest Longs:40.833.110.3
– Percent of Open Interest Shorts:30.648.84.9
– Net Position:23,713-36,20212,489
– Gross Longs:94,20676,31923,807
– Gross Shorts:70,493112,52111,318
– Long to Short Ratio:1.3 to 10.7 to 12.1 to 1
NET POSITION TREND:
– COT Index Score (3 Year Range Pct):59.434.698.5
– COT Index Reading (3 Year Range):BullishBearishBullish-Extreme
NET POSITION MOVEMENT INDEX:
– 6-Week Change in Strength Index:-8.88.5-0.8


Platinum Futures Futures:


The Platinum Futures large speculator standing this week reached a net position of 22,987 contracts in the data reported through Tuesday. This was a weekly fall of -2,827 contracts from the previous week which had a total of 25,814 net contracts.

This week’s current strength score (the trader positioning range over the past three years, measured from 0 to 100) shows the speculators are currently Bearish with a score of 43.9 percent. The commercials are Bullish with a score of 53.4 percent and the small traders (not shown in chart) are Bullish-Extreme with a score of 93.7 percent.

Platinum Futures StatisticsSPECULATORSCOMMERCIALSSMALL TRADERS
– Percent of Open Interest Longs:56.820.217.8
– Percent of Open Interest Shorts:22.668.43.8
– Net Position:22,987-32,4229,435
– Gross Longs:38,18813,57711,960
– Gross Shorts:15,20145,9992,525
– Long to Short Ratio:2.5 to 10.3 to 14.7 to 1
NET POSITION TREND:
– COT Index Score (3 Year Range Pct):43.953.493.7
– COT Index Reading (3 Year Range):BearishBullishBullish-Extreme
NET POSITION MOVEMENT INDEX:
– 6-Week Change in Strength Index:-2.12.3-2.8


Palladium Futures Futures:


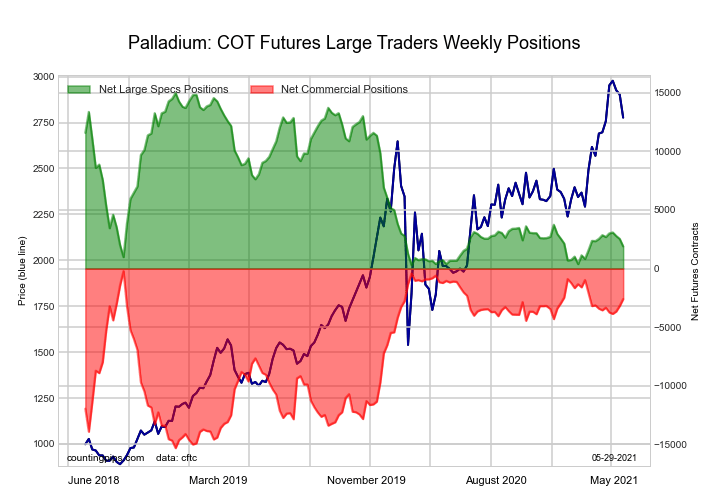
The Palladium Futures large speculator standing this week reached a net position of 1,893 contracts in the data reported through Tuesday. This was a weekly fall of -644 contracts from the previous week which had a total of 2,537 net contracts.

This week’s current strength score (the trader positioning range over the past three years, measured from 0 to 100) shows the speculators are currently Bearish-Extreme with a score of 10.9 percent. The commercials are Bullish-Extreme with a score of 84.2 percent and the small traders (not shown in chart) are Bullish-Extreme with a score of 86.3 percent.

Palladium Futures StatisticsSPECULATORSCOMMERCIALSSMALL TRADERS
– Percent of Open Interest Longs:51.828.914.8
– Percent of Open Interest Shorts:34.053.38.2
– Net Position:1,893-2,598705
– Gross Longs:5,5083,0661,575
– Gross Shorts:3,6155,664870
– Long to Short Ratio:1.5 to 10.5 to 11.8 to 1
NET POSITION TREND:
– COT Index Score (3 Year Range Pct):10.984.286.3
– COT Index Reading (3 Year Range):Bearish-ExtremeBullish-ExtremeBullish-Extreme
NET POSITION MOVEMENT INDEX:
– 6-Week Change in Strength Index:-6.56.30.5


Article By CountingPips.comReceive our weekly COT Reports by Email

*COT Report: The COT data, released weekly to the public each Friday, is updated through the most recent Tuesday (data is 3 days old) and shows a quick view of how large speculators or non-commercials (for-profit traders) were positioned in the futures markets.

The CFTC categorizes trader positions according to commercial hedgers (traders who use futures contracts for hedging as part of the business), non-commercials (large traders who speculate to realize trading profits) and nonreportable traders (usually small traders/speculators).

Find CFTC criteria here: (http://www.cftc.gov/MarketReports/CommitmentsofTraders/ExplanatoryNotes/index.htm).
COT Stock Market Futures Charts: SP500, VIX, Dow, Russell2000, Emerging Markets

By CountingPips.com COT Home | Data Tables | Data Downloads | Newsletter

Here are the latest charts and statistics for the Commitment of Traders (COT) data published by the Commodities Futures Trading Commission (CFTC).

The latest COT data is updated through Tuesday May 25 2021 and shows a quick view of how large traders (for-profit speculators and commercial entities) were positioned in the futures markets.


VIX Volatility Futures Futures:


The VIX Volatility Futures large speculator standing this week recorded a net position of -60,932 contracts in the data reported through Tuesday. This was a weekly boost of 1,308 contracts from the previous week which had a total of -62,240 net contracts.

This week’s current strength score (the trader positioning range over the past three years, measured from 0 to 100) shows the speculators are currently Bullish with a score of 59.9 percent. The commercials are Bearish with a score of 41.5 percent and the small traders (not shown in chart) are Bearish with a score of 29.9 percent.

VIX Volatility Futures StatisticsSPECULATORSCOMMERCIALSSMALL TRADERS
– Percent of Open Interest Longs:24.149.26.2
– Percent of Open Interest Shorts:42.229.18.3
– Net Position:-60,93267,920-6,988
– Gross Longs:81,366165,88821,052
– Gross Shorts:142,29897,96828,040
– Long to Short Ratio:0.6 to 11.7 to 10.8 to 1
NET POSITION TREND:
– COT Index Score (3 Year Range Pct):59.941.529.9
– COT Index Reading (3 Year Range):BullishBearishBearish
NET POSITION MOVEMENT INDEX:
– 6-Week Change in Strength Index:15.9-14.7-6.2


S&P500 Mini Futures Futures:


The S&P500 Mini Futures large speculator standing this week recorded a net position of -18,488 contracts in the data reported through Tuesday. This was a weekly increase of 4,703 contracts from the previous week which had a total of -23,191 net contracts.

This week’s current strength score (the trader positioning range over the past three years, measured from 0 to 100) shows the speculators are currently Bullish with a score of 50.3 percent. The commercials are Bullish with a score of 61.8 percent and the small traders (not shown in chart) are Bearish with a score of 46.2 percent.

S&P500 Mini Futures StatisticsSPECULATORSCOMMERCIALSSMALL TRADERS
– Percent of Open Interest Longs:14.469.513.0
– Percent of Open Interest Shorts:15.173.48.4
– Net Position:-18,488-106,482124,970
– Gross Longs:393,6201,901,593354,906
– Gross Shorts:412,1082,008,075229,936
– Long to Short Ratio:1.0 to 10.9 to 11.5 to 1
NET POSITION TREND:
– COT Index Score (3 Year Range Pct):50.361.846.2
– COT Index Reading (3 Year Range):BullishBullishBearish
NET POSITION MOVEMENT INDEX:
– 6-Week Change in Strength Index:3.8-8.17.7


Dow Jones Mini Futures Futures:


The Dow Jones Mini Futures large speculator standing this week recorded a net position of -13,044 contracts in the data reported through Tuesday. This was a weekly reduction of -4,016 contracts from the previous week which had a total of -9,028 net contracts.

This week’s current strength score (the trader positioning range over the past three years, measured from 0 to 100) shows the speculators are currently Bearish-Extreme with a score of 18.8 percent. The commercials are Bullish with a score of 72.2 percent and the small traders (not shown in chart) are Bullish-Extreme with a score of 83.1 percent.

Dow Jones Mini Futures StatisticsSPECULATORSCOMMERCIALSSMALL TRADERS
– Percent of Open Interest Longs:31.848.217.9
– Percent of Open Interest Shorts:45.041.911.0
– Net Position:-13,0446,2636,781
– Gross Longs:31,40947,67217,671
– Gross Shorts:44,45341,40910,890
– Long to Short Ratio:0.7 to 11.2 to 11.6 to 1
NET POSITION TREND:
– COT Index Score (3 Year Range Pct):18.872.283.1
– COT Index Reading (3 Year Range):Bearish-ExtremeBullishBullish-Extreme
NET POSITION MOVEMENT INDEX:
– 6-Week Change in Strength Index:-2.04.7-14.6


Nasdaq Mini Futures Futures:


The Nasdaq Mini Futures large speculator standing this week recorded a net position of -13,295 contracts in the data reported through Tuesday. This was a weekly decline of -7,193 contracts from the previous week which had a total of -6,102 net contracts.

This week’s current strength score (the trader positioning range over the past three years, measured from 0 to 100) shows the speculators are currently Bullish with a score of 67.6 percent. The commercials are Bearish with a score of 40.2 percent and the small traders (not shown in chart) are Bearish with a score of 23.7 percent.

Nasdaq Mini Futures StatisticsSPECULATORSCOMMERCIALSSMALL TRADERS
– Percent of Open Interest Longs:22.759.616.0
– Percent of Open Interest Shorts:28.450.019.9
– Net Position:-13,29522,318-9,023
– Gross Longs:52,932139,03037,390
– Gross Shorts:66,227116,71246,413
– Long to Short Ratio:0.8 to 11.2 to 10.8 to 1
NET POSITION TREND:
– COT Index Score (3 Year Range Pct):67.640.223.7
– COT Index Reading (3 Year Range):BullishBearishBearish
NET POSITION MOVEMENT INDEX:
– 6-Week Change in Strength Index:-4.07.4-10.7


Russell 2000 Mini Futures Futures:


The Russell 2000 Mini Futures large speculator standing this week recorded a net position of -33,860 contracts in the data reported through Tuesday. This was a weekly rise of 2,931 contracts from the previous week which had a total of -36,791 net contracts.

This week’s current strength score (the trader positioning range over the past three years, measured from 0 to 100) shows the speculators are currently Bearish with a score of 34.7 percent. The commercials are Bullish with a score of 62.5 percent and the small traders (not shown in chart) are Bullish with a score of 58.2 percent.

Russell 2000 Mini Futures StatisticsSPECULATORSCOMMERCIALSSMALL TRADERS
– Percent of Open Interest Longs:13.779.36.2
– Percent of Open Interest Shorts:21.273.74.2
– Net Position:-33,86024,9608,900
– Gross Longs:61,885358,08227,895
– Gross Shorts:95,745333,12218,995
– Long to Short Ratio:0.6 to 11.1 to 11.5 to 1
NET POSITION TREND:
– COT Index Score (3 Year Range Pct):34.762.558.2
– COT Index Reading (3 Year Range):BearishBullishBullish
NET POSITION MOVEMENT INDEX:
– 6-Week Change in Strength Index:-7.88.8-5.5


Nikkei Stock Average (USD) Futures Futures:


The Nikkei Stock Average (USD) Futures large speculator standing this week recorded a net position of -4,046 contracts in the data reported through Tuesday. This was a weekly decrease of -1,136 contracts from the previous week which had a total of -2,910 net contracts.

This week’s current strength score (the trader positioning range over the past three years, measured from 0 to 100) shows the speculators are currently Bearish with a score of 40.2 percent. The commercials are Bullish with a score of 64.8 percent and the small traders (not shown in chart) are Bearish with a score of 26.4 percent.

Nikkei Stock Average Futures StatisticsSPECULATORSCOMMERCIALSSMALL TRADERS
– Percent of Open Interest Longs:16.957.825.3
– Percent of Open Interest Shorts:42.536.421.0
– Net Position:-4,0463,375671
– Gross Longs:2,6599,1053,980
– Gross Shorts:6,7055,7303,309
– Long to Short Ratio:0.4 to 11.6 to 11.2 to 1
NET POSITION TREND:
– COT Index Score (3 Year Range Pct):40.264.826.4
– COT Index Reading (3 Year Range):BearishBullishBearish
NET POSITION MOVEMENT INDEX:
– 6-Week Change in Strength Index:4.6-2.8-6.4


MSCI EAFE Mini Futures Futures:


The MSCI EAFE Mini Futures large speculator standing this week recorded a net position of 24,354 contracts in the data reported through Tuesday. This was a weekly reduction of -465 contracts from the previous week which had a total of 24,819 net contracts.

This week’s current strength score (the trader positioning range over the past three years, measured from 0 to 100) shows the speculators are currently Bearish with a score of 45.8 percent. The commercials are Bullish with a score of 50.4 percent and the small traders (not shown in chart) are Bullish with a score of 52.8 percent.

MSCI EAFE Mini Futures StatisticsSPECULATORSCOMMERCIALSSMALL TRADERS
– Percent of Open Interest Longs:8.888.52.5
– Percent of Open Interest Shorts:2.895.51.5
– Net Position:24,354-28,4234,069
– Gross Longs:35,624359,23610,242
– Gross Shorts:11,270387,6596,173
– Long to Short Ratio:3.2 to 10.9 to 11.7 to 1
NET POSITION TREND:
– COT Index Score (3 Year Range Pct):45.850.452.8
– COT Index Reading (3 Year Range):BearishBullishBullish
NET POSITION MOVEMENT INDEX:
– 6-Week Change in Strength Index:-2.84.9-11.6


MSCI Emerging Mkts Mini Futures Futures:


The MSCI Emerging Mkts Mini Futures large speculator standing this week recorded a net position of 38,211 contracts in the data reported through Tuesday. This was a weekly lowering of -2,219 contracts from the previous week which had a total of 40,430 net contracts.

This week’s current strength score (the trader positioning range over the past three years, measured from 0 to 100) shows the speculators are currently Bearish-Extreme with a score of 0.0 percent. The commercials are Bullish-Extreme with a score of 97.2 percent and the small traders (not shown in chart) are Bearish with a score of 40.4 percent.

MSCI Emerging Mkts Mini Futures StatisticsSPECULATORSCOMMERCIALSSMALL TRADERS
– Percent of Open Interest Longs:14.382.22.4
– Percent of Open Interest Shorts:11.086.51.3
– Net Position:38,211-49,88611,675
– Gross Longs:165,150950,68527,250
– Gross Shorts:126,9391,000,57115,575
– Long to Short Ratio:1.3 to 11.0 to 11.7 to 1
NET POSITION TREND:
– COT Index Score (3 Year Range Pct):0.097.240.4
– COT Index Reading (3 Year Range):Bearish-ExtremeBullish-ExtremeBearish
NET POSITION MOVEMENT INDEX:
– 6-Week Change in Strength Index:-11.06.87.3


Article By CountingPips.comReceive our weekly COT Reports by Email

*COT Report: The COT data, released weekly to the public each Friday, is updated through the most recent Tuesday (data is 3 days old) and shows a quick view of how large speculators or non-commercials (for-profit traders) were positioned in the futures markets.

The CFTC categorizes trader positions according to commercial hedgers (traders who use futures contracts for hedging as part of the business), non-commercials (large traders who speculate to realize trading profits) and nonreportable traders (usually small traders/speculators).

Find CFTC criteria here: (http://www.cftc.gov/MarketReports/CommitmentsofTraders/ExplanatoryNotes/index.htm).
COT Energy Futures Charts: Crude Oil, Natural Gas, RBOB Gasoline, Bloomberg Index

By CountingPips.com COT Home | Data Tables | Data Downloads | Newsletter

Here are the latest charts and statistics for the Commitment of Traders (COT) data published by the Commodities Futures Trading Commission (CFTC).

The latest COT data is updated through Tuesday May 25 2021 and shows a quick view of how large traders (for-profit speculators and commercial entities) were positioned in the futures markets.


WTI Crude Oil Futures :


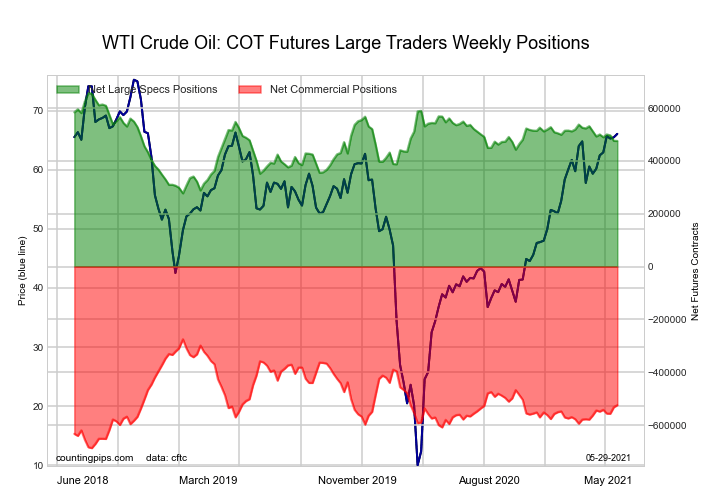
The WTI Crude Oil Futures large speculator standing this week totaled a net position of 475,490 contracts in the data reported through Tuesday. This was a weekly lowering of -457 contracts from the previous week which had a total of 475,947 net contracts.

This week’s current strength score (the trader positioning range over the past three years, measured from 0 to 100) shows the speculators are currently Bullish with a score of 52.2 percent. The commercials are Bearish with a score of 39.5 percent and the small traders (not shown in chart) are Bullish-Extreme with a score of 84.1 percent.

WTI Crude Oil Futures StatisticsSPECULATORSCOMMERCIALSSMALL TRADERS
– Percent of Open Interest Longs:25.834.94.2
– Percent of Open Interest Shorts:6.256.62.1
– Net Position:475,490-524,54049,050
– Gross Longs:625,568847,843100,701
– Gross Shorts:150,0781,372,38351,651
– Long to Short Ratio:4.2 to 10.6 to 11.9 to 1
NET POSITION TREND:
– COT Index Score (3 Year Range Pct):52.239.584.1
– COT Index Reading (3 Year Range):BullishBearishBullish-Extreme
NET POSITION MOVEMENT INDEX:
– 6-Week Change in Strength Index:-4.54.9-4.2


Brent Crude Oil Futures :


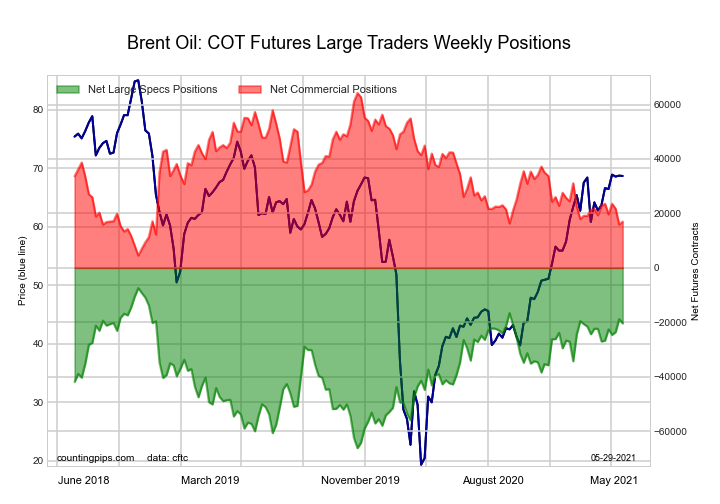
The Brent Crude Oil Futures large speculator standing this week totaled a net position of -20,382 contracts in the data reported through Tuesday. This was a weekly decline of -1,562 contracts from the previous week which had a total of -18,820 net contracts.

This week’s current strength score (the trader positioning range over the past three years, measured from 0 to 100) shows the speculators are currently Bullish with a score of 77.9 percent. The commercials are Bearish with a score of 20.9 percent and the small traders (not shown in chart) are Bullish with a score of 61.0 percent.

Brent Crude Oil Futures StatisticsSPECULATORSCOMMERCIALSSMALL TRADERS
– Percent of Open Interest Longs:21.046.84.9
– Percent of Open Interest Shorts:31.338.23.1
– Net Position:-20,38216,9793,403
– Gross Longs:41,47392,3179,611
– Gross Shorts:61,85575,3386,208
– Long to Short Ratio:0.7 to 11.2 to 11.5 to 1
NET POSITION TREND:
– COT Index Score (3 Year Range Pct):77.920.961.0
– COT Index Reading (3 Year Range):BullishBearishBullish
NET POSITION MOVEMENT INDEX:
– 6-Week Change in Strength Index:11.3-9.6-7.5


Natural Gas Futures :


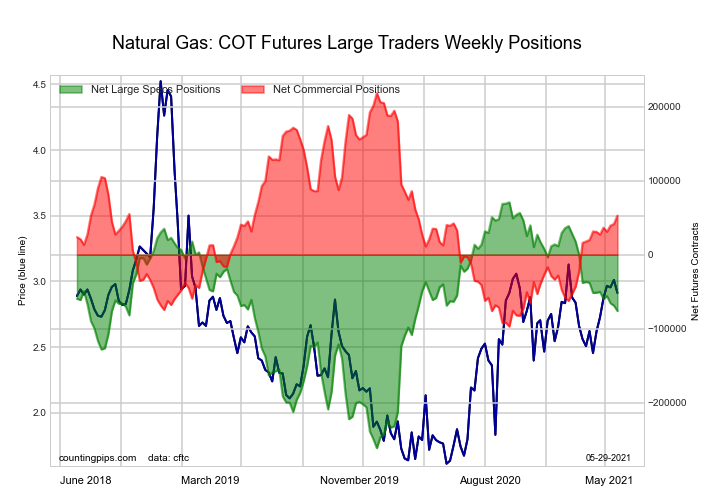
The Natural Gas Futures large speculator standing this week totaled a net position of -76,028 contracts in the data reported through Tuesday. This was a weekly decrease of -7,276 contracts from the previous week which had a total of -68,752 net contracts.

This week’s current strength score (the trader positioning range over the past three years, measured from 0 to 100) shows the speculators are currently Bullish with a score of 55.8 percent. The commercials are Bearish with a score of 47.5 percent and the small traders (not shown in chart) are Bearish with a score of 21.3 percent.

Natural Gas Futures StatisticsSPECULATORSCOMMERCIALSSMALL TRADERS
– Percent of Open Interest Longs:24.241.34.7
– Percent of Open Interest Shorts:30.636.92.8
– Net Position:-76,02852,93423,094
– Gross Longs:286,247489,20155,783
– Gross Shorts:362,275436,26732,689
– Long to Short Ratio:0.8 to 11.1 to 11.7 to 1
NET POSITION TREND:
– COT Index Score (3 Year Range Pct):55.847.521.3
– COT Index Reading (3 Year Range):BullishBearishBearish
NET POSITION MOVEMENT INDEX:
– 6-Week Change in Strength Index:-7.46.98.9


Gasoline Blendstock Futures :


The Gasoline Blendstock Futures large speculator standing this week totaled a net position of 53,368 contracts in the data reported through Tuesday. This was a weekly decline of -4,025 contracts from the previous week which had a total of 57,393 net contracts.

This week’s current strength score (the trader positioning range over the past three years, measured from 0 to 100) shows the speculators are currently Bearish-Extreme with a score of 14.1 percent. The commercials are Bullish with a score of 76.2 percent and the small traders (not shown in chart) are Bullish with a score of 66.1 percent.

Nasdaq Mini Futures StatisticsSPECULATORSCOMMERCIALSSMALL TRADERS
– Percent of Open Interest Longs:25.147.95.9
– Percent of Open Interest Shorts:11.364.13.6
– Net Position:53,368-62,5039,135
– Gross Longs:96,895184,97422,898
– Gross Shorts:43,527247,47713,763
– Long to Short Ratio:2.2 to 10.7 to 11.7 to 1
NET POSITION TREND:
– COT Index Score (3 Year Range Pct):14.176.266.1
– COT Index Reading (3 Year Range):Bearish-ExtremeBullishBullish
NET POSITION MOVEMENT INDEX:
– 6-Week Change in Strength Index:13.1-10.3-7.4


#2 Heating Oil NY-Harbor Futures :


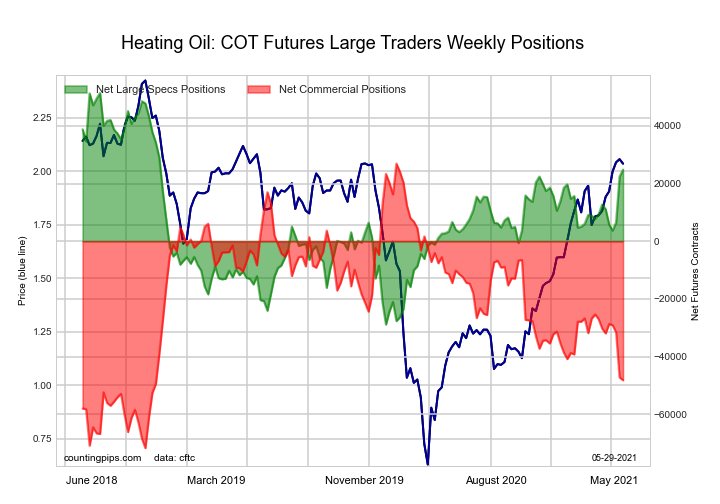
The #2 Heating Oil NY-Harbor Futures large speculator standing this week totaled a net position of 24,830 contracts in the data reported through Tuesday. This was a weekly advance of 2,404 contracts from the previous week which had a total of 22,426 net contracts.

This week’s current strength score (the trader positioning range over the past three years, measured from 0 to 100) shows the speculators are currently Bullish with a score of 66.9 percent. The commercials are Bearish with a score of 23.9 percent and the small traders (not shown in chart) are Bullish-Extreme with a score of 91.8 percent.

Heating Oil Futures StatisticsSPECULATORSCOMMERCIALSSMALL TRADERS
– Percent of Open Interest Longs:16.549.811.6
– Percent of Open Interest Shorts:10.761.06.2
– Net Position:24,830-48,13423,304
– Gross Longs:70,877213,72249,970
– Gross Shorts:46,047261,85626,666
– Long to Short Ratio:1.5 to 10.8 to 11.9 to 1
NET POSITION TREND:
– COT Index Score (3 Year Range Pct):66.923.991.8
– COT Index Reading (3 Year Range):BullishBearishBullish-Extreme
NET POSITION MOVEMENT INDEX:
– 6-Week Change in Strength Index:15.1-18.223.2


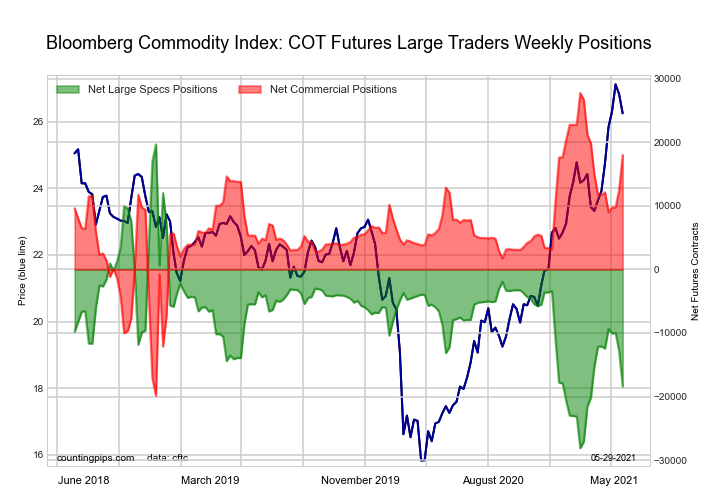
Bloomberg Commodity Index Futures :


The Bloomberg Commodity Index Futures large speculator standing this week totaled a net position of -18,376 contracts in the data reported through Tuesday. This was a weekly decline of -5,478 contracts from the previous week which had a total of -12,898 net contracts.

This week’s current strength score (the trader positioning range over the past three years, measured from 0 to 100) shows the speculators are currently Bearish with a score of 20.4 percent. The commercials are Bullish with a score of 79.6 percent and the small traders (not shown in chart) are Bullish with a score of 68.9 percent.

Bloomberg Index Futures StatisticsSPECULATORSCOMMERCIALSSMALL TRADERS
– Percent of Open Interest Longs:50.948.01.0
– Percent of Open Interest Shorts:90.98.80.2
– Net Position:-18,37618,013363
– Gross Longs:23,37522,053472
– Gross Shorts:41,7514,040109
– Long to Short Ratio:0.6 to 15.5 to 14.3 to 1
NET POSITION TREND:
– COT Index Score (3 Year Range Pct):20.479.668.9
– COT Index Reading (3 Year Range):BearishBullishBullish
NET POSITION MOVEMENT INDEX:
– 6-Week Change in Strength Index:-13.113.2-1.1


Article By CountingPips.comReceive our weekly COT Reports by Email

*COT Report: The COT data, released weekly to the public each Friday, is updated through the most recent Tuesday (data is 3 days old) and shows a quick view of how large speculators or non-commercials (for-profit traders) were positioned in the futures markets.

The CFTC categorizes trader positions according to commercial hedgers (traders who use futures contracts for hedging as part of the business), non-commercials (large traders who speculate to realize trading profits) and nonreportable traders (usually small traders/speculators).

Find CFTC criteria here: (http://www.cftc.gov/MarketReports/CommitmentsofTraders/ExplanatoryNotes/index.htm).
COT Bonds Futures Charts: 2-Year, 5-Year Treasury Notes, Eurodollar, 10-Year, Long Bond

By CountingPips.com COT Home | Data Tables | Data Downloads | Newsletter

Here are the latest charts and statistics for the Commitment of Traders (COT) data published by the Commodities Futures Trading Commission (CFTC).

The latest COT data is updated through Tuesday May 25 2021 and shows a quick view of how large traders (for-profit speculators and commercial entities) were positioned in the futures markets.


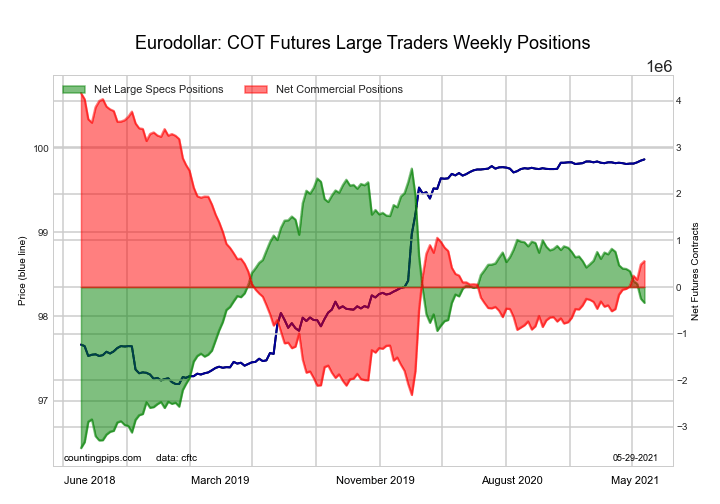
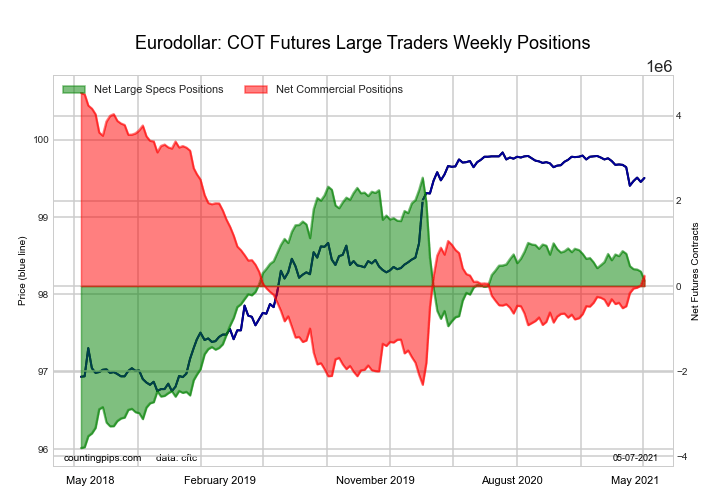
3-Month Eurodollars Futures:

The 3-Month Eurodollars large speculator standing this week resulted in a net position of -337,407 contracts in the data reported through Tuesday. This was a weekly lowering of -90,156 contracts from the previous week which had a total of -247,251 net contracts.

This week’s current strength score (the trader positioning range over the past three years, measured from 0 to 100) shows the speculators are currently Bullish with a score of 52.0 percent. The commercials are Bearish with a score of 44.3 percent and the small traders (not shown in chart) are Bullish with a score of 74.4 percent.

3-Month Eurodollars StatisticsSPECULATORSCOMMERCIALSSMALL TRADERS
– Percent of Open Interest Longs:20.950.85.2
– Percent of Open Interest Shorts:23.446.56.9
– Net Position:-337,407556,246-218,839
– Gross Longs:2,730,7996,650,052678,934
– Gross Shorts:3,068,2066,093,806897,773
– Long to Short Ratio:0.9 to 11.1 to 10.8 to 1
NET POSITION TREND:
– COT Index Score (3 Year Range Pct):52.044.374.4
– COT Index Reading (3 Year Range):BullishBearishBullish
NET POSITION MOVEMENT INDEX:
– 6-Week Change in Strength Index:-12.39.515.7


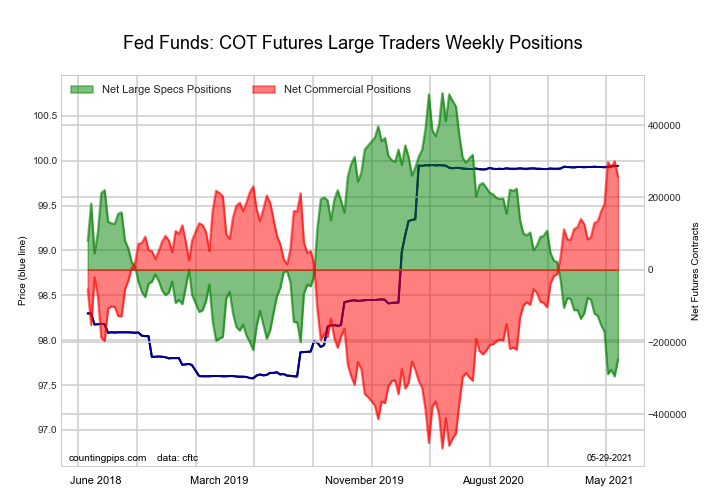
30-Day Federal Funds Futures:

The 30-Day Federal Funds large speculator standing this week resulted in a net position of -247,959 contracts in the data reported through Tuesday. This was a weekly increase of 46,785 contracts from the previous week which had a total of -294,744 net contracts.

This week’s current strength score (the trader positioning range over the past three years, measured from 0 to 100) shows the speculators are currently Bearish-Extreme with a score of 6.0 percent. The commercials are Bullish-Extreme with a score of 94.6 percent and the small traders (not shown in chart) are Bullish with a score of 53.2 percent.

30-Day Federal Funds StatisticsSPECULATORSCOMMERCIALSSMALL TRADERS
– Percent of Open Interest Longs:4.376.81.8
– Percent of Open Interest Shorts:26.453.82.7
– Net Position:-247,959257,765-9,806
– Gross Longs:48,298861,10320,062
– Gross Shorts:296,257603,33829,868
– Long to Short Ratio:0.2 to 11.4 to 10.7 to 1
NET POSITION TREND:
– COT Index Score (3 Year Range Pct):6.094.653.2
– COT Index Reading (3 Year Range):Bearish-ExtremeBullish-ExtremeBullish
NET POSITION MOVEMENT INDEX:
– 6-Week Change in Strength Index:-15.415.5-4.4


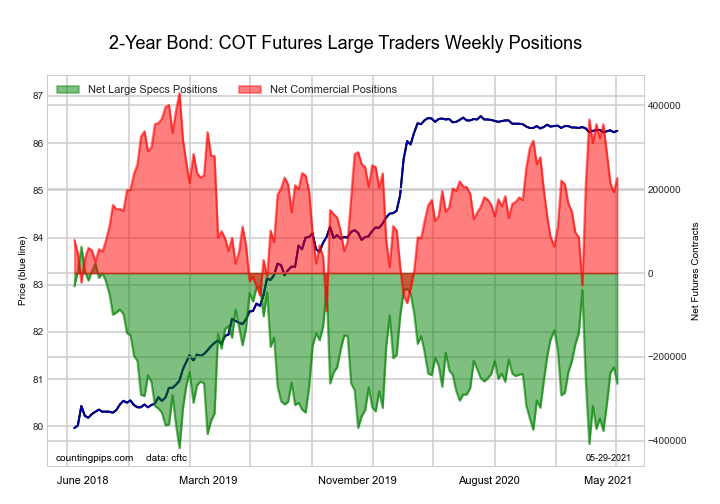
2-Year Treasury Note Futures:

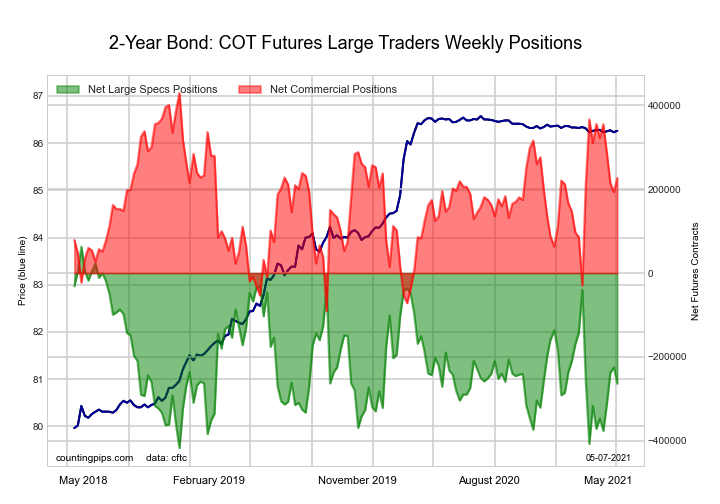
The 2-Year Treasury Note large speculator standing this week resulted in a net position of -263,456 contracts in the data reported through Tuesday. This was a weekly decrease of -38,724 contracts from the previous week which had a total of -224,732 net contracts.

This week’s current strength score (the trader positioning range over the past three years, measured from 0 to 100) shows the speculators are currently Bearish with a score of 34.9 percent. The commercials are Bullish with a score of 61.1 percent and the small traders (not shown in chart) are Bullish with a score of 54.1 percent.

2-Year Treasury Note StatisticsSPECULATORSCOMMERCIALSSMALL TRADERS
– Percent of Open Interest Longs:17.974.56.3
– Percent of Open Interest Shorts:29.064.94.8
– Net Position:-263,456226,93436,522
– Gross Longs:422,5201,760,922149,783
– Gross Shorts:685,9761,533,988113,261
– Long to Short Ratio:0.6 to 11.1 to 11.3 to 1
NET POSITION TREND:
– COT Index Score (3 Year Range Pct):34.961.154.1
– COT Index Reading (3 Year Range):BearishBullishBullish
NET POSITION MOVEMENT INDEX:
– 6-Week Change in Strength Index:24.5-24.710.9


5-Year Treasury Note Futures:

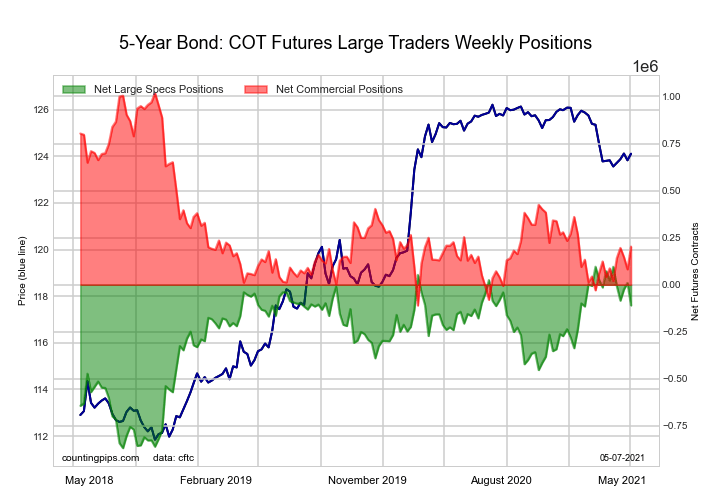
The 5-Year Treasury Note large speculator standing this week resulted in a net position of -109,619 contracts in the data reported through Tuesday. This was a weekly decline of -119,153 contracts from the previous week which had a total of 9,534 net contracts.

This week’s current strength score (the trader positioning range over the past three years, measured from 0 to 100) shows the speculators are currently Bullish with a score of 78.7 percent. The commercials are Bearish with a score of 27.7 percent and the small traders (not shown in chart) are Bearish with a score of 28.7 percent.

5-Year Treasury Note StatisticsSPECULATORSCOMMERCIALSSMALL TRADERS
– Percent of Open Interest Longs:10.178.48.5
– Percent of Open Interest Shorts:13.372.511.3
– Net Position:-109,619202,363-92,744
– Gross Longs:342,3682,659,008289,241
– Gross Shorts:451,9872,456,645381,985
– Long to Short Ratio:0.8 to 11.1 to 10.8 to 1
NET POSITION TREND:
– COT Index Score (3 Year Range Pct):78.727.728.7
– COT Index Reading (3 Year Range):BullishBearishBearish
NET POSITION MOVEMENT INDEX:
– 6-Week Change in Strength Index:-13.810.27.6


10-Year Treasury Note Futures:

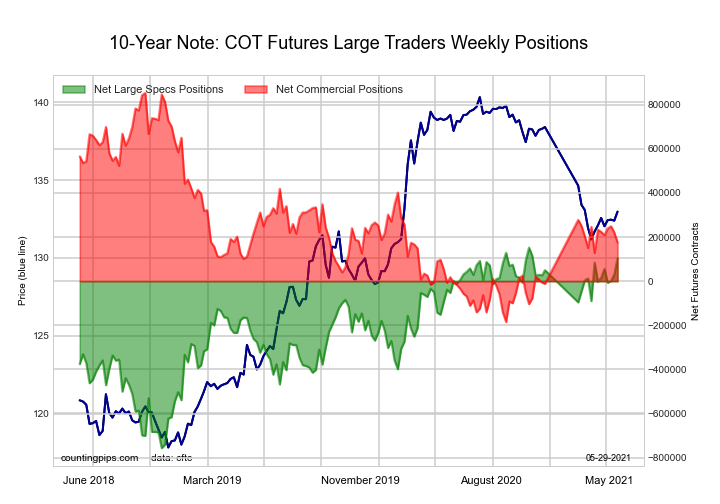
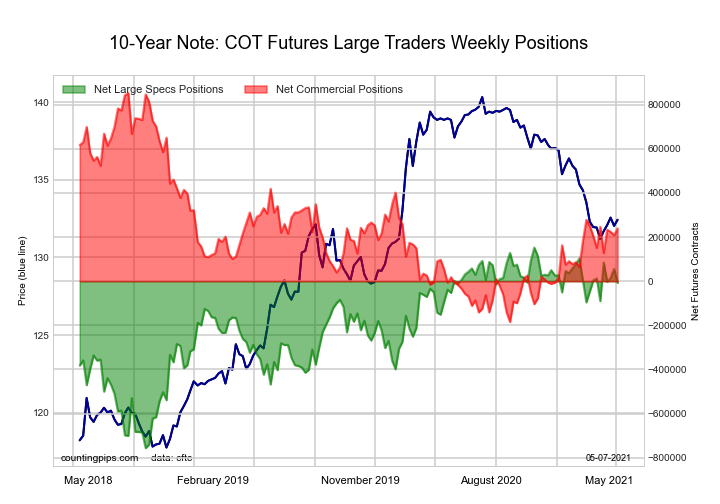
The 10-Year Treasury Note large speculator standing this week resulted in a net position of 104,398 contracts in the data reported through Tuesday. This was a weekly advance of 72,744 contracts from the previous week which had a total of 31,654 net contracts.

This week’s current strength score (the trader positioning range over the past three years, measured from 0 to 100) shows the speculators are currently Bullish-Extreme with a score of 94.7 percent. The commercials are Bearish with a score of 34.6 percent and the small traders (not shown in chart) are Bearish-Extreme with a score of 0.0 percent.

10-Year Treasury Note StatisticsSPECULATORSCOMMERCIALSSMALL TRADERS
– Percent of Open Interest Longs:18.568.58.6
– Percent of Open Interest Shorts:16.264.614.8
– Net Position:104,398174,988-279,386
– Gross Longs:834,4403,083,531387,727
– Gross Shorts:730,0422,908,543667,113
– Long to Short Ratio:1.1 to 11.1 to 10.6 to 1
NET POSITION TREND:
– COT Index Score (3 Year Range Pct):94.734.60.0
– COT Index Reading (3 Year Range):Bullish-ExtremeBearishBearish-Extreme
NET POSITION MOVEMENT INDEX:
– 6-Week Change in Strength Index:11.8-5.6-13.1


Ultra 10-Year Notes Futures:

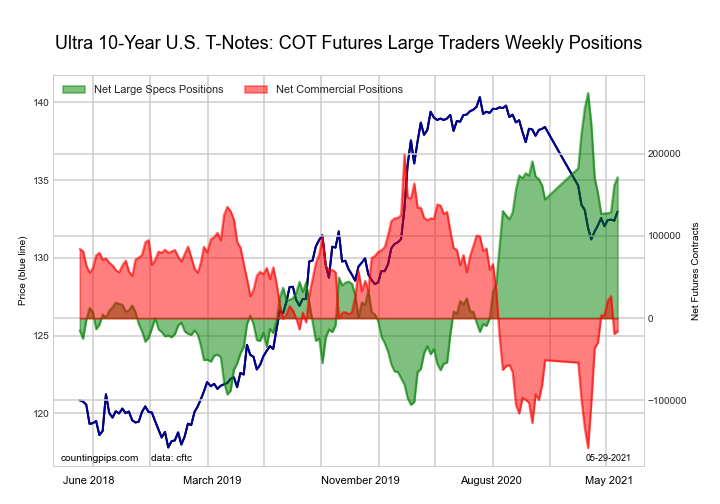
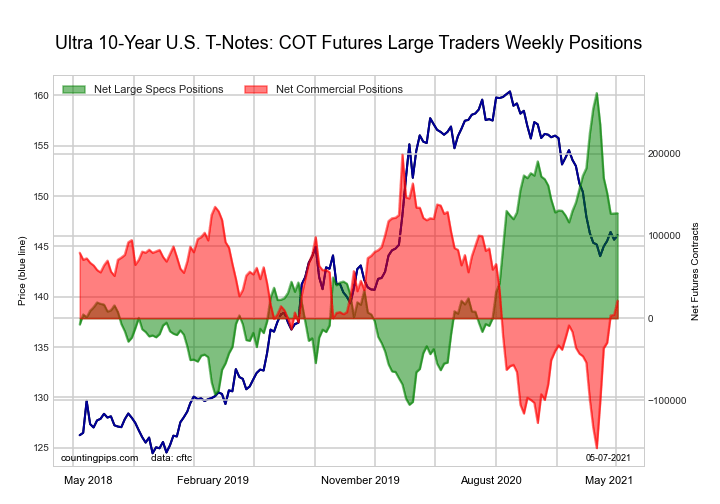
The Ultra 10-Year Notes large speculator standing this week resulted in a net position of 171,322 contracts in the data reported through Tuesday. This was a weekly gain of 9,816 contracts from the previous week which had a total of 161,506 net contracts.

This week’s current strength score (the trader positioning range over the past three years, measured from 0 to 100) shows the speculators are currently Bullish with a score of 73.0 percent. The commercials are Bearish with a score of 39.8 percent and the small traders (not shown in chart) are Bearish-Extreme with a score of 0.0 percent.

Ultra 10-Year Notes StatisticsSPECULATORSCOMMERCIALSSMALL TRADERS
– Percent of Open Interest Longs:19.569.68.8
– Percent of Open Interest Shorts:9.170.618.3
– Net Position:171,322-15,810-155,512
– Gross Longs:320,5281,143,178144,736
– Gross Shorts:149,2061,158,988300,248
– Long to Short Ratio:2.1 to 11.0 to 10.5 to 1
NET POSITION TREND:
– COT Index Score (3 Year Range Pct):73.039.80.0
– COT Index Reading (3 Year Range):BullishBearishBearish-Extreme
NET POSITION MOVEMENT INDEX:
– 6-Week Change in Strength Index:5.13.9-25.4


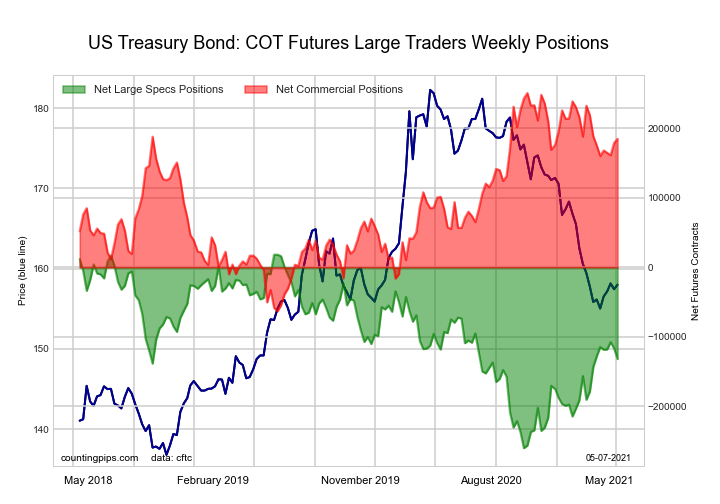
US Treasury Bonds Futures:

The US Treasury Bonds large speculator standing this week resulted in a net position of -119,353 contracts in the data reported through Tuesday. This was a weekly decrease of -36,373 contracts from the previous week which had a total of -82,980 net contracts.

This week’s current strength score (the trader positioning range over the past three years, measured from 0 to 100) shows the speculators are currently Bullish with a score of 50.5 percent. The commercials are Bullish with a score of 76.4 percent and the small traders (not shown in chart) are Bearish-Extreme with a score of 7.2 percent.

US Treasury Bonds StatisticsSPECULATORSCOMMERCIALSSMALL TRADERS
– Percent of Open Interest Longs:5.476.814.0
– Percent of Open Interest Shorts:14.763.018.5
– Net Position:-119,353176,497-57,144
– Gross Longs:68,604981,864178,650
– Gross Shorts:187,957805,367235,794
– Long to Short Ratio:0.4 to 11.2 to 10.8 to 1
NET POSITION TREND:
– COT Index Score (3 Year Range Pct):50.576.47.2
– COT Index Reading (3 Year Range):BullishBullishBearish-Extreme
NET POSITION MOVEMENT INDEX:
– 6-Week Change in Strength Index:-0.53.8-8.3


Ultra US Treasury Bonds Futures:

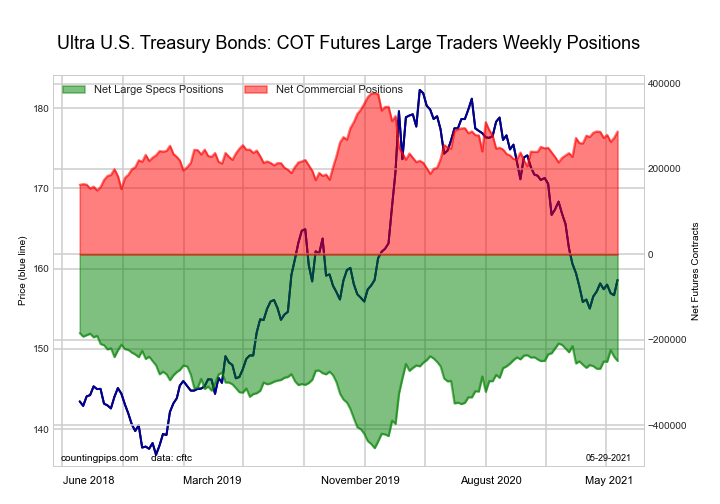
The Ultra US Treasury Bonds large speculator standing this week resulted in a net position of -249,634 contracts in the data reported through Tuesday. This was a weekly decrease of -9,842 contracts from the previous week which had a total of -239,792 net contracts.

This week’s current strength score (the trader positioning range over the past three years, measured from 0 to 100) shows the speculators are currently Bullish with a score of 75.8 percent. The commercials are Bullish with a score of 60.5 percent and the small traders (not shown in chart) are Bearish-Extreme with a score of 0.9 percent.

Ultra US Treasury Bonds StatisticsSPECULATORSCOMMERCIALSSMALL TRADERS
– Percent of Open Interest Longs:5.179.412.4
– Percent of Open Interest Shorts:25.356.115.5
– Net Position:-249,634287,734-38,100
– Gross Longs:63,181980,362153,113
– Gross Shorts:312,815692,628191,213
– Long to Short Ratio:0.2 to 11.4 to 10.8 to 1
NET POSITION TREND:
– COT Index Score (3 Year Range Pct):75.860.50.9
– COT Index Reading (3 Year Range):BullishBullishBearish-Extreme
NET POSITION MOVEMENT INDEX:
– 6-Week Change in Strength Index:6.8-0.1-12.9


Article By CountingPips.comReceive our weekly COT Reports by Email

*COT Report: The COT data, released weekly to the public each Friday, is updated through the most recent Tuesday (data is 3 days old) and shows a quick view of how large speculators or non-commercials (for-profit traders) were positioned in the futures markets.

The CFTC categorizes trader positions according to commercial hedgers (traders who use futures contracts for hedging as part of the business), non-commercials (large traders who speculate to realize trading profits) and nonreportable traders (usually small traders/speculators).

Find CFTC criteria here: (http://www.cftc.gov/MarketReports/CommitmentsofTraders/ExplanatoryNotes/index.htm).
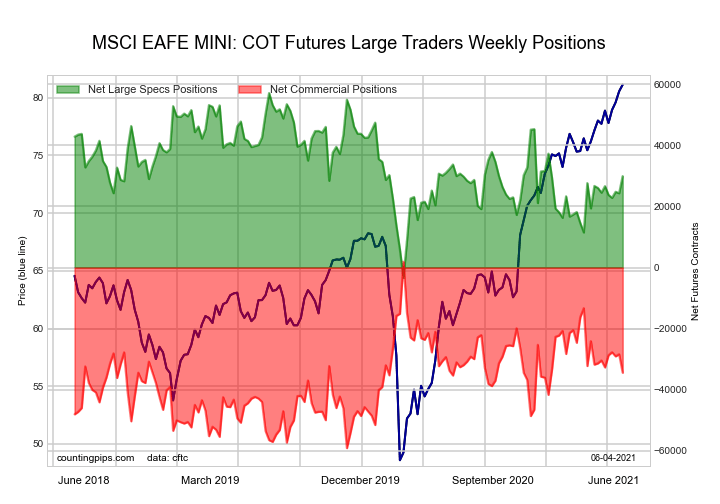
COT Soft Commodities Futures Charts: Hogs, Sugar, Corn, Soybeans, Wheat, Cattle

By CountingPips.com COT Home | Data Tables | Data Downloads | Newsletter

Here are the latest charts and statistics for the Commitment of Traders (COT) data published by the Commodities Futures Trading Commission (CFTC).

The latest COT data is updated through Tuesday May 25 2021 and shows a quick view of how large traders (for-profit speculators and commercial entities) were positioned in the futures markets.


CORN Futures:


The CORN large speculator standing this week recorded a net position of 428,426 contracts in the data reported through Tuesday. This was a weekly lowering of -31,052 contracts from the previous week which had a total of 459,478 net contracts.

This week’s current strength score (the trader positioning range over the past three years, measured from 0 to 100) shows the speculators are currently Bullish-Extreme with a score of 84.8 percent. The commercials are Bearish-Extreme with a score of 17.9 percent and the small traders (not shown in chart) are Bearish-Extreme with a score of 11.1 percent.

CORN Futures StatisticsSPECULATORSCOMMERCIALSSMALL TRADERS
– Percent of Open Interest Longs:30.149.28.1
– Percent of Open Interest Shorts:5.271.310.9
– Net Position:428,426-379,469-48,957
– Gross Longs:518,145846,602138,713
– Gross Shorts:89,7191,226,071187,670
– Long to Short Ratio:5.8 to 10.7 to 10.7 to 1
NET POSITION TREND:
– COT Index Score (3 Year Range Pct):84.817.911.1
– COT Index Reading (3 Year Range):Bullish-ExtremeBearish-ExtremeBearish-Extreme
NET POSITION MOVEMENT INDEX:
– 6-Week Change in Strength Index:-14.716.4-0.2


SUGAR Futures:


The SUGAR large speculator standing this week recorded a net position of 252,991 contracts in the data reported through Tuesday. This was a weekly decline of -14,843 contracts from the previous week which had a total of 267,834 net contracts.

This week’s current strength score (the trader positioning range over the past three years, measured from 0 to 100) shows the speculators are currently Bullish-Extreme with a score of 88.6 percent. The commercials are Bearish-Extreme with a score of 9.9 percent and the small traders (not shown in chart) are Bullish with a score of 74.7 percent.

SUGAR Futures StatisticsSPECULATORSCOMMERCIALSSMALL TRADERS
– Percent of Open Interest Longs:29.046.09.1
– Percent of Open Interest Shorts:4.276.13.8
– Net Position:252,991-307,07554,084
– Gross Longs:296,225470,08892,683
– Gross Shorts:43,234777,16338,599
– Long to Short Ratio:6.9 to 10.6 to 12.4 to 1
NET POSITION TREND:
– COT Index Score (3 Year Range Pct):88.69.974.7
– COT Index Reading (3 Year Range):Bullish-ExtremeBearish-ExtremeBullish
NET POSITION MOVEMENT INDEX:
– 6-Week Change in Strength Index:12.6-12.23.8


COFFEE Futures:


The COFFEE large speculator standing this week recorded a net position of 65,114 contracts in the data reported through Tuesday. This was a weekly lift of 1,641 contracts from the previous week which had a total of 63,473 net contracts.

This week’s current strength score (the trader positioning range over the past three years, measured from 0 to 100) shows the speculators are currently Bullish-Extreme with a score of 99.3 percent. The commercials are Bearish-Extreme with a score of 0.0 percent and the small traders (not shown in chart) are Bearish with a score of 28.5 percent.

COFFEE Futures StatisticsSPECULATORSCOMMERCIALSSMALL TRADERS
– Percent of Open Interest Longs:30.245.34.6
– Percent of Open Interest Shorts:7.769.72.6
– Net Position:65,114-70,9125,798
– Gross Longs:87,383131,12713,194
– Gross Shorts:22,269202,0397,396
– Long to Short Ratio:3.9 to 10.6 to 11.8 to 1
NET POSITION TREND:
– COT Index Score (3 Year Range Pct):99.30.028.5
– COT Index Reading (3 Year Range):Bullish-ExtremeBearish-ExtremeBearish
NET POSITION MOVEMENT INDEX:
– 6-Week Change in Strength Index:18.4-19.65.2


SOYBEANS Futures:


The SOYBEANS large speculator standing this week recorded a net position of 221,055 contracts in the data reported through Tuesday. This was a weekly decline of -7,286 contracts from the previous week which had a total of 228,341 net contracts.

This week’s current strength score (the trader positioning range over the past three years, measured from 0 to 100) shows the speculators are currently Bullish-Extreme with a score of 85.0 percent. The commercials are Bearish-Extreme with a score of 17.7 percent and the small traders (not shown in chart) are Bearish with a score of 48.5 percent.

SOYBEANS Futures StatisticsSPECULATORSCOMMERCIALSSMALL TRADERS
– Percent of Open Interest Longs:34.246.16.5
– Percent of Open Interest Shorts:6.871.58.6
– Net Position:221,055-204,446-16,609
– Gross Longs:275,409370,66152,519
– Gross Shorts:54,354575,10769,128
– Long to Short Ratio:5.1 to 10.6 to 10.8 to 1
NET POSITION TREND:
– COT Index Score (3 Year Range Pct):85.017.748.5
– COT Index Reading (3 Year Range):Bullish-ExtremeBearish-ExtremeBearish
NET POSITION MOVEMENT INDEX:
– 6-Week Change in Strength Index:-0.72.7-13.3


SOYBEAN OIL Futures:


The SOYBEAN OIL large speculator standing this week recorded a net position of 87,203 contracts in the data reported through Tuesday. This was a weekly advance of 4,237 contracts from the previous week which had a total of 82,966 net contracts.

This week’s current strength score (the trader positioning range over the past three years, measured from 0 to 100) shows the speculators are currently Bullish with a score of 74.4 percent. The commercials are Bearish with a score of 25.3 percent and the small traders (not shown in chart) are Bullish with a score of 71.2 percent.

SOYBEAN OIL Futures StatisticsSPECULATORSCOMMERCIALSSMALL TRADERS
– Percent of Open Interest Longs:24.447.48.3
– Percent of Open Interest Shorts:7.467.55.2
– Net Position:87,203-102,67315,470
– Gross Longs:124,858242,00142,190
– Gross Shorts:37,655344,67426,720
– Long to Short Ratio:3.3 to 10.7 to 11.6 to 1
NET POSITION TREND:
– COT Index Score (3 Year Range Pct):74.425.371.2
– COT Index Reading (3 Year Range):BullishBearishBullish
NET POSITION MOVEMENT INDEX:
– 6-Week Change in Strength Index:-3.74.2-5.6


SOYBEAN MEAL Futures:


The SOYBEAN MEAL large speculator standing this week recorded a net position of 60,294 contracts in the data reported through Tuesday. This was a weekly reduction of -26,510 contracts from the previous week which had a total of 86,804 net contracts.

This week’s current strength score (the trader positioning range over the past three years, measured from 0 to 100) shows the speculators are currently Bullish with a score of 59.5 percent. The commercials are Bearish with a score of 33.5 percent and the small traders (not shown in chart) are Bullish with a score of 76.5 percent.

SOYBEAN MEAL Futures StatisticsSPECULATORSCOMMERCIALSSMALL TRADERS
– Percent of Open Interest Longs:22.950.512.7
– Percent of Open Interest Shorts:7.972.06.1
– Net Position:60,294-86,70426,410
– Gross Longs:92,334203,52851,206
– Gross Shorts:32,040290,23224,796
– Long to Short Ratio:2.9 to 10.7 to 12.1 to 1
NET POSITION TREND:
– COT Index Score (3 Year Range Pct):59.533.576.5
– COT Index Reading (3 Year Range):BullishBearishBullish
NET POSITION MOVEMENT INDEX:
– 6-Week Change in Strength Index:-8.37.39.4


LIVE CATTLE Futures:


The LIVE CATTLE large speculator standing this week recorded a net position of 66,591 contracts in the data reported through Tuesday. This was a weekly fall of -364 contracts from the previous week which had a total of 66,955 net contracts.

This week’s current strength score (the trader positioning range over the past three years, measured from 0 to 100) shows the speculators are currently Bearish with a score of 35.3 percent. The commercials are Bullish with a score of 56.3 percent and the small traders (not shown in chart) are Bullish with a score of 74.2 percent.

LIVE CATTLE Futures StatisticsSPECULATORSCOMMERCIALSSMALL TRADERS
– Percent of Open Interest Longs:37.337.610.0
– Percent of Open Interest Shorts:16.257.111.6
– Net Position:66,591-61,294-5,297
– Gross Longs:117,538118,50631,340
– Gross Shorts:50,947179,80036,637
– Long to Short Ratio:2.3 to 10.7 to 10.9 to 1
NET POSITION TREND:
– COT Index Score (3 Year Range Pct):35.356.374.2
– COT Index Reading (3 Year Range):BearishBullishBullish
NET POSITION MOVEMENT INDEX:
– 6-Week Change in Strength Index:-15.615.311.6


LEAN HOGS Futures:


The LEAN HOGS large speculator standing this week recorded a net position of 79,975 contracts in the data reported through Tuesday. This was a weekly boost of 2,861 contracts from the previous week which had a total of 77,114 net contracts.

This week’s current strength score (the trader positioning range over the past three years, measured from 0 to 100) shows the speculators are currently Bullish-Extreme with a score of 95.4 percent. The commercials are Bearish-Extreme with a score of 5.0 percent and the small traders (not shown in chart) are Bearish with a score of 45.6 percent.

LEAN HOGS Futures StatisticsSPECULATORSCOMMERCIALSSMALL TRADERS
– Percent of Open Interest Longs:39.629.09.1
– Percent of Open Interest Shorts:12.653.811.4
– Net Position:79,975-73,196-6,779
– Gross Longs:117,15985,89126,967
– Gross Shorts:37,184159,08733,746
– Long to Short Ratio:3.2 to 10.5 to 10.8 to 1
NET POSITION TREND:
– COT Index Score (3 Year Range Pct):95.45.045.6
– COT Index Reading (3 Year Range):Bullish-ExtremeBearish-ExtremeBearish
NET POSITION MOVEMENT INDEX:
– 6-Week Change in Strength Index:-4.65.0-3.2


COTTON Futures:


The COTTON large speculator standing this week recorded a net position of 63,653 contracts in the data reported through Tuesday. This was a weekly reduction of -9,000 contracts from the previous week which had a total of 72,653 net contracts.

This week’s current strength score (the trader positioning range over the past three years, measured from 0 to 100) shows the speculators are currently Bullish with a score of 61.2 percent. The commercials are Bearish with a score of 39.5 percent and the small traders (not shown in chart) are Bearish with a score of 46.7 percent.

COTTON Futures StatisticsSPECULATORSCOMMERCIALSSMALL TRADERS
– Percent of Open Interest Longs:34.846.36.3
– Percent of Open Interest Shorts:6.277.53.7
– Net Position:63,653-69,4805,827
– Gross Longs:77,472103,02314,033
– Gross Shorts:13,819172,5038,206
– Long to Short Ratio:5.6 to 10.6 to 11.7 to 1
NET POSITION TREND:
– COT Index Score (3 Year Range Pct):61.239.546.7
– COT Index Reading (3 Year Range):BullishBearishBearish
NET POSITION MOVEMENT INDEX:
– 6-Week Change in Strength Index:-5.46.2-13.1


COCOA Futures:


The COCOA large speculator standing this week recorded a net position of 24,303 contracts in the data reported through Tuesday. This was a weekly decrease of -6,936 contracts from the previous week which had a total of 31,239 net contracts.

This week’s current strength score (the trader positioning range over the past three years, measured from 0 to 100) shows the speculators are currently Bearish with a score of 45.5 percent. The commercials are Bullish with a score of 53.7 percent and the small traders (not shown in chart) are Bullish with a score of 52.7 percent.

COCOA Futures StatisticsSPECULATORSCOMMERCIALSSMALL TRADERS
– Percent of Open Interest Longs:27.745.05.4
– Percent of Open Interest Shorts:15.958.83.5
– Net Position:24,303-28,1873,884
– Gross Longs:56,89192,42411,036
– Gross Shorts:32,588120,6117,152
– Long to Short Ratio:1.7 to 10.8 to 11.5 to 1
NET POSITION TREND:
– COT Index Score (3 Year Range Pct):45.553.752.7
– COT Index Reading (3 Year Range):BearishBullishBullish
NET POSITION MOVEMENT INDEX:
– 6-Week Change in Strength Index:-4.54.5-1.6


WHEAT Futures:


The WHEAT large speculator standing this week recorded a net position of 18,411 contracts in the data reported through Tuesday. This was a weekly decline of -7,337 contracts from the previous week which had a total of 25,748 net contracts.

This week’s current strength score (the trader positioning range over the past three years, measured from 0 to 100) shows the speculators are currently Bullish with a score of 51.9 percent. The commercials are Bullish with a score of 51.3 percent and the small traders (not shown in chart) are Bearish with a score of 44.0 percent.

WHEAT Futures StatisticsSPECULATORSCOMMERCIALSSMALL TRADERS
– Percent of Open Interest Longs:28.935.46.7
– Percent of Open Interest Shorts:24.337.09.6
– Net Position:18,411-6,359-12,052
– Gross Longs:117,162143,78827,050
– Gross Shorts:98,751150,14739,102
– Long to Short Ratio:1.2 to 11.0 to 10.7 to 1
NET POSITION TREND:
– COT Index Score (3 Year Range Pct):51.951.344.0
– COT Index Reading (3 Year Range):BullishBullishBearish
NET POSITION MOVEMENT INDEX:
– 6-Week Change in Strength Index:9.1-9.0-2.5


Article By CountingPips.comReceive our weekly COT Reports by Email

*COT Report: The COT data, released weekly to the public each Friday, is updated through the most recent Tuesday (data is 3 days old) and shows a quick view of how large speculators or non-commercials (for-profit traders) were positioned in the futures markets.

The CFTC categorizes trader positions according to commercial hedgers (traders who use futures contracts for hedging as part of the business), non-commercials (large traders who speculate to realize trading profits) and nonreportable traders (usually small traders/speculators).

Find CFTC criteria here: (http://www.cftc.gov/MarketReports/CommitmentsofTraders/ExplanatoryNotes/index.htm).
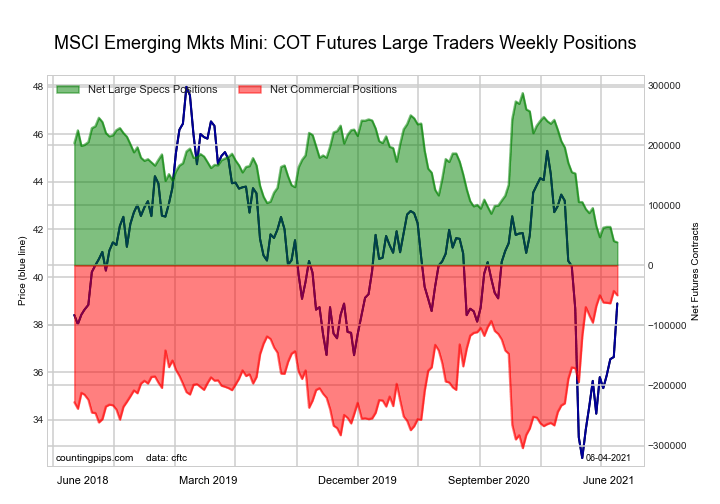
COT Currency Futures Charts: US Dollar Index, Euro, Yen, Swiss Franc, Mexican Peso, New Zealand Dollar

By CountingPips.com COT Home | Data Tables | Data Downloads | Newsletter

Here are the latest charts and statistics for the Commitment of Traders (COT) data published by the Commodities Futures Trading Commission (CFTC).

The latest COT data is updated through Tuesday May 04 2021 and shows a quick view of how large traders (for-profit speculators and commercial entities) were positioned in the futures markets. All currency positions are in direct relation to the US dollar where, for example, a bet for the euro is a bet that the euro will rise versus the dollar while a bet against the euro will be a bet that the euro will decline versus the dollar.


US Dollar Index Futures:


The US Dollar Index large speculator standing this week was a net position of 2,055 contracts in the data reported through Tuesday. This was a weekly decrease of -691 contracts from the previous week which had a total of 2,746 net contracts.

This week’s current strength score (the trader positioning range over the past three years, measured from 0 to 100) shows the speculators are currently Bearish with a score of 29.3 percent. The commercials are Bullish with a score of 65.7 percent and the small traders (not shown in chart) are Bullish with a score of 61.9 percent.

US DOLLAR INDEX StatisticsSPECULATORSCOMMERCIALSSMALL TRADERS
– Percent of Open Interest Longs:64.49.417.4
– Percent of Open Interest Shorts:58.425.07.8
– Net Position:2,055-5,3413,286
– Gross Longs:22,0163,2035,963
– Gross Shorts:19,9618,5442,677
– Long to Short Ratio:1.1 to 10.4 to 12.2 to 1
NET POSITION TREND:
– COT Index Score (3 Year Range Pct):29.365.761.9
– COT Index Reading (3 Year Range):BearishBullishBullish
NET POSITION MOVEMENT INDEX:
– 6-Week Change in Strength Index:-5.75.41.3


Euro Currency Futures:

euro forex zachary storella
The Euro Currency large speculator standing this week was a net position of 84,829 contracts in the data reported through Tuesday. This was a weekly boost of 3,862 contracts from the previous week which had a total of 80,967 net contracts.

This week’s current strength score (the trader positioning range over the past three years, measured from 0 to 100) shows the speculators are currently Bullish with a score of 61.0 percent. The commercials are Bearish with a score of 35.6 percent and the small traders (not shown in chart) are Bullish-Extreme with a score of 91.1 percent.

EURO Currency StatisticsSPECULATORSCOMMERCIALSSMALL TRADERS
– Percent of Open Interest Longs:30.553.914.3
– Percent of Open Interest Shorts:18.074.95.8
– Net Position:84,829-142,15857,329
– Gross Longs:206,472364,94796,919
– Gross Shorts:121,643507,10539,590
– Long to Short Ratio:1.7 to 10.7 to 12.4 to 1
NET POSITION TREND:
– COT Index Score (3 Year Range Pct):61.035.691.1
– COT Index Reading (3 Year Range):BullishBearishBullish-Extreme
NET POSITION MOVEMENT INDEX:
– 6-Week Change in Strength Index:-2.6-1.222.1


British Pound Sterling Futures:

sterling futures zac storella python
The British Pound Sterling large speculator standing this week was a net position of 19,848 contracts in the data reported through Tuesday. This was a weekly lowering of -9,370 contracts from the previous week which had a total of 29,218 net contracts.

This week’s current strength score (the trader positioning range over the past three years, measured from 0 to 100) shows the speculators are currently Bullish-Extreme with a score of 88.3 percent. The commercials are Bearish-Extreme with a score of 6.1 percent and the small traders (not shown in chart) are Bullish-Extreme with a score of 96.0 percent.

BRITISH POUND StatisticsSPECULATORSCOMMERCIALSSMALL TRADERS
– Percent of Open Interest Longs:34.238.726.2
– Percent of Open Interest Shorts:21.263.514.3
– Net Position:19,848-37,99318,145
– Gross Longs:52,26259,05540,052
– Gross Shorts:32,41497,04821,907
– Long to Short Ratio:1.6 to 10.6 to 11.8 to 1
NET POSITION TREND:
– COT Index Score (3 Year Range Pct):88.36.196.0
– COT Index Reading (3 Year Range):Bullish-ExtremeBearish-ExtremeBullish-Extreme
NET POSITION MOVEMENT INDEX:
– 6-Week Change in Strength Index:-1.4-3.215.5


Japanese Yen Futures:

japanese yen futures zach storella
The Japanese Yen large speculator standing this week was a net position of -41,492 contracts in the data reported through Tuesday. This was a weekly rise of 7,017 contracts from the previous week which had a total of -48,509 net contracts.

This week’s current strength score (the trader positioning range over the past three years, measured from 0 to 100) shows the speculators are currently Bearish with a score of 44.5 percent. The commercials are Bullish with a score of 60.3 percent and the small traders (not shown in chart) are Bearish with a score of 31.7 percent.

JAPANESE YEN StatisticsSPECULATORSCOMMERCIALSSMALL TRADERS
– Percent of Open Interest Longs:20.464.913.3
– Percent of Open Interest Shorts:47.629.321.7
– Net Position:-41,49254,331-12,839
– Gross Longs:31,20899,09220,288
– Gross Shorts:72,70044,76133,127
– Long to Short Ratio:0.4 to 12.2 to 10.6 to 1
NET POSITION TREND:
– COT Index Score (3 Year Range Pct):44.560.331.7
– COT Index Reading (3 Year Range):BearishBullishBearish
NET POSITION MOVEMENT INDEX:
– 6-Week Change in Strength Index:7.3-8.812.5


Swiss Franc Futures:

swiss franc currency futures cot
The Swiss Franc large speculator standing this week was a net position of 56 contracts in the data reported through Tuesday. This was a weekly increase of 742 contracts from the previous week which had a total of -686 net contracts.

This week’s current strength score (the trader positioning range over the past three years, measured from 0 to 100) shows the speculators are currently Bullish with a score of 73.4 percent. The commercials are Bearish with a score of 37.1 percent and the small traders (not shown in chart) are Bearish with a score of 44.6 percent.

SWISS FRANC StatisticsSPECULATORSCOMMERCIALSSMALL TRADERS
– Percent of Open Interest Longs:26.046.227.2
– Percent of Open Interest Shorts:25.926.746.9
– Net Position:567,707-7,763
– Gross Longs:10,27618,26010,768
– Gross Shorts:10,22010,55318,531
– Long to Short Ratio:1.0 to 11.7 to 10.6 to 1
NET POSITION TREND:
– COT Index Score (3 Year Range Pct):73.437.144.6
– COT Index Reading (3 Year Range):BullishBearishBearish
NET POSITION MOVEMENT INDEX:
– 6-Week Change in Strength Index:-4.4-1.411.3


Canadian Dollar Futures:


The Canadian Dollar large speculator standing this week was a net position of 25,947 contracts in the data reported through Tuesday. This was a weekly boost of 10,225 contracts from the previous week which had a total of 15,722 net contracts.

This week’s current strength score (the trader positioning range over the past three years, measured from 0 to 100) shows the speculators are currently Bullish with a score of 76.6 percent. The commercials are Bearish-Extreme with a score of 8.2 percent and the small traders (not shown in chart) are Bullish-Extreme with a score of 99.2 percent.

CANADIAN DOLLAR StatisticsSPECULATORSCOMMERCIALSSMALL TRADERS
– Percent of Open Interest Longs:37.735.226.6
– Percent of Open Interest Shorts:24.666.08.9
– Net Position:25,947-60,70534,758
– Gross Longs:74,28069,27952,291
– Gross Shorts:48,333129,98417,533
– Long to Short Ratio:1.5 to 10.5 to 13.0 to 1
NET POSITION TREND:
– COT Index Score (3 Year Range Pct):76.68.299.2
– COT Index Reading (3 Year Range):BullishBearish-ExtremeBullish-Extreme
NET POSITION MOVEMENT INDEX:
– 6-Week Change in Strength Index:17.4-19.412.4


Australian Dollar Futures:


The Australian Dollar large speculator standing this week was a net position of 1,476 contracts in the data reported through Tuesday. This was a weekly increase of 2,886 contracts from the previous week which had a total of -1,410 net contracts.

This week’s current strength score (the trader positioning range over the past three years, measured from 0 to 100) shows the speculators are currently Bullish-Extreme with a score of 83.4 percent. The commercials are Bearish-Extreme with a score of 8.5 percent and the small traders (not shown in chart) are Bullish-Extreme with a score of 87.2 percent.

AUSTRALIAN DOLLAR StatisticsSPECULATORSCOMMERCIALSSMALL TRADERS
– Percent of Open Interest Longs:42.434.122.5
– Percent of Open Interest Shorts:41.345.112.6
– Net Position:1,476-15,17913,703
– Gross Longs:58,38546,96931,003
– Gross Shorts:56,90962,14817,300
– Long to Short Ratio:1.0 to 10.8 to 11.8 to 1
NET POSITION TREND:
– COT Index Score (3 Year Range Pct):83.48.587.2
– COT Index Reading (3 Year Range):Bullish-ExtremeBearish-ExtremeBullish-Extreme
NET POSITION MOVEMENT INDEX:
– 6-Week Change in Strength Index:-5.03.40.9


New Zealand Dollar Futures:


The New Zealand Dollar large speculator standing this week was a net position of 8,588 contracts in the data reported through Tuesday. This was a weekly gain of 1,609 contracts from the previous week which had a total of 6,979 net contracts.

This week’s current strength score (the trader positioning range over the past three years, measured from 0 to 100) shows the speculators are currently Bullish-Extreme with a score of 85.7 percent. The commercials are Bearish-Extreme with a score of 14.1 percent and the small traders (not shown in chart) are Bullish with a score of 75.3 percent.

NEW ZEALAND DOLLAR StatisticsSPECULATORSCOMMERCIALSSMALL TRADERS
– Percent of Open Interest Longs:59.327.811.1
– Percent of Open Interest Shorts:40.051.66.7
– Net Position:8,588-10,5651,977
– Gross Longs:26,37112,3634,952
– Gross Shorts:17,78322,9282,975
– Long to Short Ratio:1.5 to 10.5 to 11.7 to 1
NET POSITION TREND:
– COT Index Score (3 Year Range Pct):85.714.175.3
– COT Index Reading (3 Year Range):Bullish-ExtremeBearish-ExtremeBullish
NET POSITION MOVEMENT INDEX:
– 6-Week Change in Strength Index:6.5-5.0-6.5


Mexican Peso Futures:


The Mexican Peso large speculator standing this week was a net position of -4,446 contracts in the data reported through Tuesday. This was a weekly fall of -5,406 contracts from the previous week which had a total of 960 net contracts.

This week’s current strength score (the trader positioning range over the past three years, measured from 0 to 100) shows the speculators are currently Bearish-Extreme with a score of 12.5 percent. The commercials are Bullish-Extreme with a score of 86.2 percent and the small traders (not shown in chart) are Bullish with a score of 61.7 percent.

MEXICAN PESO StatisticsSPECULATORSCOMMERCIALSSMALL TRADERS
– Percent of Open Interest Longs:45.248.85.0
– Percent of Open Interest Shorts:48.248.82.0
– Net Position:-4,446314,415
– Gross Longs:65,94871,2277,271
– Gross Shorts:70,39471,1962,856
– Long to Short Ratio:0.9 to 11.0 to 12.5 to 1
NET POSITION TREND:
– COT Index Score (3 Year Range Pct):12.586.261.7
– COT Index Reading (3 Year Range):Bearish-ExtremeBullish-ExtremeBullish
NET POSITION MOVEMENT INDEX:
– 6-Week Change in Strength Index:8.2-9.18.1


Brazilian Real Futures:

real futures cot zachary storella
The Brazilian Real large speculator standing this week was a net position of -9,898 contracts in the data reported through Tuesday. This was a weekly increase of 16,388 contracts from the previous week which had a total of -26,286 net contracts.

This week’s current strength score (the trader positioning range over the past three years, measured from 0 to 100) shows the speculators are currently Bullish with a score of 68.3 percent. The commercials are Bearish with a score of 31.9 percent and the small traders (not shown in chart) are Bullish-Extreme with a score of 86.9 percent.

BRAZIL REAL StatisticsSPECULATORSCOMMERCIALSSMALL TRADERS
– Percent of Open Interest Longs:38.551.49.4
– Percent of Open Interest Shorts:66.526.85.9
– Net Position:-9,8988,6801,218
– Gross Longs:13,62318,1593,316
– Gross Shorts:23,5219,4792,098
– Long to Short Ratio:0.6 to 11.9 to 11.6 to 1
NET POSITION TREND:
– COT Index Score (3 Year Range Pct):68.331.986.9
– COT Index Reading (3 Year Range):BullishBearishBullish-Extreme
NET POSITION MOVEMENT INDEX:
– 6-Week Change in Strength Index:25.4-27.012.7


Russian Ruble Futures:


The Russian Ruble large speculator standing this week was a net position of 5,509 contracts in the data reported through Tuesday. This was a weekly reduction of -869 contracts from the previous week which had a total of 6,378 net contracts.

This week’s current strength score (the trader positioning range over the past three years, measured from 0 to 100) shows the speculators are currently Bearish with a score of 26.4 percent. The commercials are Bullish with a score of 71.0 percent and the small traders (not shown in chart) are Bullish with a score of 70.2 percent.

RUSSIAN RUBLE StatisticsSPECULATORSCOMMERCIALSSMALL TRADERS
– Percent of Open Interest Longs:32.160.37.6
– Percent of Open Interest Shorts:13.981.34.8
– Net Position:5,509-6,334825
– Gross Longs:9,70218,2392,285
– Gross Shorts:4,19324,5731,460
– Long to Short Ratio:2.3 to 10.7 to 11.6 to 1
NET POSITION TREND:
– COT Index Score (3 Year Range Pct):26.471.070.2
– COT Index Reading (3 Year Range):BearishBullishBullish
NET POSITION MOVEMENT INDEX:
– 6-Week Change in Strength Index:-0.30.6-5.5


Bitcoin Futures:


The Bitcoin large speculator standing this week was a net position of -1,764 contracts in the data reported through Tuesday. This was a weekly boost of 145 contracts from the previous week which had a total of -1,909 net contracts.

This week’s current strength score (the trader positioning range over the past three years, measured from 0 to 100) shows the speculators are currently Bullish with a score of 54.3 percent. The commercials are Bullish-Extreme with a score of 82.9 percent and the small traders (not shown in chart) are Bearish with a score of 36.3 percent.

BITCOIN StatisticsSPECULATORSCOMMERCIALSSMALL TRADERS
– Percent of Open Interest Longs:59.85.727.5
– Percent of Open Interest Shorts:81.01.510.5
– Net Position:-1,7643461,418
– Gross Longs:4,9644702,286
– Gross Shorts:6,728124868
– Long to Short Ratio:0.7 to 13.8 to 12.6 to 1
NET POSITION TREND:
– COT Index Score (3 Year Range Pct):54.382.936.3
– COT Index Reading (3 Year Range):BullishBullish-ExtremeBearish
NET POSITION MOVEMENT INDEX:
– 6-Week Change in Strength Index:18.1-3.3-20.3


Article By CountingPips.comReceive our weekly COT Reports by Email

*COT Report: The COT data, released weekly to the public each Friday, is updated through the most recent Tuesday (data is 3 days old) and shows a quick view of how large speculators or non-commercials (for-profit traders) were positioned in the futures markets.

The CFTC categorizes trader positions according to commercial hedgers (traders who use futures contracts for hedging as part of the business), non-commercials (large traders who speculate to realize trading profits) and nonreportable traders (usually small traders/speculators).

Find CFTC criteria here: (http://www.cftc.gov/MarketReports/CommitmentsofTraders/ExplanatoryNotes/index.htm).

COT Bonds Futures Charts: Eurodollars, Ultra 10-Year Notes, 2-Year, 5-Year, 30-Day FedFunds

By CountingPips.com COT Home | Data Tables | Data Downloads | Newsletter

Here are the latest charts and statistics for the Commitment of Traders (COT) data published by the Commodities Futures Trading Commission (CFTC).
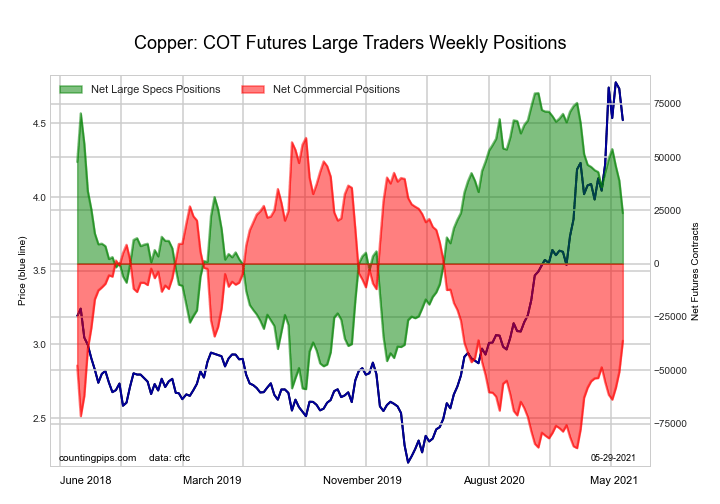
The latest COT data is updated through Tuesday May 04 2021 and shows a quick view of how large traders (for-profit speculators and commercial entities) were positioned in the futures markets.
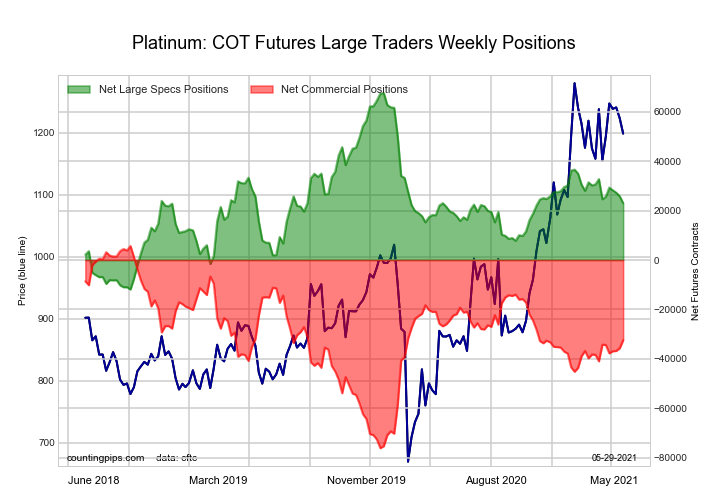

30-Day Federal Funds Futures:


The 30-Day Federal Funds large speculator standing this week resulted in a net position of -288,552 contracts in the data reported through Tuesday. This was a weekly fall of -117,508 contracts from the previous week which had a total of -171,044 net contracts.

This week’s current strength score (the trader positioning range over the past three years, measured from 0 to 100) shows the speculators are currently Bearish-Extreme with a score of 0.0 percent. The commercials are Bullish-Extreme with a score of 100.0 percent and the small traders (not shown in chart) are Bullish with a score of 53.9 percent.

30-Day Federal Funds StatisticsSPECULATORSCOMMERCIALSSMALL TRADERS
– Percent of Open Interest Longs:3.177.52.0
– Percent of Open Interest Shorts:32.247.32.9
– Net Position:-288,552298,013-9,461
– Gross Longs:30,283766,05319,394
– Gross Shorts:318,835468,04028,855
– Long to Short Ratio:0.1 to 11.6 to 10.7 to 1
NET POSITION TREND:
– COT Index Score (3 Year Range Pct):0.0100.053.9
– COT Index Reading (3 Year Range):Bearish-ExtremeBullish-ExtremeBullish
NET POSITION MOVEMENT INDEX:
– 6-Week Change in Strength Index:-27.127.0-5.0


2-Year Treasury Note Futures:


The 2-Year Treasury Note large speculator standing this week resulted in a net position of -263,456 contracts in the data reported through Tuesday. This was a weekly decline of -38,724 contracts from the previous week which had a total of -224,732 net contracts.

This week’s current strength score (the trader positioning range over the past three years, measured from 0 to 100) shows the speculators are currently Bearish with a score of 32.0 percent. The commercials are Bullish with a score of 61.1 percent and the small traders (not shown in chart) are Bullish with a score of 54.1 percent.

2-Year Treasury Note StatisticsSPECULATORSCOMMERCIALSSMALL TRADERS
– Percent of Open Interest Longs:17.974.56.3
– Percent of Open Interest Shorts:29.064.94.8
– Net Position:-263,456226,93436,522
– Gross Longs:422,5201,760,922149,783
– Gross Shorts:685,9761,533,988113,261
– Long to Short Ratio:0.6 to 11.1 to 11.3 to 1
NET POSITION TREND:
– COT Index Score (3 Year Range Pct):32.061.154.1
– COT Index Reading (3 Year Range):BearishBullishBullish
NET POSITION MOVEMENT INDEX:
– 6-Week Change in Strength Index:22.5-24.710.9


5-Year Treasury Note Futures:


The 5-Year Treasury Note large speculator standing this week resulted in a net position of -109,619 contracts in the data reported through Tuesday. This was a weekly reduction of -119,153 contracts from the previous week which had a total of 9,534 net contracts.

This week’s current strength score (the trader positioning range over the past three years, measured from 0 to 100) shows the speculators are currently Bullish with a score of 78.7 percent. The commercials are Bearish with a score of 27.7 percent and the small traders (not shown in chart) are Bearish with a score of 33.8 percent.

5-Year Treasury Note StatisticsSPECULATORSCOMMERCIALSSMALL TRADERS
– Percent of Open Interest Longs:10.178.48.5
– Percent of Open Interest Shorts:13.372.511.3
– Net Position:-109,619202,363-92,744
– Gross Longs:342,3682,659,008289,241
– Gross Shorts:451,9872,456,645381,985
– Long to Short Ratio:0.8 to 11.1 to 10.8 to 1
NET POSITION TREND:
– COT Index Score (3 Year Range Pct):78.727.733.8
– COT Index Reading (3 Year Range):BullishBearishBearish
NET POSITION MOVEMENT INDEX:
– 6-Week Change in Strength Index:-13.810.27.1


10-Year Treasury Note Futures:


The 10-Year Treasury Note large speculator standing this week resulted in a net position of -7,245 contracts in the data reported through Tuesday. This was a weekly lowering of -63,004 contracts from the previous week which had a total of 55,759 net contracts.

This week’s current strength score (the trader positioning range over the past three years, measured from 0 to 100) shows the speculators are currently Bullish-Extreme with a score of 82.4 percent. The commercials are Bearish with a score of 40.8 percent and the small traders (not shown in chart) are Bearish-Extreme with a score of 10.9 percent.

10-Year Treasury Note StatisticsSPECULATORSCOMMERCIALSSMALL TRADERS
– Percent of Open Interest Longs:19.270.27.9
– Percent of Open Interest Shorts:19.464.613.3
– Net Position:-7,245239,211-231,966
– Gross Longs:818,8492,990,625336,630
– Gross Shorts:826,0942,751,414568,596
– Long to Short Ratio:1.0 to 11.1 to 10.6 to 1
NET POSITION TREND:
– COT Index Score (3 Year Range Pct):82.440.810.9
– COT Index Reading (3 Year Range):Bullish-ExtremeBearishBearish-Extreme
NET POSITION MOVEMENT INDEX:
– 6-Week Change in Strength Index:-2.28.5-18.9


Ultra 10-Year Notes Futures:


The Ultra 10-Year Notes large speculator standing this week resulted in a net position of 127,622 contracts in the data reported through Tuesday. This was a weekly advance of 257 contracts from the previous week which had a total of 127,365 net contracts.

This week’s current strength score (the trader positioning range over the past three years, measured from 0 to 100) shows the speculators are currently Bullish with a score of 61.4 percent. The commercials are Bullish with a score of 50.2 percent and the small traders (not shown in chart) are Bearish-Extreme with a score of 0.0 percent.

Ultra 10-Year Notes StatisticsSPECULATORSCOMMERCIALSSMALL TRADERS
– Percent of Open Interest Longs:19.772.17.8
– Percent of Open Interest Shorts:11.470.717.5
– Net Position:127,62221,208-148,830
– Gross Longs:301,6151,103,948119,679
– Gross Shorts:173,9931,082,740268,509
– Long to Short Ratio:1.7 to 11.0 to 10.4 to 1
NET POSITION TREND:
– COT Index Score (3 Year Range Pct):61.450.20.0
– COT Index Reading (3 Year Range):BullishBullishBearish-Extreme
NET POSITION MOVEMENT INDEX:
– 6-Week Change in Strength Index:-38.650.2-26.8


US Treasury Bonds Futures:


The US Treasury Bonds large speculator standing this week resulted in a net position of -131,786 contracts in the data reported through Tuesday. This was a weekly fall of -15,169 contracts from the previous week which had a total of -116,617 net contracts.

This week’s current strength score (the trader positioning range over the past three years, measured from 0 to 100) shows the speculators are currently Bearish with a score of 46.1 percent. The commercials are Bullish with a score of 79.0 percent and the small traders (not shown in chart) are Bearish-Extreme with a score of 13.7 percent.

US Treasury Bonds StatisticsSPECULATORSCOMMERCIALSSMALL TRADERS
– Percent of Open Interest Longs:7.077.912.8
– Percent of Open Interest Shorts:18.162.417.3
– Net Position:-131,786184,813-53,027
– Gross Longs:83,644928,191152,503
– Gross Shorts:215,430743,378205,530
– Long to Short Ratio:0.4 to 11.2 to 10.7 to 1
NET POSITION TREND:
– COT Index Score (3 Year Range Pct):46.179.013.7
– COT Index Reading (3 Year Range):BearishBullishBearish-Extreme
NET POSITION MOVEMENT INDEX:
– 6-Week Change in Strength Index:-1.53.1-4.3


Ultra US Treasury Bonds Futures:


The Ultra US Treasury Bonds large speculator standing this week resulted in a net position of -251,517 contracts in the data reported through Tuesday. This was a weekly lowering of -689 contracts from the previous week which had a total of -250,828 net contracts.

This week’s current strength score (the trader positioning range over the past three years, measured from 0 to 100) shows the speculators are currently Bullish with a score of 75.1 percent. The commercials are Bullish with a score of 57.0 percent and the small traders (not shown in chart) are Bearish-Extreme with a score of 0.0 percent.

Ultra US Treasury Bonds StatisticsSPECULATORSCOMMERCIALSSMALL TRADERS
– Percent of Open Interest Longs:5.382.112.1
– Percent of Open Interest Shorts:27.557.414.5
– Net Position:-251,517279,812-28,295
– Gross Longs:60,471932,454136,958
– Gross Shorts:311,988652,642165,253
– Long to Short Ratio:0.2 to 11.4 to 10.8 to 1
NET POSITION TREND:
– COT Index Score (3 Year Range Pct):75.157.00.0
– COT Index Reading (3 Year Range):BullishBullishBearish-Extreme
NET POSITION MOVEMENT INDEX:
– 6-Week Change in Strength Index:5.30.8-12.4


3-Month Eurodollars Futures:


The 3-Month Eurodollars large speculator standing this week resulted in a net position of 125,153 contracts in the data reported through Tuesday. This was a weekly reduction of -217,068 contracts from the previous week which had a total of 342,221 net contracts.

This week’s current strength score (the trader positioning range over the past three years, measured from 0 to 100) shows the speculators are currently Bullish with a score of 61.9 percent. The commercials are Bearish with a score of 37.4 percent and the small traders (not shown in chart) are Bullish with a score of 55.1 percent.

3-Month Eurodollars StatisticsSPECULATORSCOMMERCIALSSMALL TRADERS
– Percent of Open Interest Longs:21.950.44.9
– Percent of Open Interest Shorts:20.848.47.9
– Net Position:125,153242,656-367,809
– Gross Longs:2,662,8316,139,211590,518
– Gross Shorts:2,537,6785,896,555958,327
– Long to Short Ratio:1.0 to 11.0 to 10.6 to 1
NET POSITION TREND:
– COT Index Score (3 Year Range Pct):61.937.455.1
– COT Index Reading (3 Year Range):BullishBearishBullish
NET POSITION MOVEMENT INDEX:
– 6-Week Change in Strength Index:-11.011.1-8.5


Article By CountingPips.comReceive our weekly COT Reports by Email

*COT Report: The COT data, released weekly to the public each Friday, is updated through the most recent Tuesday (data is 3 days old) and shows a quick view of how large speculators or non-commercials (for-profit traders) were positioned in the futures markets.

The CFTC categorizes trader positions according to commercial hedgers (traders who use futures contracts for hedging as part of the business), non-commercials (large traders who speculate to realize trading profits) and nonreportable traders (usually small traders/speculators).
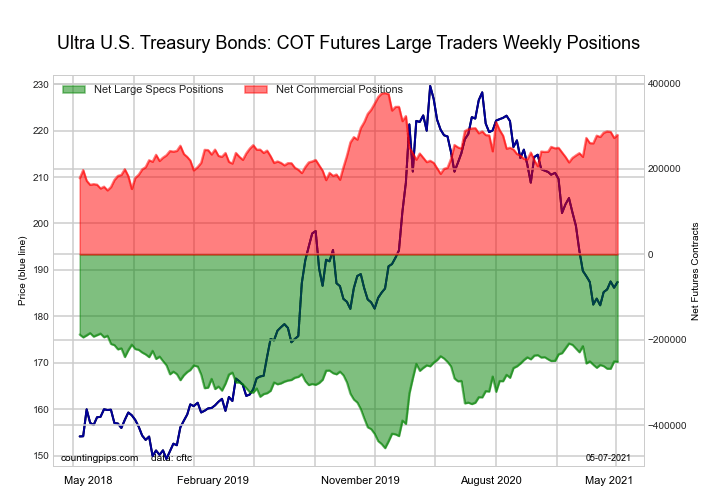
Find CFTC criteria here: (http://www.cftc.gov/MarketReports/CommitmentsofTraders/ExplanatoryNotes/index.htm).