By InvestMacro
Here are the latest charts and statistics for the Commitment of Traders (COT) data published by the Commodities Futures Trading Commission (CFTC).
The latest COT data is updated through Tuesday November 15th and shows a quick view of how large market participants (for-profit speculators and commercial traders) were positioned in the futures markets. All currency positions are in direct relation to the US dollar where, for example, a bet for the euro is a bet that the euro will rise versus the dollar while a bet against the euro will be a bet that the euro will decline versus the dollar.
Japanese Yen & Mexican Peso top Weekly Speculator Changes
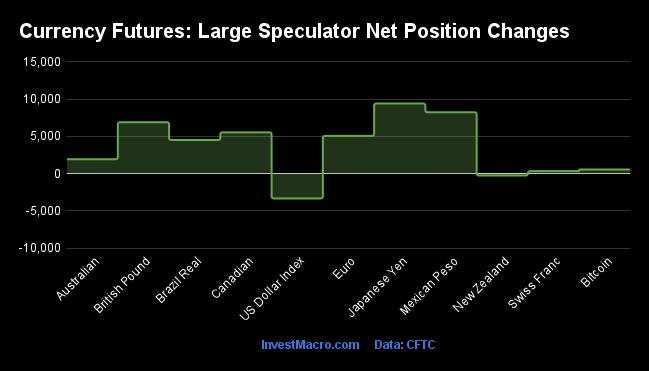
The COT currency market speculator bets were overall higher this week as nine out of the eleven currency markets we cover had higher positioning while the other two markets had lower speculator contracts.
Leading the gains for the currency markets was the Japanese yen (9,416 contracts) with the Mexican peso (8,237 contracts), the British pound sterling (6,901 contracts), the Canadian dollar (5,544 contracts), the Euro (5,067 contracts), the Brazilian real (4,517 contracts), the Australian dollar (1,934 contracts), Bitcoin (553 contracts) and the Swiss franc (327 contracts) also showing a positive week.
The currencies leading the declines in speculator bets this week were the US Dollar Index (-3,339 contracts) with the New Zealand dollar (-261 contracts) also registering lower bets on the week.
Highlighting the COT currency data this week is the US Dollar Index positioning. Large speculators dropped their bullish bets for the US Dollar Index this week by the most in the past eight weeks and have now decreased their weekly bets for four out of the past five weeks. The Dollar positions have slipped under +30,000 contracts for the second time in three weeks and this week’s level marks the lowest net standing in the past 59-weeks, dating back to September 28th of 2021. Overall, the Dollar positioning has been in a continuous bullish position for the past 72-weeks, dating back to July of 2021.
The price of the Dollar Index has been in retreat since reaching a 20-year high of over 114.00 at the end of the September. Since the start of November, the Dollar Index has declined sharply from a November 3rd high at over 113.00 to this week’s close on Friday November 18th at 106.83.
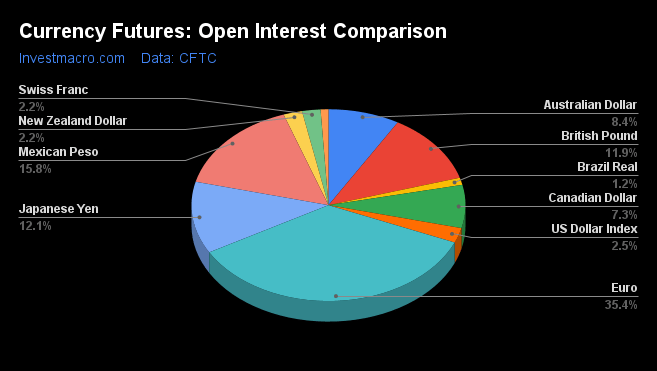
| Nov-15-2022 | OI | OI-Index | Spec-Net | Spec-Index | Com-Net | COM-Index | Smalls-Net | Smalls-Index |
|---|
| USD Index | 48,382 | 63 | 26,854 | 70 | -29,981 | 28 | 3,127 | 51 |
| EUR | 682,575 | 70 | 112,666 | 70 | -151,573 | 33 | 38,907 | 41 |
| GBP | 230,102 | 55 | -32,834 | 41 | 49,439 | 68 | -16,605 | 25 |
| JPY | 233,346 | 70 | -65,842 | 28 | 77,213 | 73 | -11,371 | 30 |
| CHF | 41,966 | 25 | -16,827 | 14 | 21,637 | 78 | -4,810 | 41 |
| CAD | 139,753 | 23 | -12,920 | 26 | 14,229 | 81 | -1,309 | 27 |
| AUD | 162,440 | 54 | -44,749 | 43 | 54,112 | 59 | -9,363 | 30 |
| NZD | 42,589 | 32 | -6,628 | 55 | 8,381 | 48 | -1,753 | 31 |
| MXN | 303,442 | 97 | 67,851 | 56 | -74,563 | 42 | 6,712 | 71 |
| RUB | 20,930 | 4 | 7,543 | 31 | -7,150 | 69 | -393 | 24 |
| BRL | 23,469 | 4 | 9,018 | 59 | -12,404 | 39 | 3,386 | 100 |
| Bitcoin | 17,901 | 100 | 571 | 87 | -914 | 0 | 343 | 21 |
Bitcoin tops Strength Scores
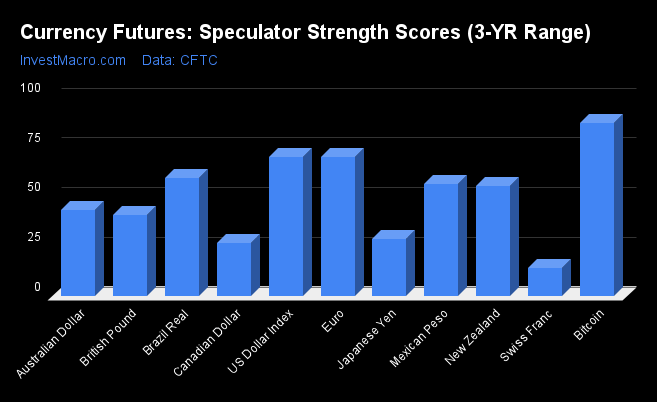
Strength Scores (a normalized measure of Speculator positions over a 3-Year range, from 0 to 100 where above 80 is extreme bullish and below 20 is extreme bearish) show that Bitcoin (86.9 percent) leads the currency markets at the top of their respective ranges and are both in bullish extreme positions. The US Dollar Index (69.7 percent) and the EuroFX (69.6 percent) come in as the next highest in the currency markets in strength scores.
On the downside, the Swiss Franc (13.8 percent) comes in at the lowest strength score currently and the only one with an extreme bearish level (below 20 percent).
Strength Statistics:
US Dollar Index (69.7 percent) vs US Dollar Index previous week (75.3 percent)
EuroFX (69.6 percent) vs EuroFX previous week (68.0 percent)
British Pound Sterling (40.8 percent) vs British Pound Sterling previous week (34.9 percent)
Japanese Yen (28.3 percent) vs Japanese Yen previous week (22.5 percent)
Swiss Franc (13.8 percent) vs Swiss Franc previous week (13.0 percent)
Canadian Dollar (26.4 percent) vs Canadian Dollar previous week (19.8 percent)
Australian Dollar (43.3 percent) vs Australian Dollar previous week (41.6 percent)
New Zealand Dollar (55.1 percent) vs New Zealand Dollar previous week (55.6 percent)
Mexican Peso (56.3 percent) vs Mexican Peso previous week (52.8 percent)
Brazilian Real (59.2 percent) vs Brazilian Real previous week (54.8 percent)
Bitcoin (86.9 percent) vs Bitcoin previous week (77.3 percent)
Strength Trends led by Mexican Peso
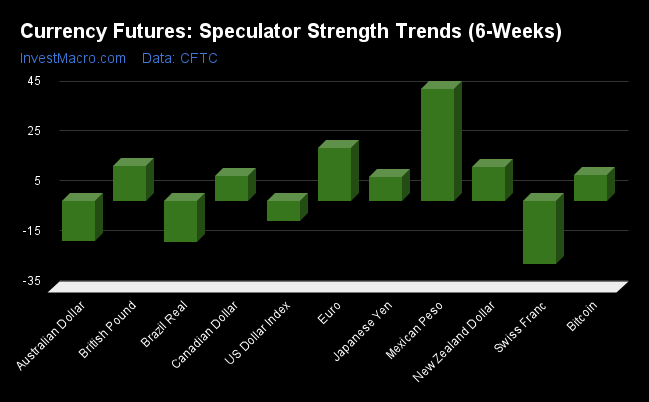
Strength Score Trends (or move index, calculates the 6-week changes in strength scores) showed that the Mexican Peso (44.9 percent) leads the past six weeks trends for the currency markets this week. The EuroFX (21.2 percent), the British Pound Sterling (14.3 percent) and the New Zealand Dollar (13.9 percent) fill out the top movers in the latest trends data.
The Swiss Franc (-25.3 percent) leads the downside trend scores currently while the next markets with lower trend scores were the Brazilian Real (-16.5 percent), the Australian Dollar (-15.8 percent) and the US Dollar Index (-8.1 percent).
Strength Trend Statistics:
US Dollar Index (-8.1 percent) vs US Dollar Index previous week (-0.6 percent)
EuroFX (21.2 percent) vs EuroFX previous week (22.7 percent)
British Pound Sterling (14.3 percent) vs British Pound Sterling previous week (5.7 percent)
Japanese Yen (9.7 percent) vs Japanese Yen previous week (4.5 percent)
Swiss Franc (-25.3 percent) vs Swiss Franc previous week (-29.0 percent)
Canadian Dollar (10.1 percent) vs Canadian Dollar previous week (-1.0 percent)
Australian Dollar (-15.8 percent) vs Australian Dollar previous week (-11.2 percent)
New Zealand Dollar (13.9 percent) vs New Zealand Dollar previous week (9.6 percent)
Mexican Peso (44.9 percent) vs Mexican Peso previous week (43.0 percent)
Brazilian Real (-16.5 percent) vs Brazilian Real previous week (-28.8 percent)
Bitcoin (10.5 percent) vs Bitcoin previous week (-17.5 percent)
Individual COT Forex Markets:
US Dollar Index Futures:
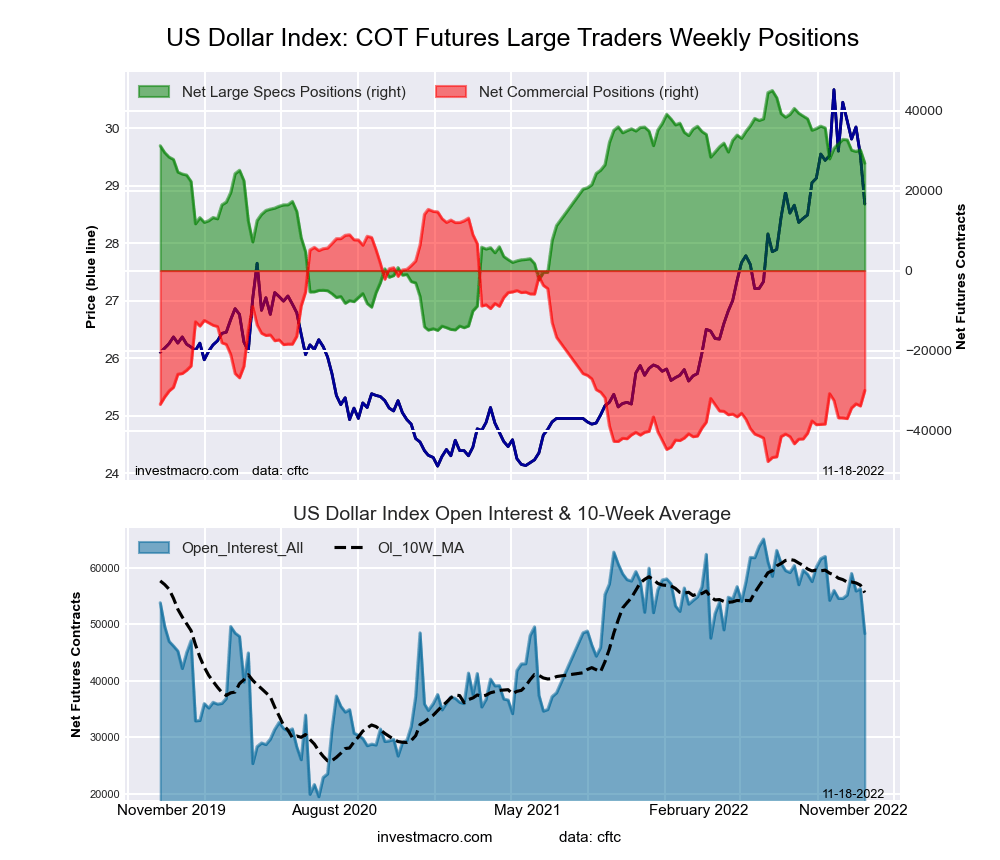 The US Dollar Index large speculator standing this week recorded a net position of 26,854 contracts in the data reported through Tuesday. This was a weekly reduction of -3,339 contracts from the previous week which had a total of 30,193 net contracts.
This week’s current strength score (the trader positioning range over the past three years, measured from 0 to 100) shows the speculators are currently Bullish with a score of 69.7 percent. The commercials are Bearish with a score of 28.2 percent and the small traders (not shown in chart) are Bullish with a score of 50.7 percent.
| US DOLLAR INDEX Statistics | SPECULATORS | COMMERCIALS | SMALL TRADERS |
| – Percent of Open Interest Longs: | 80.5 | 4.4 | 12.1 |
| – Percent of Open Interest Shorts: | 25.0 | 66.4 | 5.6 |
| – Net Position: | 26,854 | -29,981 | 3,127 |
| – Gross Longs: | 38,965 | 2,149 | 5,843 |
| – Gross Shorts: | 12,111 | 32,130 | 2,716 |
| – Long to Short Ratio: | 3.2 to 1 | 0.1 to 1 | 2.2 to 1 |
| NET POSITION TREND: | | | |
| – Strength Index Score (3 Year Range Pct): | 69.7 | 28.2 | 50.7 |
| – Strength Index Reading (3 Year Range): | Bullish | Bearish | Bullish |
| NET POSITION MOVEMENT INDEX: | | | |
| – 6-Week Change in Strength Index: | -8.1 | 10.8 | -21.8 |
Euro Currency Futures:
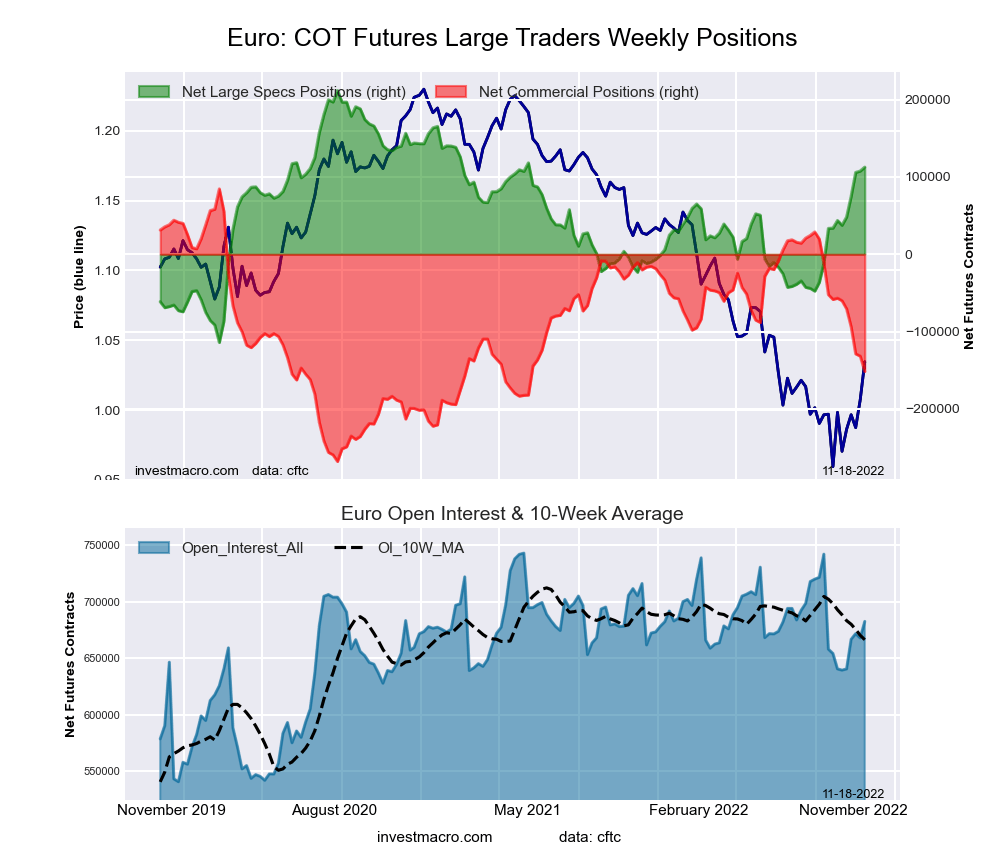 The Euro Currency large speculator standing this week recorded a net position of 112,666 contracts in the data reported through Tuesday. This was a weekly gain of 5,067 contracts from the previous week which had a total of 107,599 net contracts.
This week’s current strength score (the trader positioning range over the past three years, measured from 0 to 100) shows the speculators are currently Bullish with a score of 69.6 percent. The commercials are Bearish with a score of 33.0 percent and the small traders (not shown in chart) are Bearish with a score of 41.1 percent.
| EURO Currency Statistics | SPECULATORS | COMMERCIALS | SMALL TRADERS |
| – Percent of Open Interest Longs: | 35.1 | 50.3 | 12.6 |
| – Percent of Open Interest Shorts: | 18.6 | 72.5 | 6.9 |
| – Net Position: | 112,666 | -151,573 | 38,907 |
| – Gross Longs: | 239,369 | 343,388 | 86,147 |
| – Gross Shorts: | 126,703 | 494,961 | 47,240 |
| – Long to Short Ratio: | 1.9 to 1 | 0.7 to 1 | 1.8 to 1 |
| NET POSITION TREND: | | | |
| – Strength Index Score (3 Year Range Pct): | 69.6 | 33.0 | 41.1 |
| – Strength Index Reading (3 Year Range): | Bullish | Bearish | Bearish |
| NET POSITION MOVEMENT INDEX: | | | |
| – 6-Week Change in Strength Index: | 21.2 | -26.9 | 41.1 |
British Pound Sterling Futures:
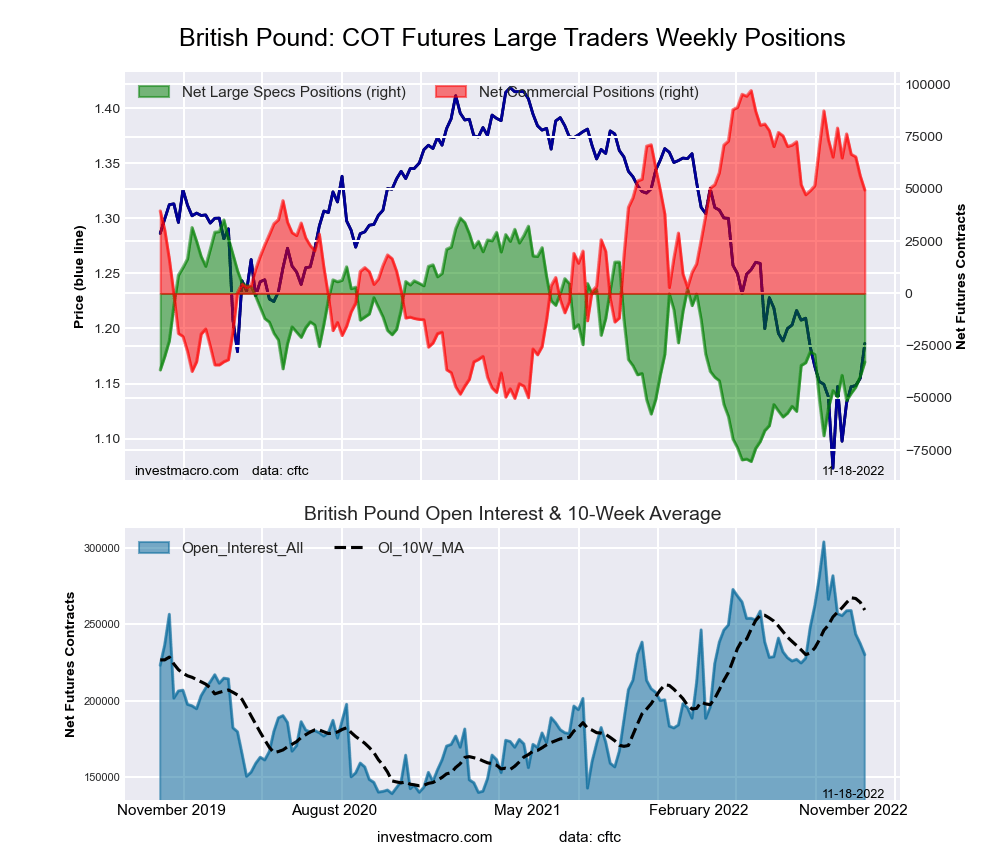 The British Pound Sterling large speculator standing this week recorded a net position of -32,834 contracts in the data reported through Tuesday. This was a weekly boost of 6,901 contracts from the previous week which had a total of -39,735 net contracts.
This week’s current strength score (the trader positioning range over the past three years, measured from 0 to 100) shows the speculators are currently Bearish with a score of 40.8 percent. The commercials are Bullish with a score of 67.7 percent and the small traders (not shown in chart) are Bearish with a score of 25.4 percent.
| BRITISH POUND Statistics | SPECULATORS | COMMERCIALS | SMALL TRADERS |
| – Percent of Open Interest Longs: | 15.1 | 74.0 | 8.6 |
| – Percent of Open Interest Shorts: | 29.3 | 52.5 | 15.8 |
| – Net Position: | -32,834 | 49,439 | -16,605 |
| – Gross Longs: | 34,699 | 170,322 | 19,676 |
| – Gross Shorts: | 67,533 | 120,883 | 36,281 |
| – Long to Short Ratio: | 0.5 to 1 | 1.4 to 1 | 0.5 to 1 |
| NET POSITION TREND: | | | |
| – Strength Index Score (3 Year Range Pct): | 40.8 | 67.7 | 25.4 |
| – Strength Index Reading (3 Year Range): | Bearish | Bullish | Bearish |
| NET POSITION MOVEMENT INDEX: | | | |
| – 6-Week Change in Strength Index: | 14.3 | -20.2 | 25.4 |
Japanese Yen Futures:
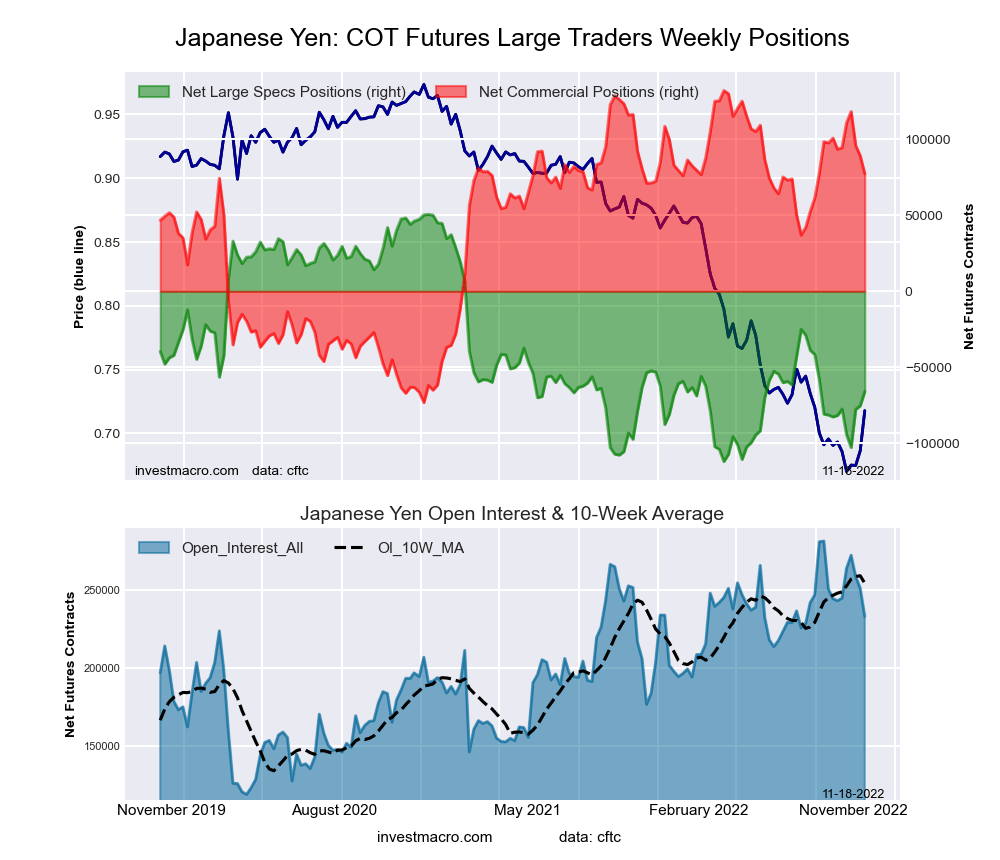 The Japanese Yen large speculator standing this week recorded a net position of -65,842 contracts in the data reported through Tuesday. This was a weekly boost of 9,416 contracts from the previous week which had a total of -75,258 net contracts.
This week’s current strength score (the trader positioning range over the past three years, measured from 0 to 100) shows the speculators are currently Bearish with a score of 28.3 percent. The commercials are Bullish with a score of 73.3 percent and the small traders (not shown in chart) are Bearish with a score of 30.3 percent.
| JAPANESE YEN Statistics | SPECULATORS | COMMERCIALS | SMALL TRADERS |
| – Percent of Open Interest Longs: | 14.5 | 74.1 | 10.3 |
| – Percent of Open Interest Shorts: | 42.7 | 41.0 | 15.2 |
| – Net Position: | -65,842 | 77,213 | -11,371 |
| – Gross Longs: | 33,797 | 172,905 | 24,061 |
| – Gross Shorts: | 99,639 | 95,692 | 35,432 |
| – Long to Short Ratio: | 0.3 to 1 | 1.8 to 1 | 0.7 to 1 |
| NET POSITION TREND: | | | |
| – Strength Index Score (3 Year Range Pct): | 28.3 | 73.3 | 30.3 |
| – Strength Index Reading (3 Year Range): | Bearish | Bullish | Bearish |
| NET POSITION MOVEMENT INDEX: | | | |
| – 6-Week Change in Strength Index: | 9.7 | -7.9 | 0.7 |
Swiss Franc Futures:
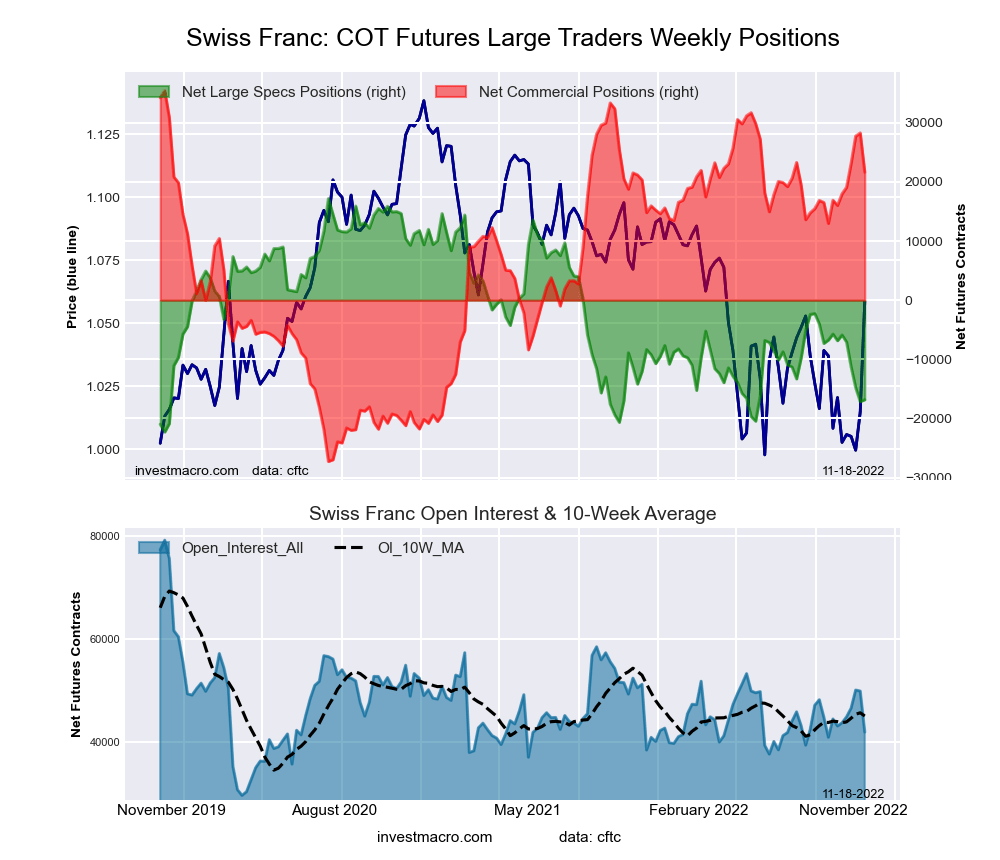 The Swiss Franc large speculator standing this week recorded a net position of -16,827 contracts in the data reported through Tuesday. This was a weekly gain of 327 contracts from the previous week which had a total of -17,154 net contracts.
This week’s current strength score (the trader positioning range over the past three years, measured from 0 to 100) shows the speculators are currently Bearish-Extreme with a score of 13.8 percent. The commercials are Bullish with a score of 78.0 percent and the small traders (not shown in chart) are Bearish with a score of 41.2 percent.
| SWISS FRANC Statistics | SPECULATORS | COMMERCIALS | SMALL TRADERS |
| – Percent of Open Interest Longs: | 5.4 | 69.7 | 24.0 |
| – Percent of Open Interest Shorts: | 45.5 | 18.1 | 35.4 |
| – Net Position: | -16,827 | 21,637 | -4,810 |
| – Gross Longs: | 2,271 | 29,249 | 10,058 |
| – Gross Shorts: | 19,098 | 7,612 | 14,868 |
| – Long to Short Ratio: | 0.1 to 1 | 3.8 to 1 | 0.7 to 1 |
| NET POSITION TREND: | | | |
| – Strength Index Score (3 Year Range Pct): | 13.8 | 78.0 | 41.2 |
| – Strength Index Reading (3 Year Range): | Bearish-Extreme | Bullish | Bearish |
| NET POSITION MOVEMENT INDEX: | | | |
| – 6-Week Change in Strength Index: | -25.3 | 9.0 | 14.8 |
Canadian Dollar Futures:
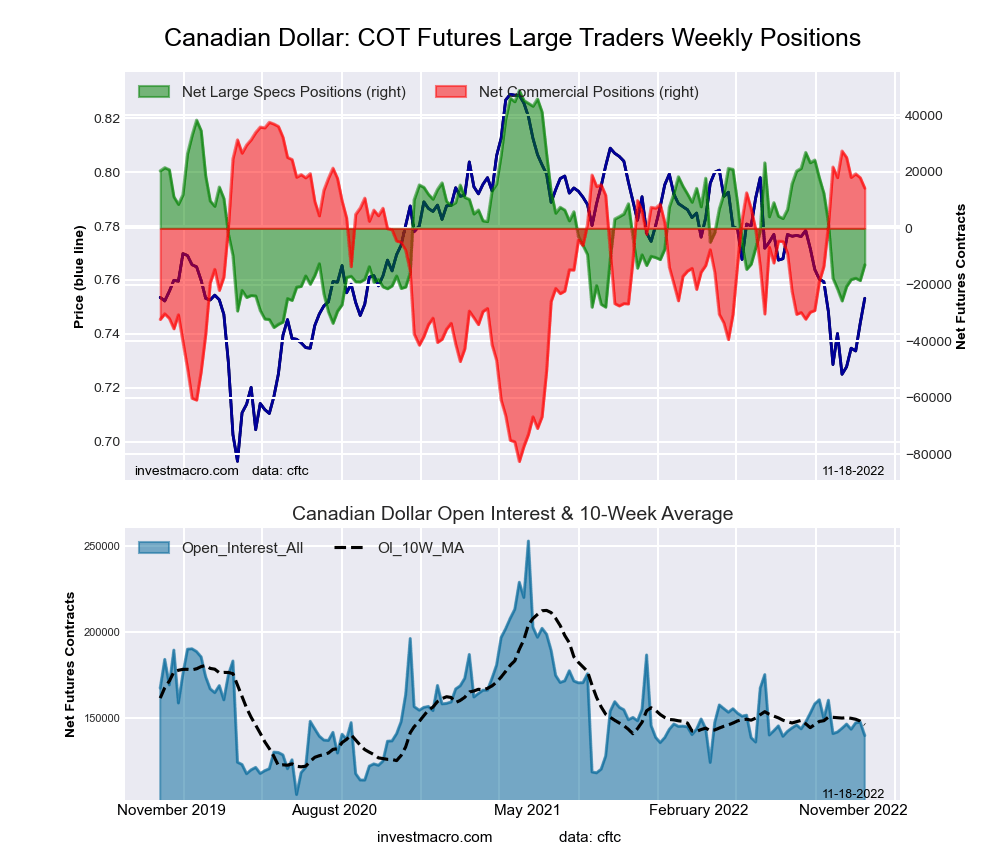 The Canadian Dollar large speculator standing this week recorded a net position of -12,920 contracts in the data reported through Tuesday. This was a weekly boost of 5,544 contracts from the previous week which had a total of -18,464 net contracts.
This week’s current strength score (the trader positioning range over the past three years, measured from 0 to 100) shows the speculators are currently Bearish with a score of 26.4 percent. The commercials are Bullish-Extreme with a score of 80.6 percent and the small traders (not shown in chart) are Bearish with a score of 27.5 percent.
| CANADIAN DOLLAR Statistics | SPECULATORS | COMMERCIALS | SMALL TRADERS |
| – Percent of Open Interest Longs: | 26.8 | 50.2 | 21.8 |
| – Percent of Open Interest Shorts: | 36.0 | 40.0 | 22.7 |
| – Net Position: | -12,920 | 14,229 | -1,309 |
| – Gross Longs: | 37,456 | 70,173 | 30,478 |
| – Gross Shorts: | 50,376 | 55,944 | 31,787 |
| – Long to Short Ratio: | 0.7 to 1 | 1.3 to 1 | 1.0 to 1 |
| NET POSITION TREND: | | | |
| – Strength Index Score (3 Year Range Pct): | 26.4 | 80.6 | 27.5 |
| – Strength Index Reading (3 Year Range): | Bearish | Bullish-Extreme | Bearish |
| NET POSITION MOVEMENT INDEX: | | | |
| – 6-Week Change in Strength Index: | 10.1 | -3.1 | -9.6 |
Australian Dollar Futures:
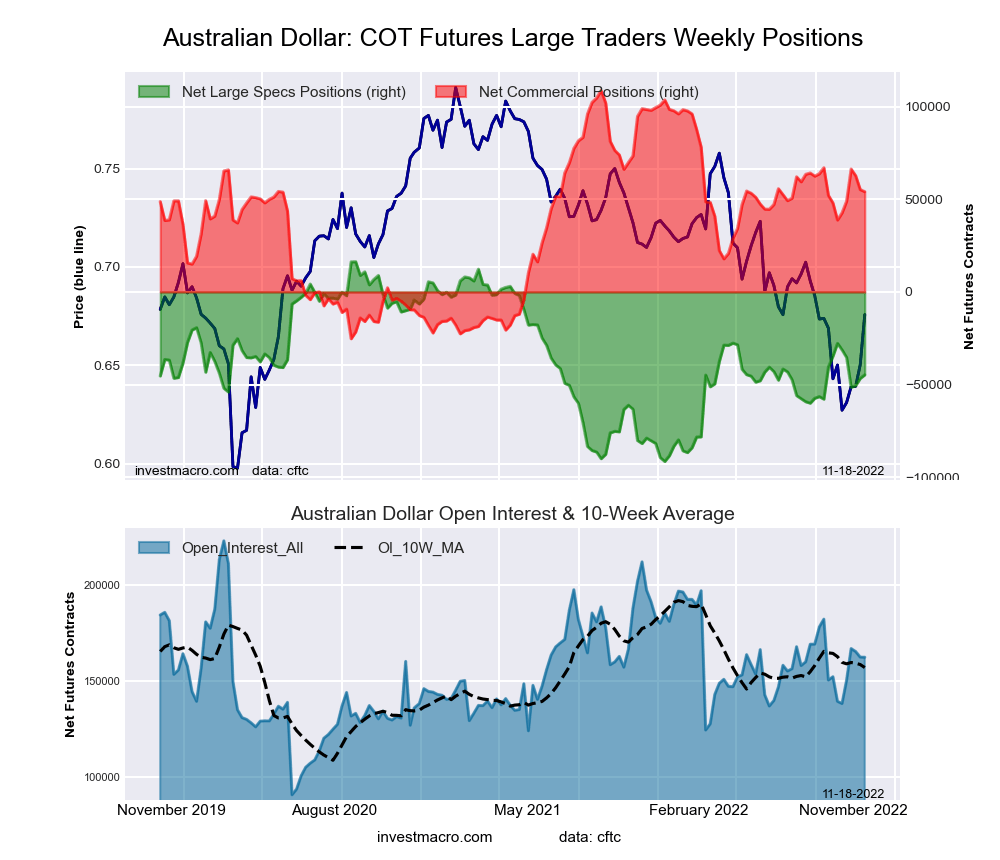 The Australian Dollar large speculator standing this week recorded a net position of -44,749 contracts in the data reported through Tuesday. This was a weekly lift of 1,934 contracts from the previous week which had a total of -46,683 net contracts.
This week’s current strength score (the trader positioning range over the past three years, measured from 0 to 100) shows the speculators are currently Bearish with a score of 43.3 percent. The commercials are Bullish with a score of 59.3 percent and the small traders (not shown in chart) are Bearish with a score of 29.6 percent.
| AUSTRALIAN DOLLAR Statistics | SPECULATORS | COMMERCIALS | SMALL TRADERS |
| – Percent of Open Interest Longs: | 20.4 | 67.8 | 9.3 |
| – Percent of Open Interest Shorts: | 48.0 | 34.5 | 15.0 |
| – Net Position: | -44,749 | 54,112 | -9,363 |
| – Gross Longs: | 33,214 | 110,099 | 15,029 |
| – Gross Shorts: | 77,963 | 55,987 | 24,392 |
| – Long to Short Ratio: | 0.4 to 1 | 2.0 to 1 | 0.6 to 1 |
| NET POSITION TREND: | | | |
| – Strength Index Score (3 Year Range Pct): | 43.3 | 59.3 | 29.6 |
| – Strength Index Reading (3 Year Range): | Bearish | Bullish | Bearish |
| NET POSITION MOVEMENT INDEX: | | | |
| – 6-Week Change in Strength Index: | -15.8 | 11.4 | 4.1 |
New Zealand Dollar Futures:
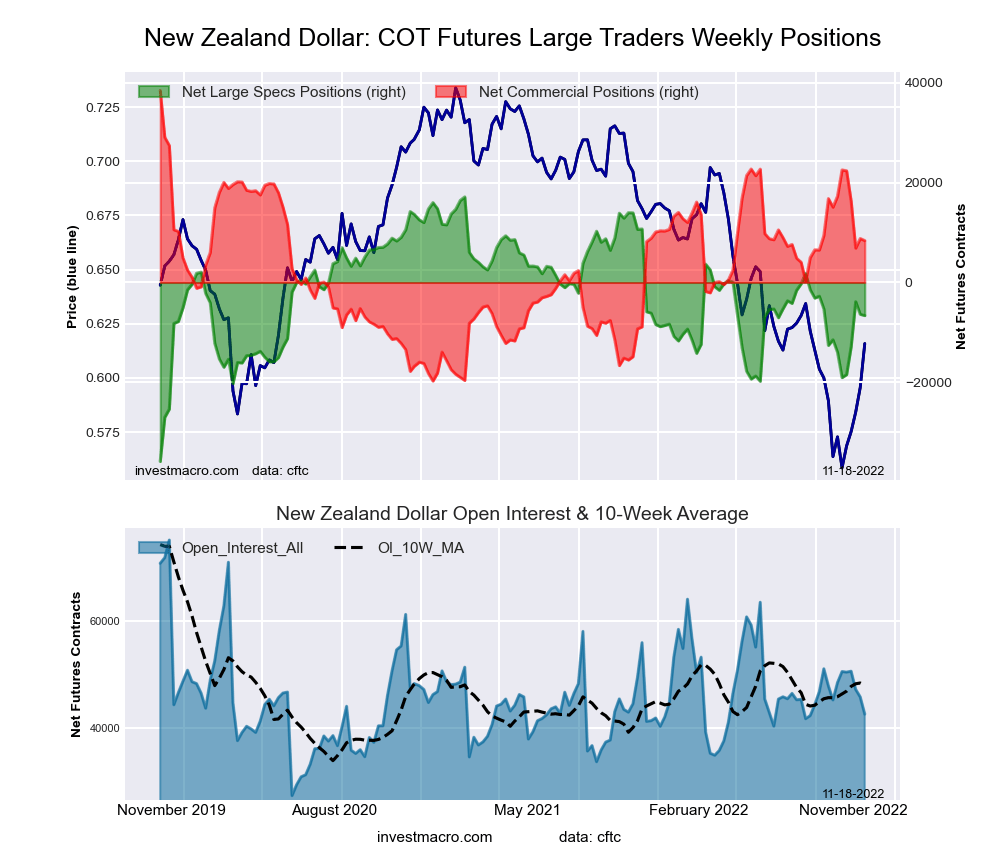 The New Zealand Dollar large speculator standing this week recorded a net position of -6,628 contracts in the data reported through Tuesday. This was a weekly reduction of -261 contracts from the previous week which had a total of -6,367 net contracts.
This week’s current strength score (the trader positioning range over the past three years, measured from 0 to 100) shows the speculators are currently Bullish with a score of 55.1 percent. The commercials are Bearish with a score of 48.3 percent and the small traders (not shown in chart) are Bearish with a score of 31.5 percent.
| NEW ZEALAND DOLLAR Statistics | SPECULATORS | COMMERCIALS | SMALL TRADERS |
| – Percent of Open Interest Longs: | 35.9 | 57.1 | 6.3 |
| – Percent of Open Interest Shorts: | 51.5 | 37.4 | 10.4 |
| – Net Position: | -6,628 | 8,381 | -1,753 |
| – Gross Longs: | 15,285 | 24,311 | 2,680 |
| – Gross Shorts: | 21,913 | 15,930 | 4,433 |
| – Long to Short Ratio: | 0.7 to 1 | 1.5 to 1 | 0.6 to 1 |
| NET POSITION TREND: | | | |
| – Strength Index Score (3 Year Range Pct): | 55.1 | 48.3 | 31.5 |
| – Strength Index Reading (3 Year Range): | Bullish | Bearish | Bearish |
| NET POSITION MOVEMENT INDEX: | | | |
| – 6-Week Change in Strength Index: | 13.9 | -15.3 | 17.6 |
Mexican Peso Futures:
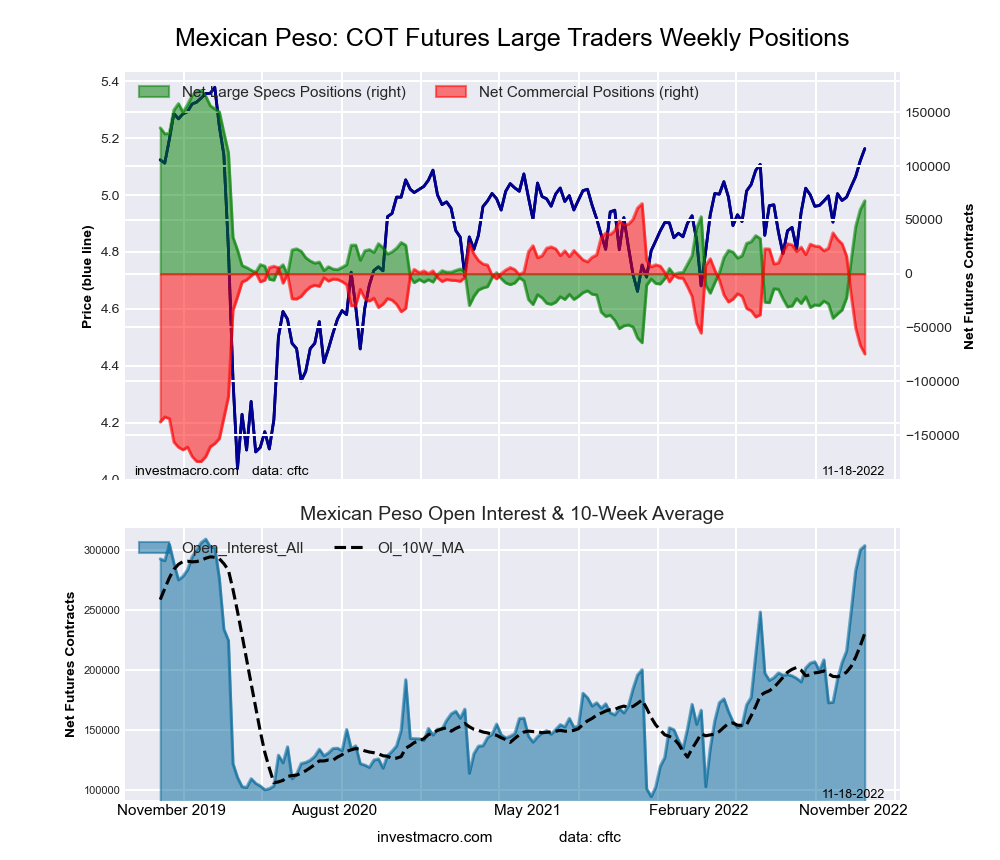 The Mexican Peso large speculator standing this week recorded a net position of 67,851 contracts in the data reported through Tuesday. This was a weekly increase of 8,237 contracts from the previous week which had a total of 59,614 net contracts.
This week’s current strength score (the trader positioning range over the past three years, measured from 0 to 100) shows the speculators are currently Bullish with a score of 56.3 percent. The commercials are Bearish with a score of 41.7 percent and the small traders (not shown in chart) are Bullish with a score of 71.5 percent.
| MEXICAN PESO Statistics | SPECULATORS | COMMERCIALS | SMALL TRADERS |
| – Percent of Open Interest Longs: | 65.2 | 31.5 | 3.1 |
| – Percent of Open Interest Shorts: | 42.8 | 56.1 | 0.9 |
| – Net Position: | 67,851 | -74,563 | 6,712 |
| – Gross Longs: | 197,700 | 95,530 | 9,390 |
| – Gross Shorts: | 129,849 | 170,093 | 2,678 |
| – Long to Short Ratio: | 1.5 to 1 | 0.6 to 1 | 3.5 to 1 |
| NET POSITION TREND: | | | |
| – Strength Index Score (3 Year Range Pct): | 56.3 | 41.7 | 71.5 |
| – Strength Index Reading (3 Year Range): | Bullish | Bearish | Bullish |
| NET POSITION MOVEMENT INDEX: | | | |
| – 6-Week Change in Strength Index: | 44.9 | -44.4 | 5.5 |
Brazilian Real Futures:
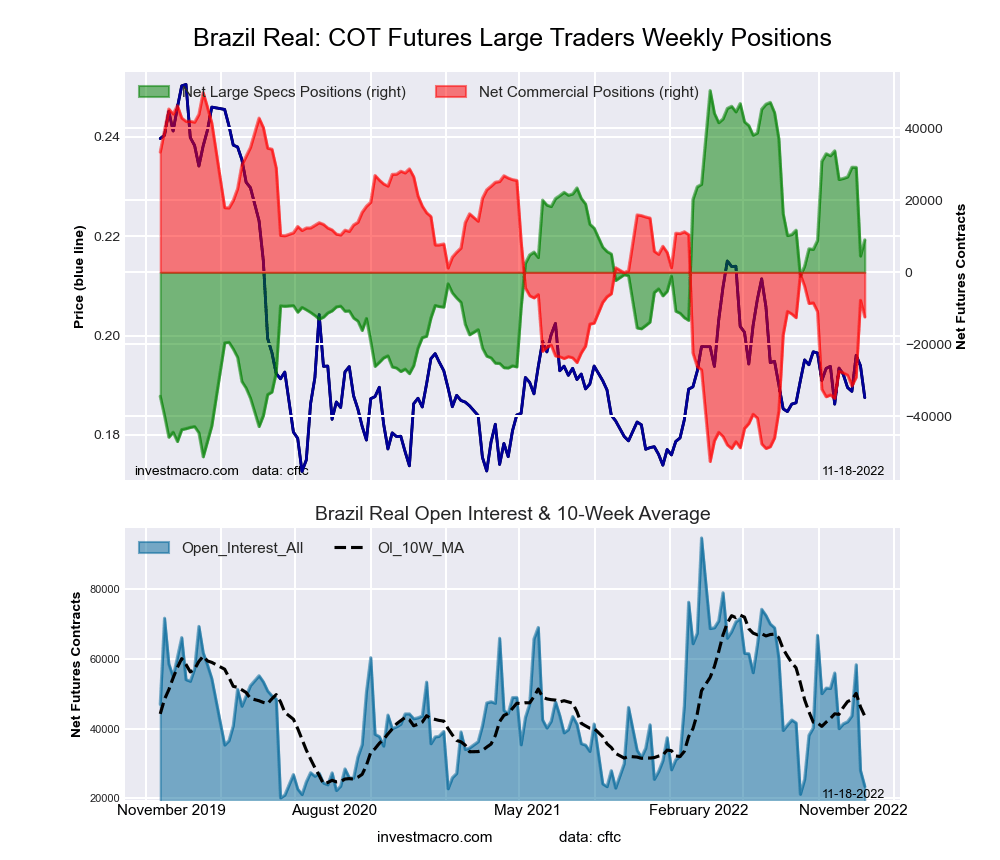 The Brazilian Real large speculator standing this week recorded a net position of 9,018 contracts in the data reported through Tuesday. This was a weekly lift of 4,517 contracts from the previous week which had a total of 4,501 net contracts.
This week’s current strength score (the trader positioning range over the past three years, measured from 0 to 100) shows the speculators are currently Bullish with a score of 59.2 percent. The commercials are Bearish with a score of 39.2 percent and the small traders (not shown in chart) are Bullish-Extreme with a score of 100.0 percent.
| BRAZIL REAL Statistics | SPECULATORS | COMMERCIALS | SMALL TRADERS |
| – Percent of Open Interest Longs: | 69.9 | 8.5 | 20.2 |
| – Percent of Open Interest Shorts: | 31.4 | 61.3 | 5.8 |
| – Net Position: | 9,018 | -12,404 | 3,386 |
| – Gross Longs: | 16,397 | 1,986 | 4,742 |
| – Gross Shorts: | 7,379 | 14,390 | 1,356 |
| – Long to Short Ratio: | 2.2 to 1 | 0.1 to 1 | 3.5 to 1 |
| NET POSITION TREND: | | | |
| – Strength Index Score (3 Year Range Pct): | 59.2 | 39.2 | 100.0 |
| – Strength Index Reading (3 Year Range): | Bullish | Bearish | Bullish-Extreme |
| NET POSITION MOVEMENT INDEX: | | | |
| – 6-Week Change in Strength Index: | -16.5 | 14.8 | 17.9 |
Bitcoin Futures:
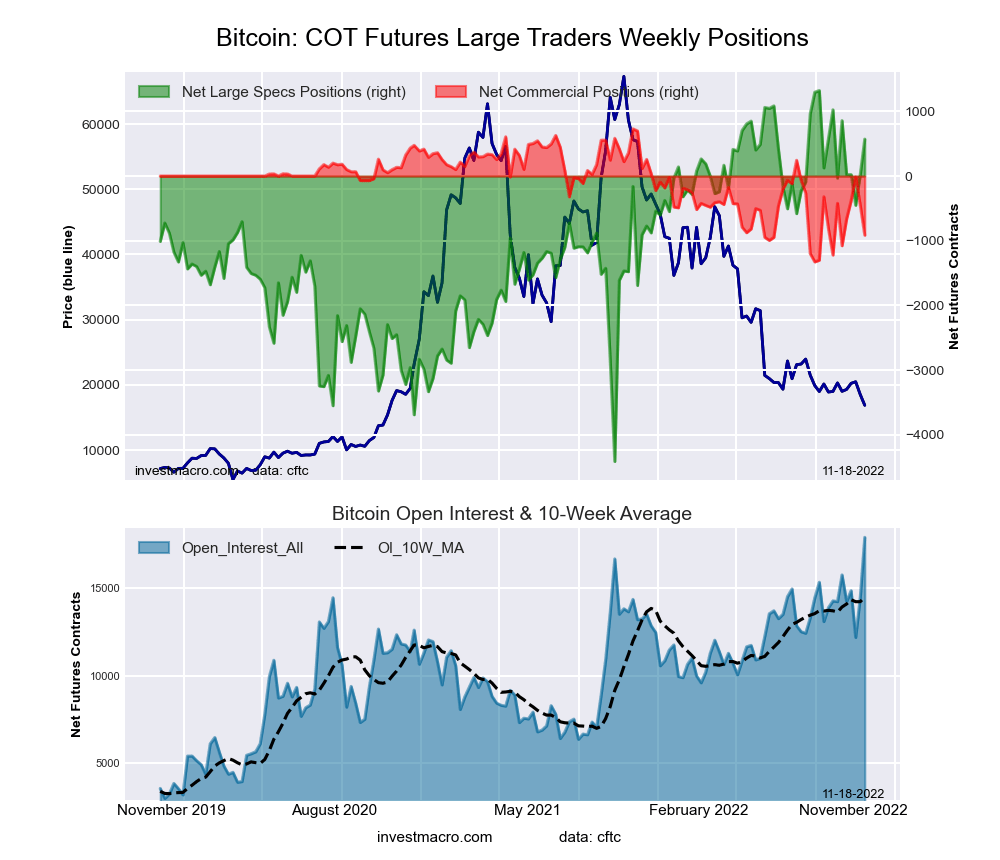 The Bitcoin large speculator standing this week recorded a net position of 571 contracts in the data reported through Tuesday. This was a weekly increase of 553 contracts from the previous week which had a total of 18 net contracts.
This week’s current strength score (the trader positioning range over the past three years, measured from 0 to 100) shows the speculators are currently Bullish-Extreme with a score of 86.9 percent. The commercials are Bearish with a score of 20.1 percent and the small traders (not shown in chart) are Bearish with a score of 20.7 percent.
| BITCOIN Statistics | SPECULATORS | COMMERCIALS | SMALL TRADERS |
| – Percent of Open Interest Longs: | 78.7 | 0.8 | 6.9 |
| – Percent of Open Interest Shorts: | 75.6 | 5.9 | 5.0 |
| – Net Position: | 571 | -914 | 343 |
| – Gross Longs: | 14,096 | 137 | 1,231 |
| – Gross Shorts: | 13,525 | 1,051 | 888 |
| – Long to Short Ratio: | 1.0 to 1 | 0.1 to 1 | 1.4 to 1 |
| NET POSITION TREND: | | | |
| – Strength Index Score (3 Year Range Pct): | 86.9 | 20.1 | 20.7 |
| – Strength Index Reading (3 Year Range): | Bullish-Extreme | Bearish | Bearish |
| NET POSITION MOVEMENT INDEX: | | | |
| – 6-Week Change in Strength Index: | 10.5 | -24.0 | -2.5 |
Article By InvestMacro – Receive our weekly COT Newsletter
*COT Report: The COT data, released weekly to the public each Friday, is updated through the most recent Tuesday (data is 3 days old) and shows a quick view of how large speculators or non-commercials (for-profit traders) were positioned in the futures markets.
The CFTC categorizes trader positions according to commercial hedgers (traders who use futures contracts for hedging as part of the business), non-commercials (large traders who speculate to realize trading profits) and nonreportable traders (usually small traders/speculators) as well as their open interest (contracts open in the market at time of reporting). See CFTC criteria here.


