By JustMarkets
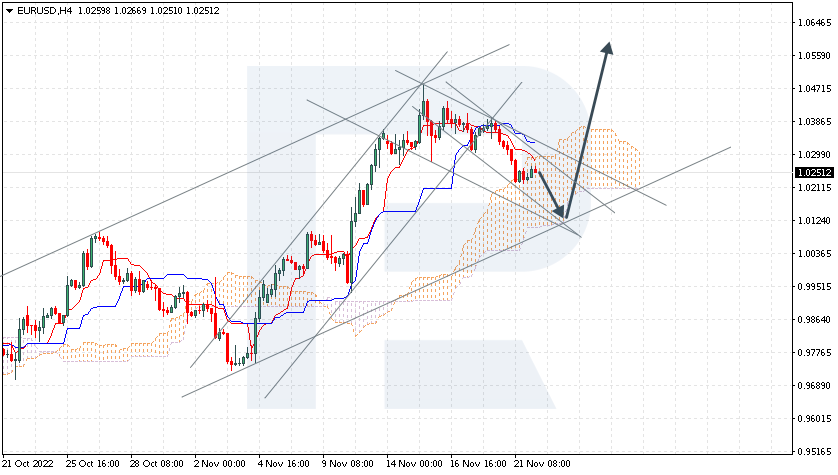
The EUR/USD currency pair
- Prev Open: 1.0329
- Prev Close: 1.0407
- % chg. over the last day: +0.76 %
Eurozone’s inflation eased in November from 10.6 to 10% y/y due to falling energy prices. Core inflation remained stable at 5%. Nevertheless, economists warn that lower inflation is unlikely to prevent the European Central Bank from raising interest rates as food inflation continues to rise. Whether this is the peak of overall inflation remains to be seen. But the current economic situation could push the European Central Bank to hike less by 50 basis points next month.
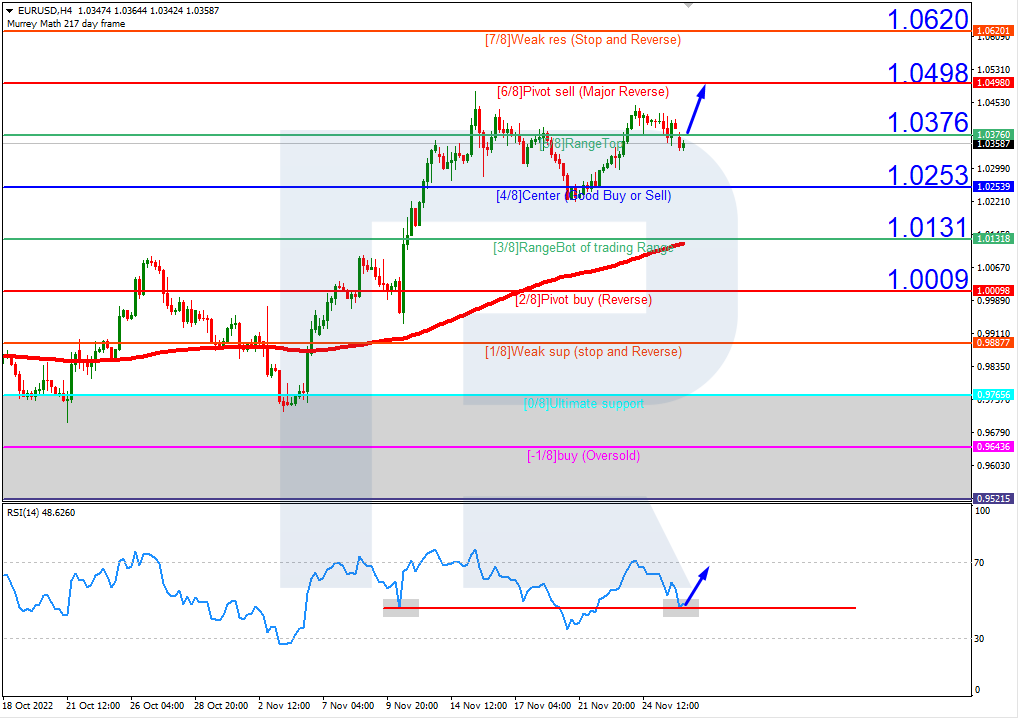
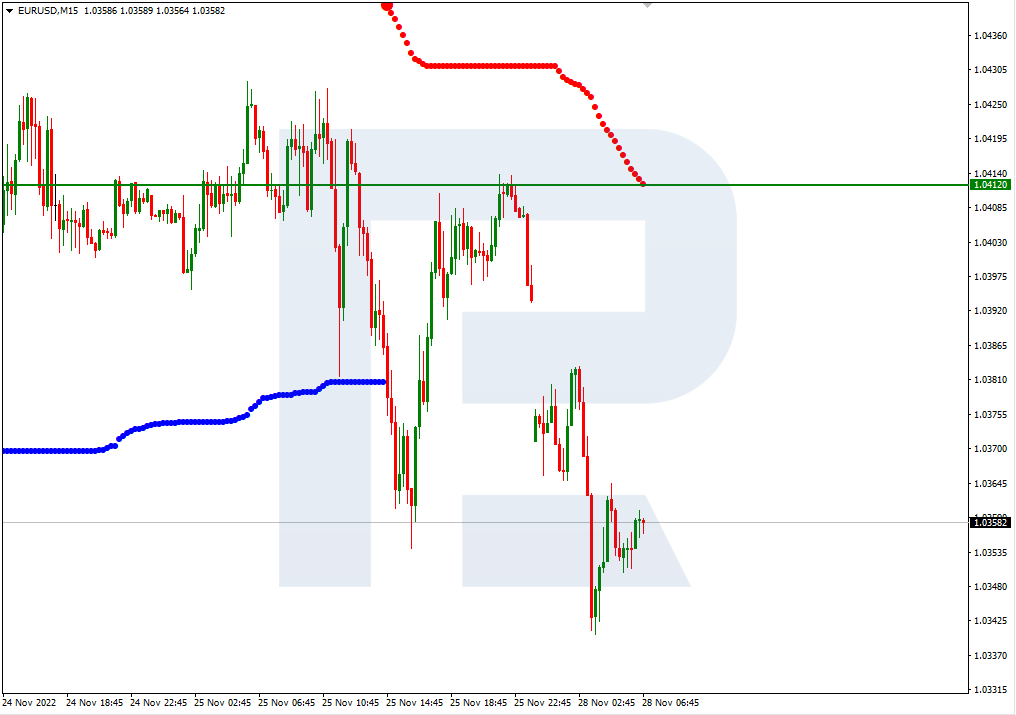
- Support levels: 1.0361, 1.0332, 1.0284, 1.0193, 1.0092, 1.0043, 0.9968
- Resistance levels: 1.0444, 1.0504
The trend on the EUR/USD currency pair on the hourly time frame is bullish. The price is trading above the moving averages, and the MACD indicator is in the positive zone with no signs of reversal. Buy trades are best considered from the support level of 1.0361, but with additional confirmation. Sell deals can be considered from the resistance level of 1.0444, but it is better with confirmation in the form of reverse initiative.
Alternative scenario: if the price breaks down through the support level of 1.0284 and fixes below it, the downtrend will likely resume.

- – German Retail Sales (m/m) at 09:00 (GMT+3);
- – Spanish Manufacturing PMI (m/m) at 10:15 (GMT+3);
- – Italian Manufacturing PMI (m/m) at 10:45 (GMT+3);
- – French Manufacturing PMI (m/m) at 10:50 (GMT+3);
- – German Manufacturing PMI (m/m) at 10:55 (GMT+3);
- – Eurozone Manufacturing PMI (m/m) at 11:00 (GMT+3);
- – Eurozone Unemployment Rate (m/m) at 12:00 (GMT+3);
- – US PCE Price index (m/m) at 15:30 (GMT+3);
- – US Initial Jobless Claims (w/w) at 15:30 (GMT+3);
- – US FOMC Member Bowman Speaks at 16:30 (GMT+3);
- – US ISM Manufacturing PMI (m/m) at 17:00 (GMT+3).
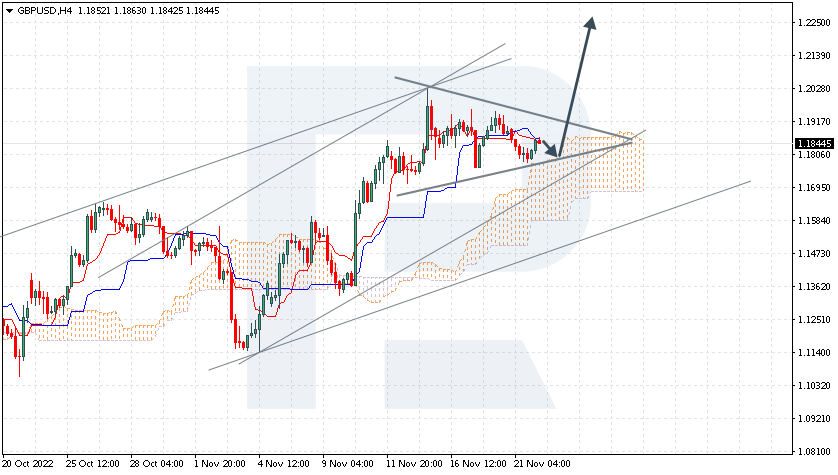
The GBP/USD currency pair
- Prev Open: 1.1958
- Prev Close: 1.2056
- % chg. over the last day: +0.82 %
A Bank of England spokesman said yesterday that UK inflation will fall rapidly in the 2nd half of 2023. But it is not yet the reason how this will happen, as at the moment, the UK labor market remains weak, and household incomes are shrinking. The Bank of England intends to raise interest rates at the next meeting, which will put even more pressure on the economy.
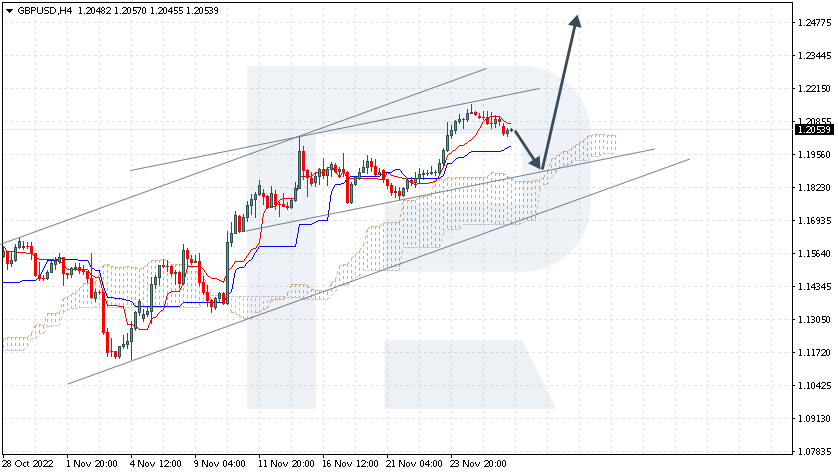
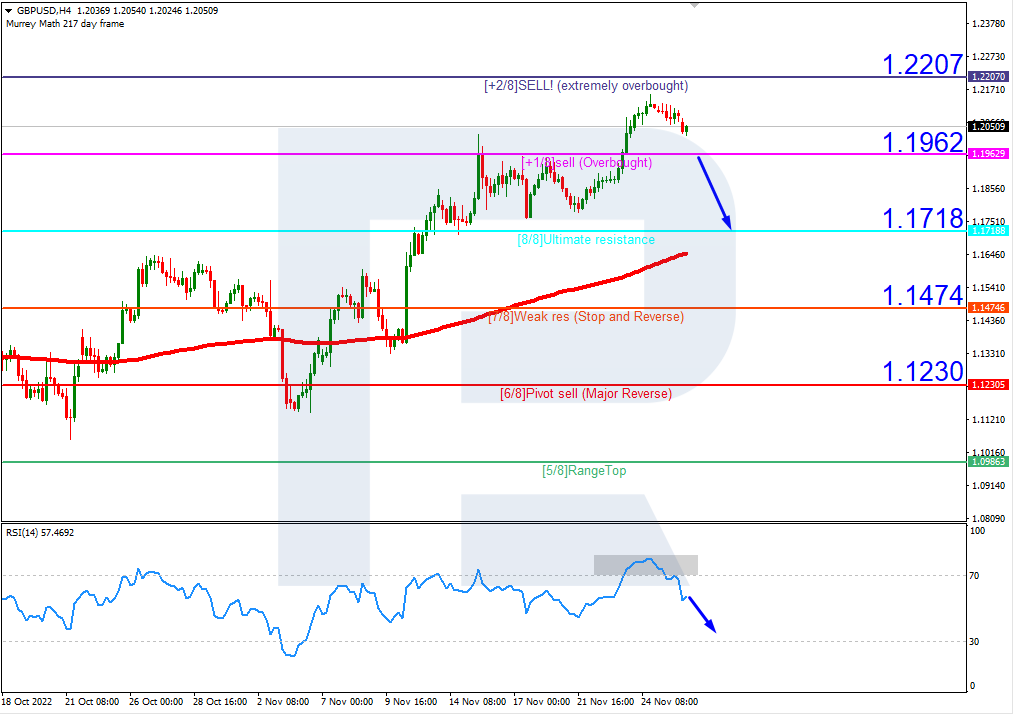
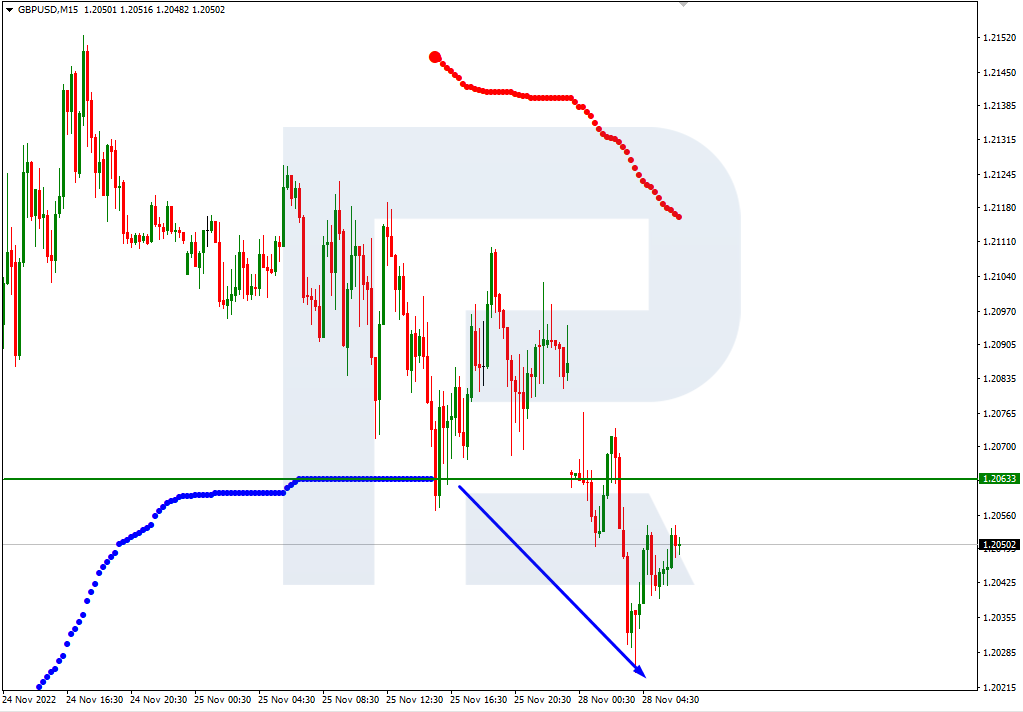
- Support levels: 1.2015, 1.1964, 1.1684, 1.1476, 1.1418, 1.1172, 1.1093
- Resistance levels: 1.2113, 1.2147, 1.2167
From the technical point of view, the trend on the GBP/USD currency pair on the hourly time frame is bullish. The price is trading above the moving levels. The MACD indicator became positive, and the buyers’ pressure inside the day. Under such market conditions, it is better to look for buy trades from the support level of 1.2015, but with confirmation. Sell trades are best sought on intraday time frames from resistance levels of 1.2113, but also better with confirmation, as the level has already been tested.
Alternative scenario: if the price breaks down of the 1.1900 support level and fixes below it, the downtrend will likely resume.

- – UK Manufacturing PMI (m/m) at 11:30 (GMT+3).
The USD/JPY currency pair
- Prev Open: 138.63
- Prev Close: 138.08
- % chg. over the last day: -0.40%
Japan refrained from intervening in the foreign exchange market in November, the Treasury Department said Wednesday, as rumors grew that the US Federal Reserve would slow the pace of rate hikes as inflation peaked. Weaker-than-expected US inflation data this month somewhat diminished the prospect of aggressive rate hikes by the US Federal Reserve. At the same time, the Bank of Japan remains committed to ultra-low interest rates.
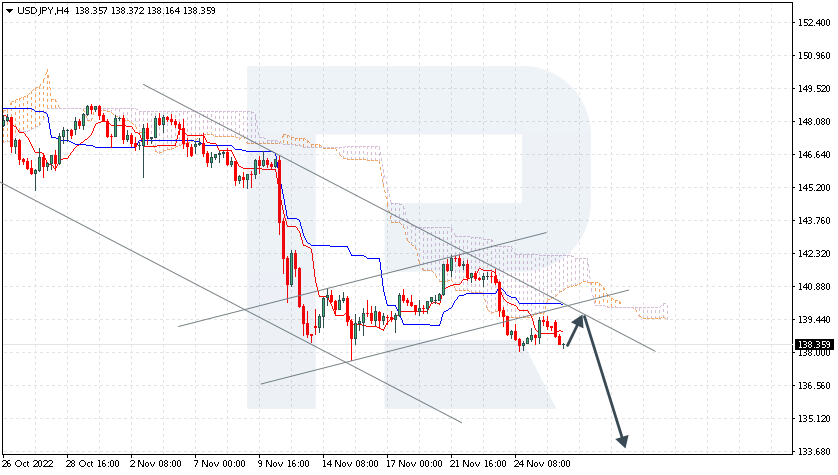
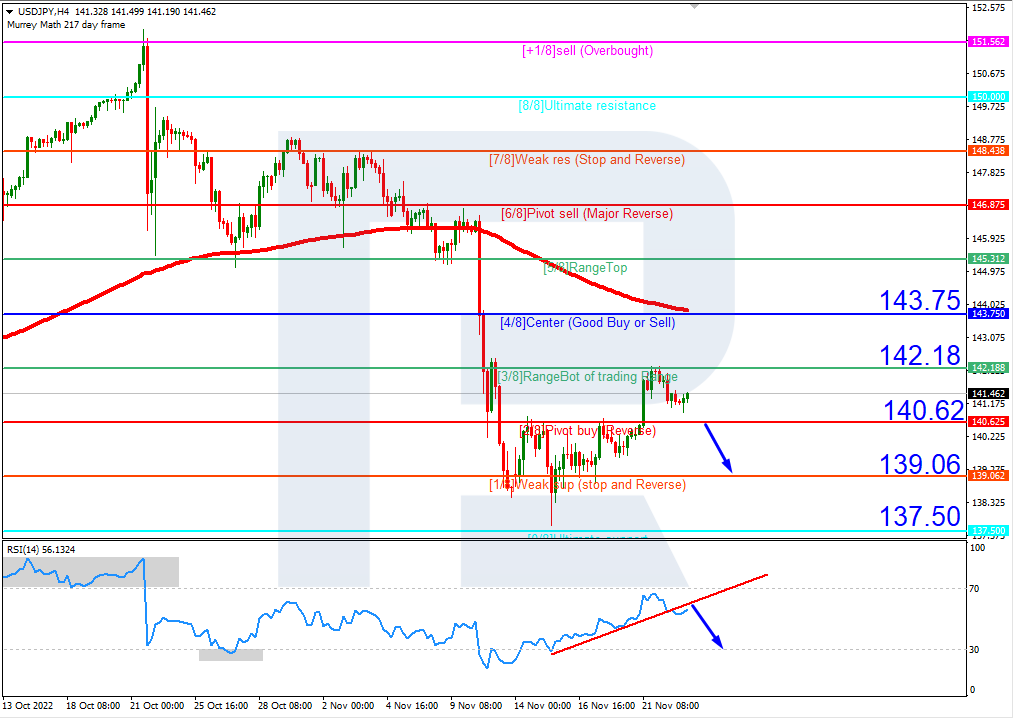
- Support levels: 136.49, 135.20
- Resistance levels: 137.65, 139.09, 140.75, 143.17, 145.16
From the technical point of view, the medium-term trend on the currency pair USD/JPY is bearish. The MACD indicator is in the negative zone, but on higher time frames, a divergence is formed, which indicates a certain weakness of the sellers. Under such market conditions, buy trades can be looked for on intraday time frames from the support level of 136.49, but only with confirmation. Selling could be sought from the resistance level of 137.65 or 139.09, provided there is a reverse reaction.
Alternative scenario: If the price fixes above 140.75, the uptrend will likely resume.

- – Japan Manufacturing PMI (m/m) at 02:30 (GMT+3).
The USD/CAD currency pair
- Prev Open: 1.3578
- Prev Close: 1.3414
- % chg. over the last day: -1.22 %
Dovish comments from Federal Reserve Chairman Jerome Powell and signs of declining inflation in the US raised hopes that the Central Bank would be less aggressive about raising interest rates. The dollar index began to lose ground on such statements, and as a result, USD/CAD went down. The Biden administration is keeping its promise to cut the use of oil reserves in the US, which contributes to the maximum reduction of crude oil reserves in the country in a week. This helped oil prices rise by 3%, which is good for the Canadian currency, as it’s a commodity currency.
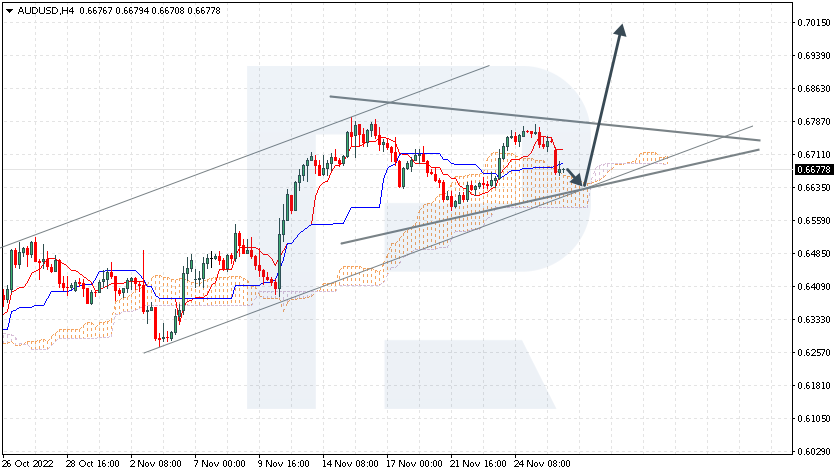
- Support levels: 1.3386, 1.3360, 1.3281, 1.3212
- Resistance levels: 1.3479, 1.3522, 1.3658, 1.3682, 1.3776, 1.3855
From the point of view of technical analysis, the trend on the USD/CAD currency pair has changed to bullish. But the price is close to changing a priority. The MACD indicator is in the negative zone with no signs of reversal. Sellers’ pressure is still present. Buy trades should be considered on the lower time frames from the support level of 1.3386 or 1.3360, but with additional confirmation. For sell deals, it is better to consider the resistance level of 1.3479 but with confirmation in the form of reverse initiative.
Alternative scenario: if the price breaks down and consolidates below the support level of 1.3386, the downtrend will likely resume.

- – Canada Manufacturing PMI (m/m) at 16:30 (GMT+3).
By JustMarkets
This article reflects a personal opinion and should not be interpreted as an investment advice, and/or offer, and/or a persistent request for carrying out financial transactions, and/or a guarantee, and/or a forecast of future events.