
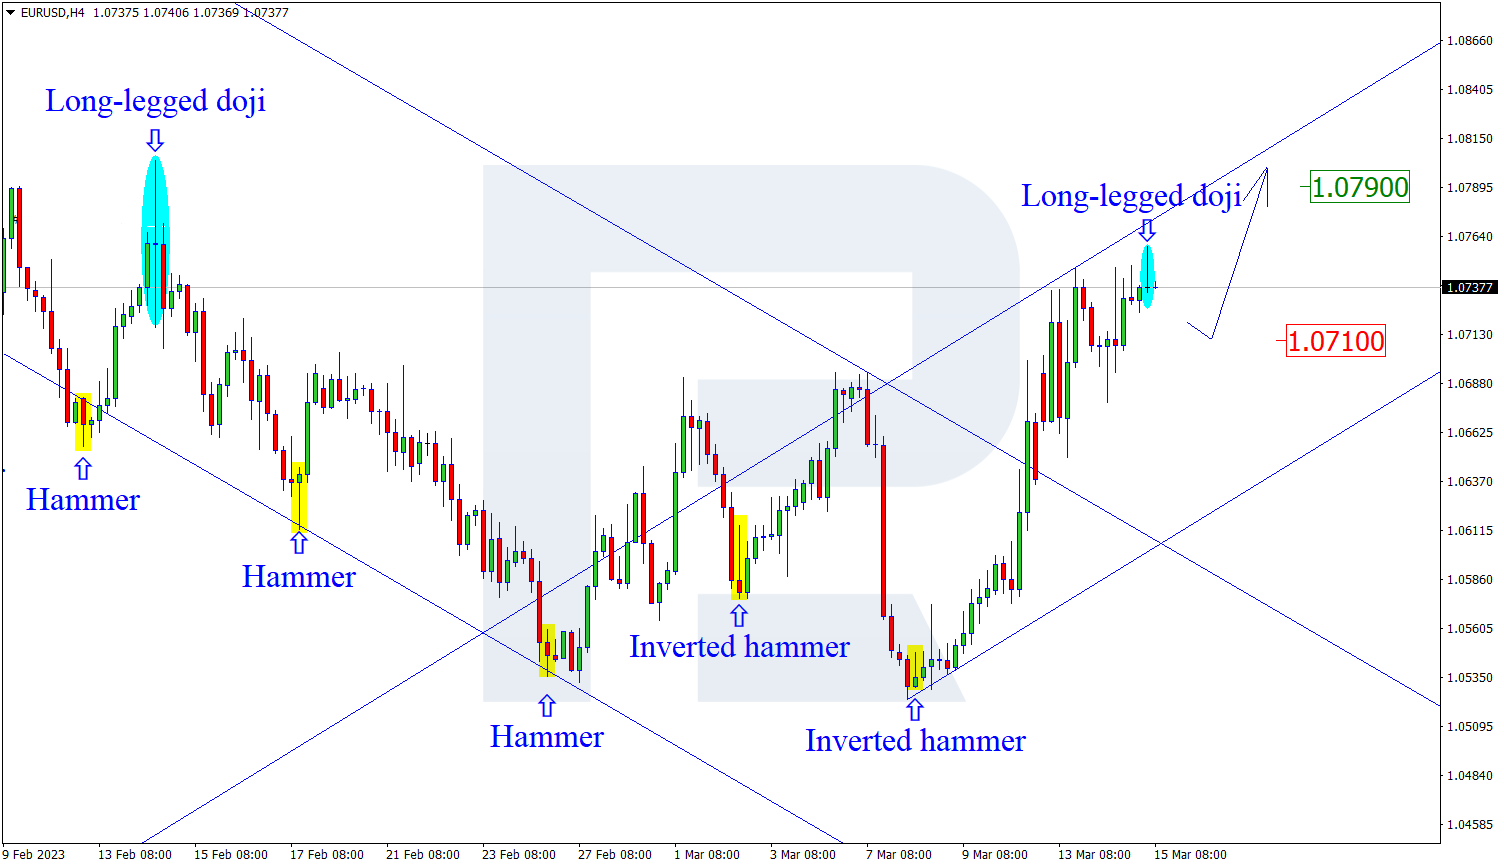
EURUSD, “Euro vs US Dollar”
On H4, EURUSD has formed a reversal pattern of a Long-Legged Doji near the resistance level. At this stage, the signal from the reversal candlestick pattern may trigger a downward wave. The target for the pullback will be 1.0710. However, one should not exclude the variant with price growth to the level of 1.0790 and continuation of the upward trend without a support test.

USDJPY, “US Dollar vs Japanese Yen”
On H4, USDJPY has formed a Inverted Hammer pattern. At this stage, the signal from the reversal candlestick pattern is being worked out in an ascending wave. The target for growth may be the level of 135.90. However, we should not exclude the variant of market situation development with the price rollback to the level of 134.00 and uptrend continuation after support test.
Free Reports:
 Download Our Metatrader 4 Indicators – Put Our Free MetaTrader 4 Custom Indicators on your charts when you join our Weekly Newsletter
 Get our Weekly Commitment of Traders Reports - See where the biggest traders (Hedge Funds and Commercial Hedgers) are positioned in the futures markets on a weekly basis.

EURGBP, “Euro vs Great Britain Pound”
On H4, EURGBP has formed a Inverted Hammer pattern. At this stage, the signal from the candlestick pattern has led to an upward wave. The resistance level of 0.8870 may be the target for the upside. Having tested it and broken through, the price has a chance to continue the upward trend. However, decrease of the price to the level of 0.8815 should not be excluded before the growth.

Article By RoboForex.com
Attention!
Forecasts presented in this section only reflect the author’s private opinion and should not be considered as guidance for trading. RoboForex LP bears no responsibility for trading results based on trading recommendations described in these analytical reviews.

- COT Metals Charts: Weekly Speculator Bets see small gains for Silver & Gold Jul 12, 2026
- COT Bonds Charts: Speculator Bets led by SOFR 3-Months & 2-Year Bonds Jul 12, 2026
- COT Energy Charts: Weekly Speculator Changes led by Brent Oil Jul 12, 2026
- COT Soft Commodities Charts: Weekly Speculator Changes led by Sugar, Corn & Soybeans Jul 12, 2026
- The US and European stock indices are rising again amid renewed investor interest in the AI industry. Jul 10, 2026
- USD/JPY Falls as Yen Recovers Weekly Losses Jul 10, 2026
- Crude oil prices surged sharply by 7% in reaction to the rapid escalation of the conflict in the Middle East Jul 9, 2026
- Middle East Tensions Weigh on Gold Jul 9, 2026
- Pound Awaits Tighter Policy from Bank of England Jul 8, 2026
- The United States carried out airstrikes on Iran after Iran’s attacked tankers in the Strait of Hormuz. The RBNZ raised the interest rate to 2.5% Jul 8, 2026