
By RoboForex Analytical Department
EUR/USD starts a new week of March by consolidating around 1.0670.
This week, investors will be anxious. The key event is the meeting of the US Federal Reserve System, where monetary politicians will have to make difficult decisions, specifically the ones concerning the interest rate. As soon as problematic spots emerged in the US banking sector, the market started discussing the necessity to make a pause in lifting the interest rate to stop the crisis from expanding.
On the other hand, there are appearing more and more arguments supporting the growth of the interest rate. Among them there are the increase in base inflation and the Core PCE inflation index, tracked by the Fed.
Earlier the ECB lifted its rate by 50 base points, dismissing banking problems, and continued tightening the monetary policy. Its main goal is still beating high prices.
By the end of the week, volatility of EUR/USD will have increased noticeably.
Free Reports:
 Get our Weekly Commitment of Traders Reports - See where the biggest traders (Hedge Funds and Commercial Hedgers) are positioned in the futures markets on a weekly basis.
 Download Our Metatrader 4 Indicators – Put Our Free MetaTrader 4 Custom Indicators on your charts when you join our Weekly Newsletter
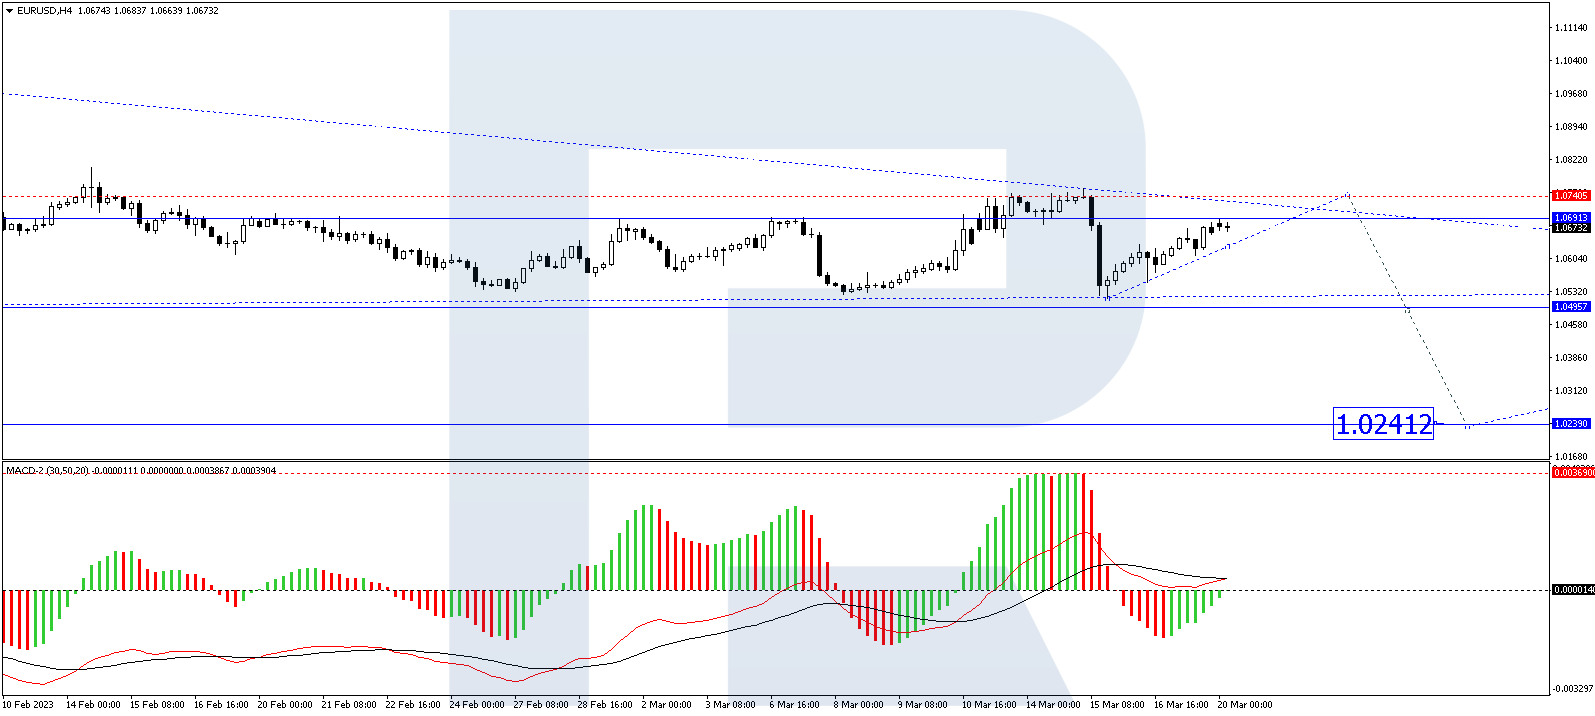
On H4, EUR/USD has formed a correctional structure to 1.0630. At the moment, the market is consolidating around it and with an escape from the range upwards might extend the structure to 1.0708. Then a decline to 1.0630 might follow. And then a link of growth to 1.0742 is not excluded. There the wave of growth will exhaust its potential. Next, the pair should go down by the trend to 1.0505. Technically, this scenario is confirmed by the MACD. Its signal line is above zero and is preparing to renew the highs.
On the H1 chart, EUR/USD has completed a wave of growth to 1.0650. Today the market has already formed a link of decline to 1.0620 and a link of growth to 1.0687. At the moment, a consolidation range is forming under this level. The price might escape it upwards, opening a pathway to 1.0708. Then a decline to 1.0620 and growth to 1.0742 are expected. Upon reaching this level, the price might fall to 1.0600, and if this level breaks, the quotes might drop to 1.0540. Technically, this scenario is confirmed by the Stochastic oscillator. Its signal line is near 50, and later it should fall to 20.

Disclaimer
Any forecasts contained herein are based on the author’s particular opinion. This analysis may not be treated as trading advice. RoboForex bears no responsibility for trading results based on trading recommendations and reviews contained herein.

- COT Metals Charts: Weekly Speculator Bets see small gains for Silver & Gold Jul 12, 2026
- COT Bonds Charts: Speculator Bets led by SOFR 3-Months & 2-Year Bonds Jul 12, 2026
- COT Energy Charts: Weekly Speculator Changes led by Brent Oil Jul 12, 2026
- COT Soft Commodities Charts: Weekly Speculator Changes led by Sugar, Corn & Soybeans Jul 12, 2026
- The US and European stock indices are rising again amid renewed investor interest in the AI industry. Jul 10, 2026
- USD/JPY Falls as Yen Recovers Weekly Losses Jul 10, 2026
- Crude oil prices surged sharply by 7% in reaction to the rapid escalation of the conflict in the Middle East Jul 9, 2026
- Middle East Tensions Weigh on Gold Jul 9, 2026
- Pound Awaits Tighter Policy from Bank of England Jul 8, 2026
- The United States carried out airstrikes on Iran after Iran’s attacked tankers in the Strait of Hormuz. The RBNZ raised the interest rate to 2.5% Jul 8, 2026