Archive for Forex and Currency News – Page 215

Markets gripped by inflation concerns

Lukman Otunuga

By Lukman Otunuga Senior Research Analyst, ForexTime

Asian shares were painted red on Tuesday following a broad selloff on Wall Street overnight, as surging oil prices stoked concerns about global inflation. King dollar drew strength from the risk-off mood while gold prices snapped a three-day uptrend, trading below $1760 as of writing. Interestingly, European markets have opened on a positive note despite the losses witnessed in Asia with US futures inching higher, suggesting Wall Street could claw back losses this afternoon.

Nevertheless, growing worries about inflation are likely to foster a sense of unease and caution across financial markets. Given how consumer prices are already at multi-year highs, persistent signs of rising inflationary pressures may force central banks to tighten policy sooner than expected.

Oil soars as OPEC+ stick to their plan

Oil bulls were on a tear yesterday, pushing prices to levels not seen in three years after OPEC+ decided not to increase their output by more than previously agreed.

This decision was made despite calls from world leaders to bring additional production to the market amid the growing global energy crunch. While the jump in oil prices may be a welcome development for OPEC+, the cartel’s actions threaten to raise tensions between major energy consumers, especially those who are dealing with high inflation.

Regarding the technical picture, oil remains firmly bullish on the daily charts with indicators pointing to further upside. Brent is currently trading around $81.50 with the October 2018 high at $86.71, while WTI is lingering around $78.00 with $80.00 acting as the first level of interest.

Commodity spotlight – Gold

Gold has stumbled into Tuesday’s session under pressure and failing to draw strength from the inflation fears or market caution.

An appreciating dollar is acting as a headwind ahead of the heavily anticipated US jobs report on Friday. Given how gold remains sensitive to taper expectations, we should expect to see increased volatility through the non-farm payrolls data. Friday’s outcome could set the tone for the precious metal this month.

Looking at the technical picture, prices are trading below the 50, 100, and 200-day Simple Moving Average while the MACD trades below zero. A solid daily close below $1750 could signal a decline back towards recent lows at $1721. Should $1750 prove to be reliable support, a move towards $1780 and $1800 could be on the cards.

Disclaimer: The content in this article comprises personal opinions and should not be construed as containing personal and/or other investment advice and/or an offer of and/or solicitation for any transactions in financial instruments and/or a guarantee and/or prediction of future performance. ForexTime (FXTM), its affiliates, agents, directors, officers or employees do not guarantee the accuracy, validity, timeliness or completeness, of any information or data made available and assume no liability as to any loss arising from any investment based on the same.


Forex-Time-LogoArticle by ForexTime

ForexTime Ltd (FXTM) is an award winning international online forex broker regulated by CySEC 185/12 www.forextime.com

Japanese Candlesticks Analysis 04.10.2021 (USDCAD, AUDUSD, USDCHF)

Article By RoboForex.com

USDCAD, “US Dollar vs Canadian Dollar”

As we can see in the H4 chart, after forming several reversal patterns, including Hammer, close to the support level, USDCAD may reverse in the form of a new ascending impulse. In this case, the upside target may be the resistance area at 1.2755. However, an alternative scenario implies that the asset may continue falling to reach 1.2590 without reversing and correcting.

USDCAD
Risk Warning: the result of previous trading operations do not guarantee the same results in the future

AUDUSD, “Australian Dollar vs US Dollar”

As we can see in the H4 chart, AUDUSD has formed several reversal patterns, such as Harami, while testing the resistance level. At the moment, the asset may reverse to complete the correction and resume trading downwards. In this case, the downside target may be at 0.7180. At the same time, an opposite scenario implies that the price may grow towards 0.7300 first and then resume falling.

AUDUSD
Risk Warning: the result of previous trading operations do not guarantee the same results in the future

USDCHF, “US Dollar vs Swiss Franc”

As we can see in the H4 chart, after testing the support area, the pair has formed several reversal patterns, for example, Inverted Hammer. At the moment, USDCHF is reversing and may later start a new growth towards the resistance level. In this case, the upside target may be at 0.9380. Still, there might be an alternative scenario, according to which the asset may correct to reach 0.9270 and then resume its ascending tendency.

USDCHF

Article By RoboForex.com

Attention!
Forecasts presented in this section only reflect the author’s private opinion and should not be considered as guidance for trading. RoboForex LP bears no responsibility for trading results based on trading recommendations described in these analytical reviews.

Ichimoku Cloud Analysis 04.10.2021 (GBPUSD, AUDUSD, USDCAD)

Article By RoboForex.com

GBPUSD, “Great Britain Pound vs US Dollar”

GBPUSD is trading at 1.3547; the instrument is moving below Ichimoku Cloud, thus indicating a descending tendency. The markets could indicate that the price may test Tenkan-Sen and Kijun-Sen at 1.3575 and then resume moving downwards to reach 1.3275. Another signal in favor of a further downtrend will be a rebound from the descending channel’s upside border. However, the bearish scenario may no longer be valid if the price breaks the cloud’s upside border and fixes above 1.3725. In this case, the pair may continue growing towards 1.3815.

GBPUSD
Risk Warning: the result of previous trading operations do not guarantee the same results in the future

AUDUSD, “Australian Dollar vs US Dollar”

AUDUSD is trading at 0.7267; the instrument is moving below Ichimoku Cloud, thus indicating a descending tendency. The markets could indicate that the price may test the cloud’s upside border at 0.7270 and then resume moving downwards to reach 0.7075. Another signal in favor of a further downtrend will be a rebound from the descending channel’s upside border. However, the bearish scenario may no longer be valid if the price breaks the cloud’s upside border and fixes above 0.7335. In this case, the pair may continue growing towards 0.7425.

AUDUSD
Risk Warning: the result of previous trading operations do not guarantee the same results in the future

USDCAD, “US Dollar vs Canadian Dollar”

USDCAD is trading at 1.2625; the instrument is moving below Ichimoku Cloud, thus indicating a descending tendency. The markets could indicate that the price may test the cloud’s downside border at 1.2645 and then resume moving downwards to reach 1.2445. Another signal in favor of a further downtrend will be a rebound from the rising channel’s downside border. However, the bearish scenario may no longer be valid if the price breaks the cloud’s upside border and fixes above 1.2785. In this case, the pair may continue growing towards 1.2875.

USDCAD

Article By RoboForex.com

Attention!
Forecasts presented in this section only reflect the author’s private opinion and should not be considered as guidance for trading. RoboForex LP bears no responsibility for trading results based on trading recommendations described in these analytical reviews.

USDCAD Intermediate Double Zigzag To End Primary Double Zigzag

By Orbex

The formation of the USDCAD currency pair suggests the development of a large bearish double zigzag. Intervening wave x can take the form of a primary double zigzag Ⓦ-Ⓧ-Ⓨ.

To complete this double zigzag, a primary wave Ⓨ is necessary. Most likely, its first two parts have ended, and now the last actionary intermediate sub-wave (Y) is under construction.

The end of this wave could be near 1.303. At that level, wave Ⓨ will be at 76.4% of wave Ⓦ.

USDCAD

An alternative scenario suggests the continuation of the construction of the cycle sub-wave w, or rather its final part, where the minute correction wave was recently completed. It took the form of a double zigzag (w)-(x)-(y).

And then the market began to move in a downward direction, forming the final impulse wave ⓥ.

To confirm this scenario, we need to see a decline in the minuette sub-waves (iii)-(iv)-(v) as shown on the chart.

We can expect the end of the impulse (iii) at the previous low of 1.201. Then, after a slight correction in the sub-wave (iv), the price will continue to decline in the minuette sub-wave (v).


Orbex-LogoArticle by Orbex

Orbex is a fully licensed broker that was established in 2011. Founded with a mission to serve its traders responsibly and provides traders with access to the world’s largest and most liquid financial markets. www.orbex.com

The Analytical Overview of the Main Currency Pairs on 2021.10.04

by JustForex

The EUR/USD currency pair

Technical indicators of the currency pair:
  • Prev Open: 1.1576
  • Prev Close: 1.1593
  • % chg. over the last day: +0.14%

Against the background of a sharp rise in energy prices, inflation in the Eurozone jumped to 3.4%, reaching its highest level in 13 years. Because of the rise in inflation, workers in Germany started to strike and demand higher wages to cover the price increases.

Trading recommendations
  • Support levels: 1.1564, 1.1453
  • Resistance levels: 1.1671, 1.1717, 1.1772, 1.1802, 1.1835

From the technical point of view, the EUR/USD trend is bearish. But the MACD indicator has become inactive. It indicates that the sellers have stopped putting pressure. Under such market conditions, traders should consider sell deals from the resistance levels near the moving average, as the price has deviated from the middle line. Buy trades should be considered only from the support levels with additional confirmation in the form of a buyers’ initiative.

Alternative scenario: if the price breaks out through the 1.1717 resistance level and fixes above, the mid-term uptrend will likely resume.

EUR/USD
There is no news feed for today.

The GBP/USD currency pair

Technical indicators of the currency pair:
  • Prev Open: 1.3472
  • Prev Close: 1.3543
  • % chg. over the last day: +0.53%

In the UK, the manufacturing PMI index unexpectedly increased to 57.1 value (previously 56.3). The UK plans to resume fuel deliveries across the country starting from Monday. Leaders in Scotland, Wales and Northern Ireland have asked the government not to cut the social benefits. This program involves paying £20 a week to about 5.5 million families.

Trading recommendations
  • Support levels: 1.3525, 1.3457, 1.3360, 1.3282
  • Resistance levels: 1.3617, 1.3685, 1.3759, 1.3812, 1.3886

On the hourly time frame, the GBP/USD trend is bearish. But the British currency sharply strengthened on Friday. The MACD indicator has become positive. Buy trades should be considered only throughout the day and only with short targets from the support levels after the buyer’s initiative. Sell trades can be found at the resistance levels near the moving average line.

Alternative scenario: if the price breaks out through the 1.3759 resistance level and consolidates above, the bullish scenario will likely resume.

GBP/USD
There is no news feed for today.

The USD/JPY currency pair

Technical indicators of the currency pair:
  • Prev Open: 111.24
  • Prev Close: 111.06
  • % chg. over the last day: -0.16%

Amid the ongoing economic recovery, the Tankan Index, which measures confidence in Japan’s economy among large companies, increased to its highest level in almost three years in July-September.

Trading recommendations
  • Support levels: 110.65, 110.40, 109.95, 109.63, 109.27
  • Resistance levels: 111.62, 112.19

The main trend of the USD/JPY currency pair is bullish. The MACD indicator became negative, but there are signs of divergence. Under such market conditions, it’s better to look for buy positions from the support levels near the moving average. Sell positions should be considered only throughout the day from the resistance levels, given there is sellers’ initiative.

Alternative scenario: if the price falls below 110.45, the uptrend is likely to be broken.

USD/JPY
There is no news feed for today.

The USD/CAD currency pair

Technical indicators of the currency pair:
  • Prev Open: 1.2677
  • Prev Close: 1.2645
  • % chg. over the last day: -0.25%

The Canadian dollar is a commodity currency, so USD/CAD is highly dependent on the dynamics of the dollar index and oil prices. The dollar index remained at the same level on Friday while oil prices increased. As a result, the USD/CAD quotes decreased due to the strengthening of the Canadian currency. Canada’s GDP fell by 0.1% in July. Growth is expected in August.

Trading recommendations
  • Support levels: 1.2611, 1.2565, 1.2518, 1.2425
  • Resistance levels: 1.2729, 1.2774, 1.2891

From the technical point of view, the trend of the USD/CAD currency pair is bearish. The MACD indicator has become negative, and there are signs of sellers’ pressure. Under such market conditions, it is better to look for sell deals from the resistance levels after the seller’s initiative in the form of impulse movement. Buy trades should be considered from the support levels, but only with short targets.

Alternative scenario: if the price breaks out through the 1.2774 resistance level and fixes above, the uptrend will likely resume.

USD/CAD
News feed for 2021.10.04:
  • – OPEC+ Meeting at 13:00 (GMT+3).

by JustForex


This article reflects a personal opinion and should not be interpreted as an investment advice, and/or offer, and/or a persistent request for carrying out financial transactions, and/or a guarantee, and/or a forecast of future events.

The US dollar has marked significant appreciation

By Admiral Markets

The world’s reserve currency was on a strong uptrend last week, reaching its highest level since September 2020. Investors were active buyers of the US dollar when the country’s equity indices corrected and the S&P500 was briefly down more than -6% on Friday from its all-time high reached the beginning of September.

USD

US economic data remained good and strong and pointed to continued positive sentiment among the population and businesses. The ISM purchasing managers’ index for the manufacturing sector stood at 61.1 points, up moderately from the previous month’s reading of 59.9. The country’s consumer price index (PCE) showed a 4.3% annual increase in August, pointing to continued price growth in the economy. The consumer confidence Index stood at 109.3 points and fell for the 4th consecutive month. Meanwhile, the real estate market remains strong and active and the house price index was 19.2% higher than in the same period a year ago, which is likely to contribute to high inflation rates in the coming months. The number of new jobless claims continued to rise from 0.351 million to 0.362 million during the week.

The global trend showed a further slowdown, with the weekly average of new cases falling from 482 to 434 thousand per day. North America and Asia continued to see a decline in the number of cases, while Europe stood out and showed an increase of around 8% per week. Only in the US did the data point to an emerging wave of cases, with the average dropping from 122 to 98 thousand per day. The number of vaccines administered increased from 389 to 395 million, with a change of 6 million, mainly due to the third dose. Overall in the US, the number of people vaccinated with at least one dose rose from 64.1% to 64.7% of the population, with a weekly increase of 0.6%. In Lithuania, the number of people vaccinated with at least one dose rose from 62.0% to 62.7%, a difference of 0.7%.

EUR

The main currency pair EUR/USD mirrored the trend of the US dollar and temporarily depreciated in the second half of the week to the level of 1.157, the lowest level since July 2020. Economic data on the Old Continent included the actual manufacturing purchasing managers’ indices, which stood at 58.4 points in Germany and 58.6 in Europe, both pointing to further growth. Germany’s preliminary September annual inflation rate was 4.1%, up from 3.9% in the previous month, while the country’s retail sales were 1.1% higher than a year earlier. Europe’s preliminary annual inflation rate was 3.4%. German labour market data showed positive trends, with the number of unemployed declining by 30 thousand in September and the unemployment rate at 5.5%. The EUR/USD pair ended the week’s trading down -1.1%.

JPY

The most important Asian pair USD/JPY appreciated in the first half of the week and reached the level of 112.0, but later depreciated to 111.0 points. The data included August industrial production, which showed a 9.3% year-on-year rise, and retail sales, which were -3.2% lower than a year earlier. The actual purchasing managers’ index was 51.5 points. USD/JPY ended the week trading up 0.3%.

GBP

The British pound/US dollar pair moved in tandem with the currency market and was briefly depreciated to the level of 1.342 on Wednesday. No important economic data were released. GBP/USD ended the week’s trading down -1.0%.

Economic Events

This week will start quietly and no important data is scheduled for Monday. On Tuesday, the actual purchasing managers’ indexes for the service sector will be released and US international trade data will be expected. On Wednesday, European retail sales will be watched, Thursday will be quite quiet, but on Friday investors will be focused on the US labour market indicators.

According to Admiral Markets market sentiment data, 81% of investors have long positions in the EUR/USD pair (up +11 percentage points compared to last week). In the main Asian pair USD/JPY, 24% of investors have long positions (up +15 percentage points). In GBP/USD, 56% of participants expect a rise (down -12 percentage points). Such market data is interpreted as a contrarian indicator, and therefore EUR/USD and GBP/USD are expected to fall, while USD/JPY is expected to appreciate. The analysis of positioning data should be combined with fundamental projections and technical analysis.

Source: bloomberg.com, reuters.com, Admiral Markets MT4 Supreme Edition, investing.com


Trade With MetaTrader 5

INFORMATION ABOUT ANALYTICAL MATERIALS

The given data provides additional information regarding all analysis, estimates, prognosis, forecasts, market reviews, weekly outlooks or other similar assessments or information (hereinafter “Analysis”) published on the websites of Admiral Markets investment firms operating under the Admiral Markets trademark (hereinafter “Admiral Markets”) Before making any investment decisions please pay close attention to the following: 

  • This is a marketing communication. The content is published for informative purposes only and is in no way to be construed as investment advice or recommendation. It has not been prepared in accordance with legal requirements designed to promote the independence of investment research, and that it is not subject to any prohibition on dealing ahead of the dissemination of investment research. 
  • Any investment decision is made by each client alone whereas Admiral Markets shall not be responsible for any loss or damage arising from any such decision, whether or not based on the content. 
  • With view to protecting the interests of our clients and the objectivity of the Analysis, Admiral Markets has established relevant internal procedures for prevention and management of conflicts of interest. 
  • The Analysis is prepared by an independent analyst, Skirmantas Paulavicius (analyst), (hereinafter “Author”) based on their personal estimations. 
  • Whilst every reasonable effort is taken to ensure that all sources of the content are reliable and that all information is presented, as much as possible, in an understandable, timely, precise and complete manner, Admiral Markets does not guarantee the accuracy or completeness of any information contained within the Analysis. 
  • Any kind of past or modeled performance of financial instruments indicated within the content should not be construed as an express or implied promise, guarantee or implication by Admiral Markets for any future performance. The value of the financial instrument may both increase and decrease and the preservation of the asset value is not guaranteed. 
  • Leveraged products (including contracts for difference) are speculative in nature and may result in losses or profit. Before you start trading, please ensure that you fully understand the risks involved.
Avatar-Admirals
Admirals An all-in-one solution for spending, investing, and managing your moneyMore than a broker, Admirals is a financial hub, offering a wide range of financial products and services. We make it possible to approach personal finance through an all-in-one solution for investing, spending, and managing money.

By Admiral Markets

Intraday Market Analysis – USD Rally Slows Down

By Orbex

USDCAD awaits breakout

USDCAD

The Canadian dollar recovered after July’s GDP growth beat expectations.

The daily chart still favors the greenback even though the hourly price action is stuck in a narrowing range between 1.2600 and 1.2800. The indecision would end with a breakout that will dictate the direction for the next few days.

Multiple tests of the demand zone around 1.2600 suggest solid interest in keeping the uptrend intact. A bullish breakout would cause another attempt at August’s peak (1.2950), whereas a bearish one would lead to a revisit of 1.2500.

EURGBP tests demand zone

EURGBP

The pound swings higher likely due to profit-taking, following a sharp sell-off. The euro’s surge has hit a speed bump at July’s high (0.8660).

An overbought RSI and its bearish divergence have prompted short-term buyers to take chips off the table. The support-turned-resistance at 0.8620 capped a rebound.

The upside bias is still valid as long as the pair is above 0.8525, the base of the latest rally. The bulls may trigger an extended rally if they can lift 0.8625. Failing that, the price may drop to 0.8485.

SPX 500 faces key hurdle

SPX500

The S&P 500 struggles as concerns over economic slowdown spread. A bearish MA cross on the daily chart indicates that sentiment has turned sour.

The fall below 4340 has shattered the hope of a quick rebound. The index is testing last July’s low at 4270. A repeatedly oversold RSI has triggered a buying-the-dips mentality.

The early bulls will need to close above 4400 before they could attract momentum buyers’ attention. Otherwise, the bears would be eager to sell into strength.


Orbex-LogoArticle by Orbex

Orbex is a fully licensed broker that was established in 2011. Founded with a mission to serve its traders responsibly and provides traders with access to the world’s largest and most liquid financial markets. www.orbex.com

US Dollar On Plan, Attended By Gold/Silver Ratio

By Ino.com

– US dollar (DXY) has activated its Inverted H&S, Gold/Silver maintains its uptrend, watch silver going forward…

I do not make predictions because I do not pretend to be a guru.* But NFTRH has been tracking what has been an uptrend in the US dollar for all of 2021, keeping us well aware of the potentials being realized from late summer into the fall. A higher low was made in May and now a higher high, completing an Inverted Head & Shoulders pattern that we’ve been projecting since USD put in the theoretical right side shoulder last spring.

Until recently it was a projection. Now it is active after testing the (dashed) neckline, holding the (blue) 50-day average and busting to a new high for the cycle. Simple, no predictions but a heck of a lot of attention and respect for the process.

You can see the three targets we’ve had laid out for the world’s reserve currency, which has logically caused market stress of late. It’s as simple as ‘you live (pump markets) by devaluing the currency, you die (markets correct) when it rebels. Now if the rebellion does not become something more than moderate and should end at target #1, we’ll probably go back to our regularly scheduled programming of pervasive inflation problems on the macro.

As you can see, the three targets are Fibonacci retrace levels. All doable depending on how aggressively risk goes off and man and machine seek liquidity (as opposed to market speculation) in the near term. Of note, the pattern itself has a theoretical measured target of 97. Again, not a prediction but now that the pattern is active a viable objective.

us dollar (dxy)

And speaking of liquidity, the issue is compounded when USD’s fellow Horseman (of the Apocalypse) is riding alongside.

Dollar

The Gold/Silver ratio (GSR) has been in an uptrend of its own in 2021. When they ride together the implication is a weakening liquidity spigot for the markets. The rallies got going as we projected a cool down in the inflation trades back in the spring and to this moment they persist. Silver has more cyclical and inflation-sensitive characteristics than gold and hence, the interplay between the two is an early warning system about the forward state of the macro from an inflationary/deflationary standpoint and all points in between (hello Goldilocks).

Gold/Silver rising means market liquidity pressure. Silver/Gold rising means cyclical inflationary pressure rising. The process has been in play for months now and it may be culminating, with the next phase of inflation at the ready to morph Stagflationary. But until USD and GSR abort their uptrends the global macro is not out of the woods.

It’s a classic play, here in spooky season (September into October-November) to see the herds scatter due to fears of liquidity loss. But then comes what’s next, and it will not be what the herds think in the short-term. They’ll be too busy doing what they think is right, which is rushing for safety; rushing for liquidity; rushing for US dollars (the better part of a year after the rally actually began)! But the herd is the herd for a reason, eh?

As a hint, watch silver. We have our downside targets amid what is becoming a positive contrary sentiment (and CoT) backdrop for gold’s wild little brother. Nothing is predictable, but it sure is manageable and thus far that management is guiding us correctly. Why, even the Fed is playing ball in its newly donned hawk suit. At pivotal times in markets it pays to watch your assumptions and to think ahead. For example, as pertains to the Fed (and Yellen in the side car)…

* Plenty of people pretend to be gurus, but there actually is no such thing. There are hard and forthright workers and there are big marketing machines (cough cough, Casey… cough cough, Dent… cough cough, Stansberry… cough, cough, a multitude of others…).

Check back to see my next post!

Best,
Gary Tanashian

Now offering a 2 week free trial to the NFTRH Premium service with no obligation whatsoever. Sign up by PayPal, enjoy 2 free weeks of on-point market management and if it is not for you, cancel at any time with no further obligation. When you find that it is for you, stay on for as long as you like, and let’s manage and take advantage in a cold and rational way as we head toward 2022 and its new macro challenges. 1st time subscribers only, please.

For “best of breed” top-down analysis of all major markets, subscribe to NFTRH Premium, which includes an in-depth weekly market report, detailed market updates, and NFTRH+ dynamic updates and chart/trade setup ideas. Subscribe by PayPal or credit card using a button on the right sidebar (if using a mobile device you may need to scroll down). Keep up to date with actionable public content at NFTRH.com by using the email form on the right sidebar. Follow via Twitter @NFTRHgt.

By Ino.com – See our Trader Blog, INO TV Free & Market Analysis Alerts

Source: US Dollar On Plan, Attended By Gold/Silver Ratio

Week In Review: King Dollar, Bond Market Action, PCE Inflation Rises

Lukman Otunuga

By Lukman Otunuga Senior Research Analyst, ForexTime

It was an intense week defined by speeches from numerous central bankers’, including testimonies from both Federal Reserve Chair Jerome Powell and Treasury secretary Janet Yellen.

Monday kicked off on a cautious note as Evergrande’s silence over a missed interest rate payment left investors on edge. Fears over further waves of coronavirus outbreaks in Asia compounded to the negative mood, leaving little room for equity bulls to stomp their feet. In the currency markets, the Euro weakened against most majors after European Central Bank (ECB) President Christine Lagarde struck a dovish tone during her speech.

Our trade of the week was none other than Brent crude which jumped to a new year-to-date high. Oil bulls drew ample strength from the global energy crunch while disruptions to crude production from Hurricane Ida last month complemented upside gains.

On Tuesday, it was all about the movements in the bond markets. 10-year treasury yields hit their highest level since June, sparked by fears over rising inflation while the shorter end five-year yield touched levels not seen since February 2020.

Stock markets were beaten black and blue on Tuesday, with equities suffering their biggest fall since May thanks to a spike in US Treasury yields. The S&P500 collapsed like a house of cards, breaking below its 50-day simple moving average for the second time in September.

In the currency markets, the mighty dollar pushed higher – helped by rising yields with the Dollar Index (DXY) striking a fresh year-to-date high beyond 93.72. As the week progressesd, prices jumped as high as 94.52 before later pulling back.

Fed Chairman Jerome Powell and Treasury Secretary Janet Yellen testified before the Senate on Tuesday evening. On the data front, US consumer confidence unexpectedly fell to a seven-month low as the surge in coronavirus cases intensified fears about the economy’s near-term outlook.

Mid-week, our technical outlook focused on the movers & shakers with the dollar, pound, natural gas among many other assets under the spotlight. Interestingly, we were heavily bearish on the EURUSD with 1.16 acting as the first level of interest for bears. After dipping as low as 1.1562, the currency pair is lingering around 1.16 as of writing.

A sense of calm returned to financial markets on Thursday following the heavy selloff witnessed earlier in the week. One of the biggest takeaways from rout in the bond and equity space was how sensitive markets remained to rate hike expectations and inflation. In the currency space, the dollar index hit a fresh one-year while gold fought back after falling victim to rising treasury yields, taper expectations and prospects of higher interest rates.

On the political front, President Joe Biden signed a stopgap bill passed earlier by Congress to avert a government shutdown. Despite this encouraging development, the mood across markets was negative on Friday amid fears of high inflation, slowing global growth and rising interest rates. Although European stocks tumbled to a two-month low, stocks were mostly higher on Wallstreet.

In other news, the PCE index climbed 4.3% year-over-year in August, its highest level since 1991. The core PCE which is the Fed’s favoured measure of inflation remained unchanged at 3.6%. The strong figures may reinforce expectations over the Federal Reserve winding down its emergency economic stimulus.

Disclaimer: The content in this article comprises personal opinions and should not be construed as containing personal and/or other investment advice and/or an offer of and/or solicitation for any transactions in financial instruments and/or a guarantee and/or prediction of future performance. ForexTime (FXTM), its affiliates, agents, directors, officers or employees do not guarantee the accuracy, validity, timeliness or completeness, of any information or data made available and assume no liability as to any loss arising from any investment based on the same.


Forex-Time-LogoArticle by ForexTime

ForexTime Ltd (FXTM) is an award winning international online forex broker regulated by CySEC 185/12 www.forextime.com

COT Currencies: US Dollar Speculators boost bullish bets higher for 14th time in 15 weeks

By InvestMacro.com COT Home | Data Tables | Data Downloads | Newsletter

Here are the latest charts and statistics for the Commitment of Traders (COT) data published by the Commodities Futures Trading Commission (CFTC).

The latest COT data is updated through Tuesday September 28th 2021 and shows a quick view of how large traders (for-profit speculators and commercial entities) were positioned in the futures markets. All currency positions are in direct relation to the US dollar where, for example, a bet for the euro is a bet that the euro will rise versus the dollar while a bet against the euro will be a bet that the euro will decline versus the dollar.

Speculative positions in the US Dollar Index have now risen to a 98-week high at over +26,000 net contracts this week. The dollar speculative bets have increased for six consecutive weeks and for fourteen out of the past fifteen week. The last time bullish bets were this high was November 12th of 2019 when positions totaled of +27,784 contracts.


US Dollar Index Futures:

Federal Funds 30-Day Bonds Futures COT Chart
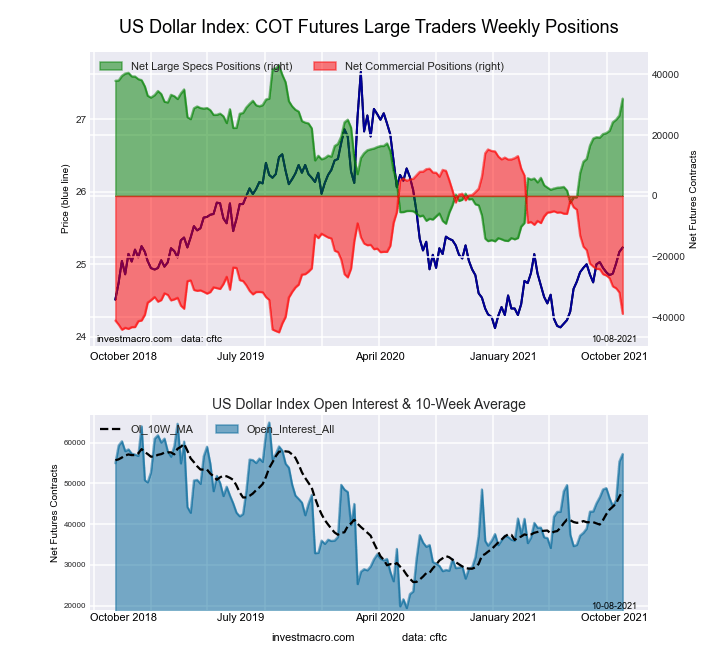
The US Dollar Index large speculator standing this week equaled a net position of 26,461 contracts in the data reported through Tuesday. This was a weekly gain of 1,361 contracts from the previous week which had a total of 25,100 net contracts.

This week’s current strength score (the trader positioning range over the past three years, measured from 0 to 100) shows the speculators are currently Bullish with a score of 71.4 percent. The commercials are Bearish with a score of 21.8 percent and the small traders (not shown in chart) are Bullish-Extreme with a score of 94.4 percent.

US DOLLAR INDEX StatisticsSPECULATORSCOMMERCIALSSMALL TRADERS
– Percent of Open Interest Longs:81.42.812.9
– Percent of Open Interest Shorts:33.660.33.3
– Net Position:26,461-31,7725,311
– Gross Longs:45,0541,5657,110
– Gross Shorts:18,59333,3371,799
– Long to Short Ratio:2.4 to 10.0 to 14.0 to 1
NET POSITION TREND:
– COT Index Score (3 Year Range Pct):71.421.894.4
– COT Index Reading (3 Year Range):BullishBearishBullish-Extreme
NET POSITION MOVEMENT INDEX:
– 6-Week Change in Strength Index:12.5-12.86.0


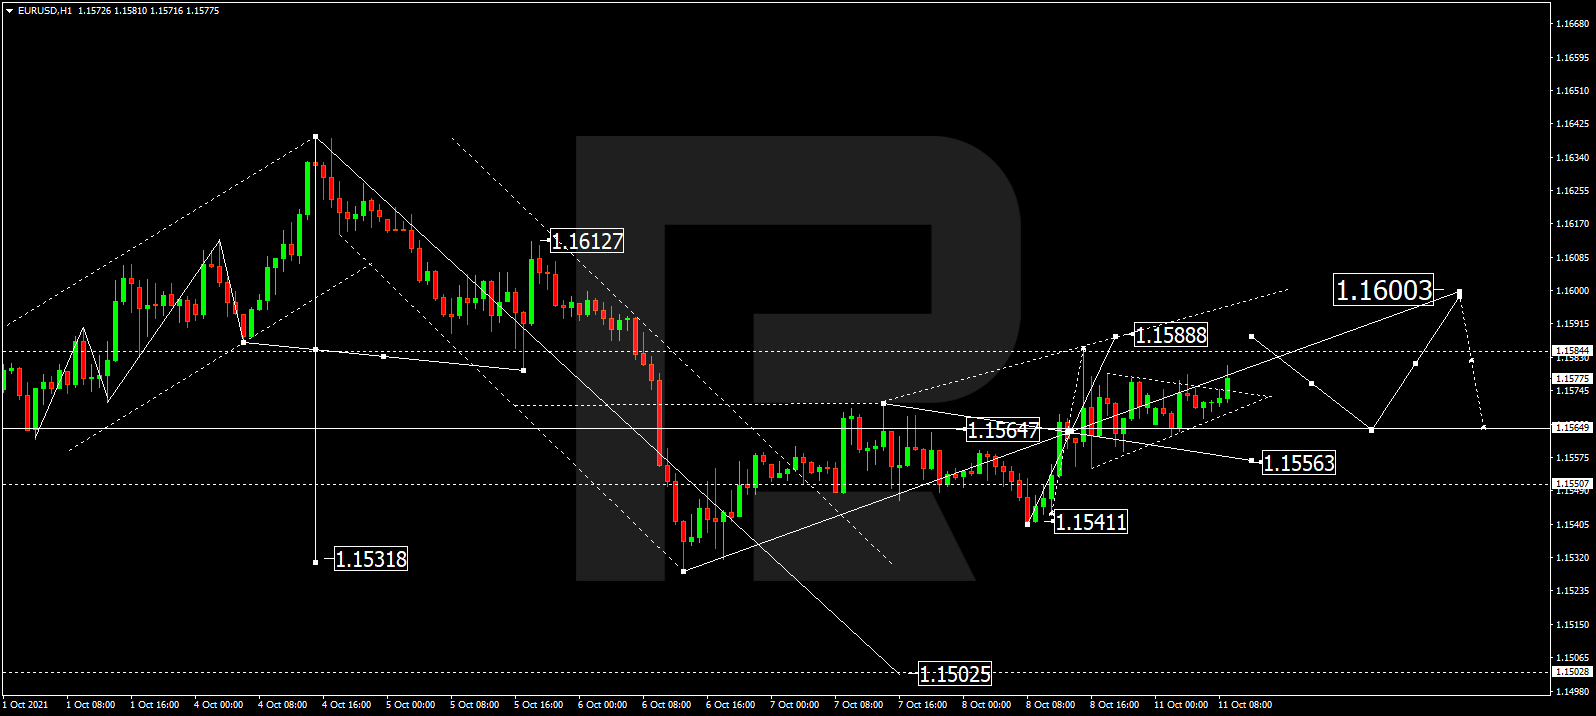
Euro Currency Futures:

2-Year Treasury Bonds Futures COT Chart
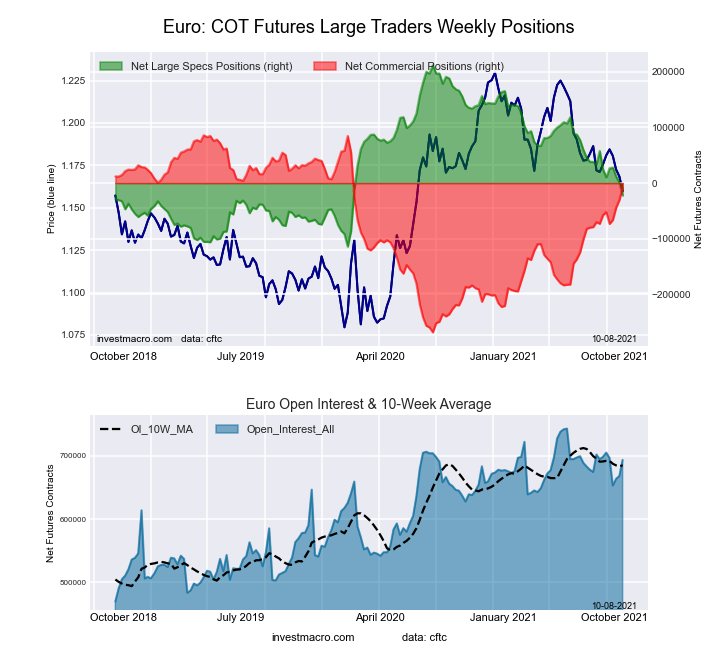
The Euro Currency large speculator standing this week equaled a net position of 872 contracts in the data reported through Tuesday. This was a weekly decrease of -11,223 contracts from the previous week which had a total of 12,095 net contracts.

This week’s current strength score (the trader positioning range over the past three years, measured from 0 to 100) shows the speculators are currently Bearish with a score of 35.3 percent. The commercials are Bullish with a score of 67.1 percent and the small traders (not shown in chart) are Bearish with a score of 26.8 percent.

EURO Currency StatisticsSPECULATORSCOMMERCIALSSMALL TRADERS
– Percent of Open Interest Longs:29.256.713.0
– Percent of Open Interest Shorts:29.161.28.6
– Net Position:872-30,42429,552
– Gross Longs:195,043378,47687,150
– Gross Shorts:194,171408,90057,598
– Long to Short Ratio:1.0 to 10.9 to 11.5 to 1
NET POSITION TREND:
– COT Index Score (3 Year Range Pct):35.367.126.8
– COT Index Reading (3 Year Range):BearishBullishBearish
NET POSITION MOVEMENT INDEX:
– 6-Week Change in Strength Index:-17.412.122.3


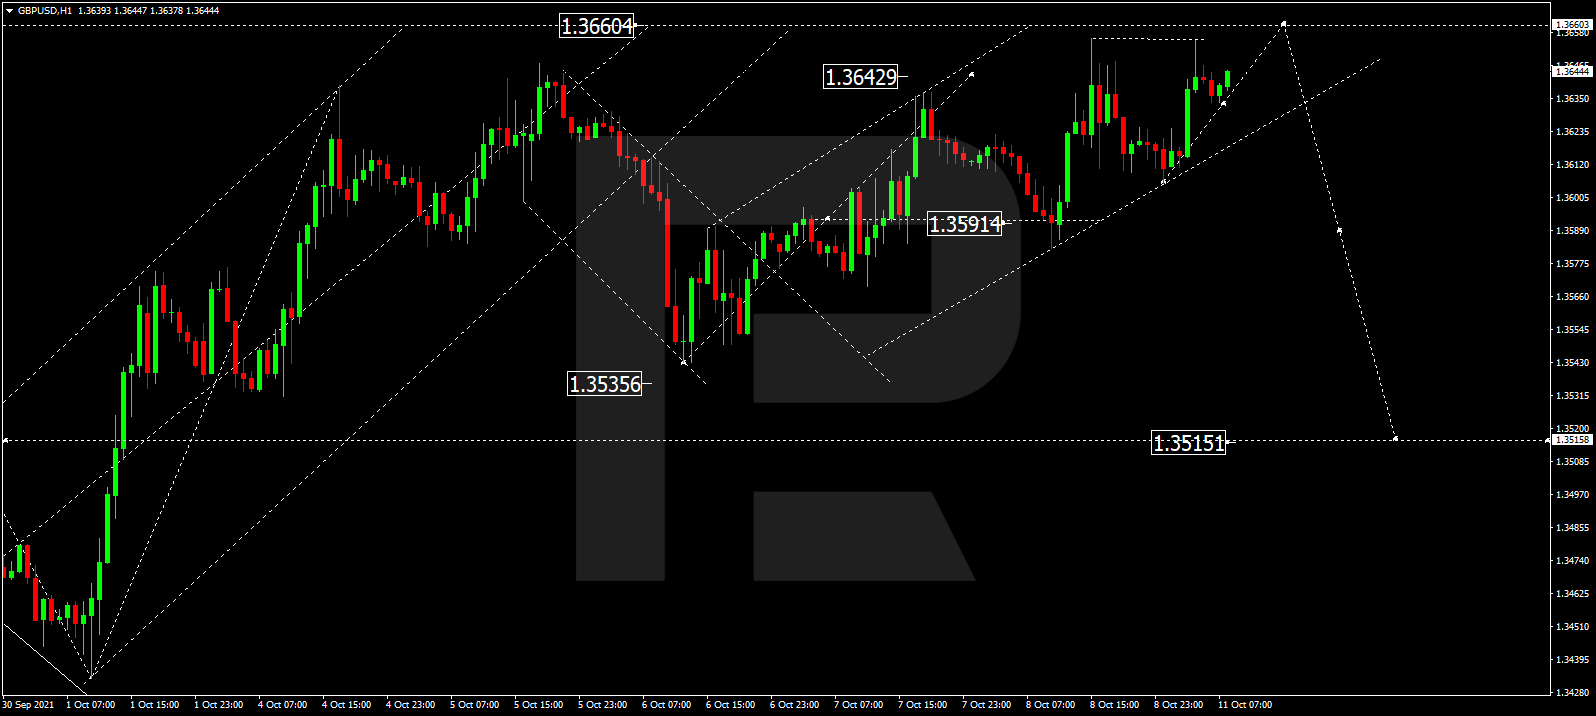
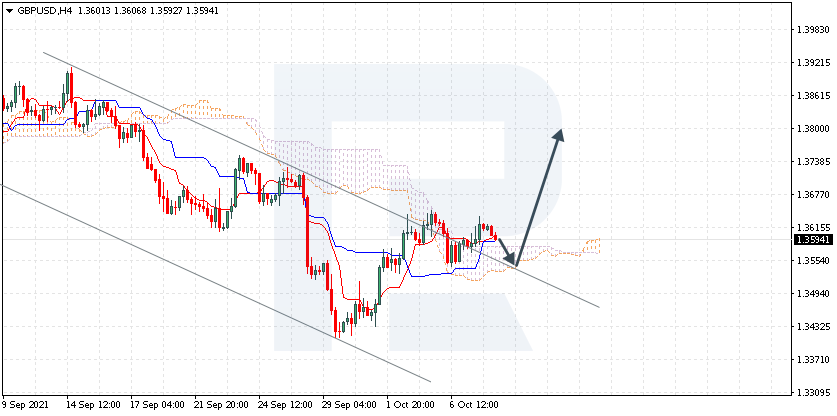
British Pound Sterling Futures:

5-Year Treasury Bonds Futures COT Chart
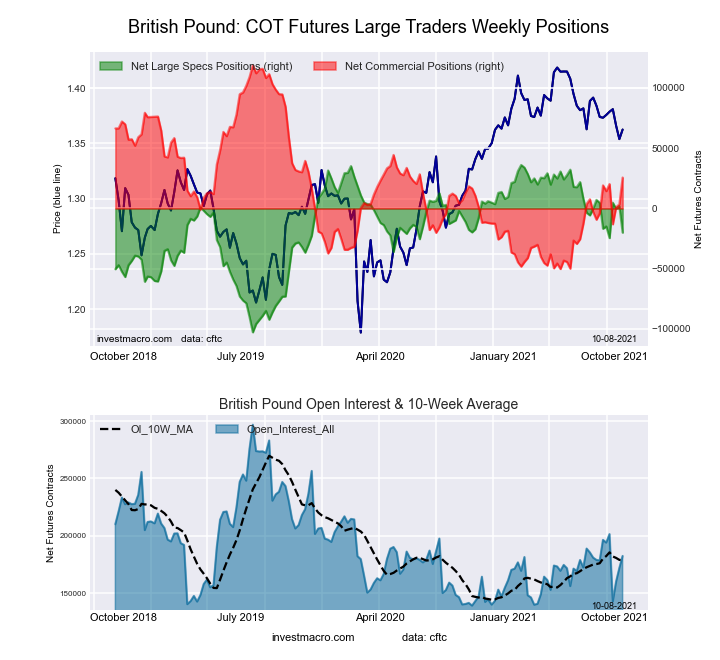
The British Pound Sterling large speculator standing this week equaled a net position of 1,964 contracts in the data reported through Tuesday. This was a weekly lift of 2,182 contracts from the previous week which had a total of -218 net contracts.

This week’s current strength score (the trader positioning range over the past three years, measured from 0 to 100) shows the speculators are currently Bullish with a score of 75.4 percent. The commercials are Bearish with a score of 31.7 percent and the small traders (not shown in chart) are Bearish with a score of 44.5 percent.

BRITISH POUND StatisticsSPECULATORSCOMMERCIALSSMALL TRADERS
– Percent of Open Interest Longs:33.748.615.7
– Percent of Open Interest Shorts:32.646.618.8
– Net Position:1,9643,411-5,375
– Gross Longs:57,92383,47126,971
– Gross Shorts:55,95980,06032,346
– Long to Short Ratio:1.0 to 11.0 to 10.8 to 1
NET POSITION TREND:
– COT Index Score (3 Year Range Pct):75.431.744.5
– COT Index Reading (3 Year Range):BullishBearishBearish
NET POSITION MOVEMENT INDEX:
– 6-Week Change in Strength Index:-1.94.4-9.9


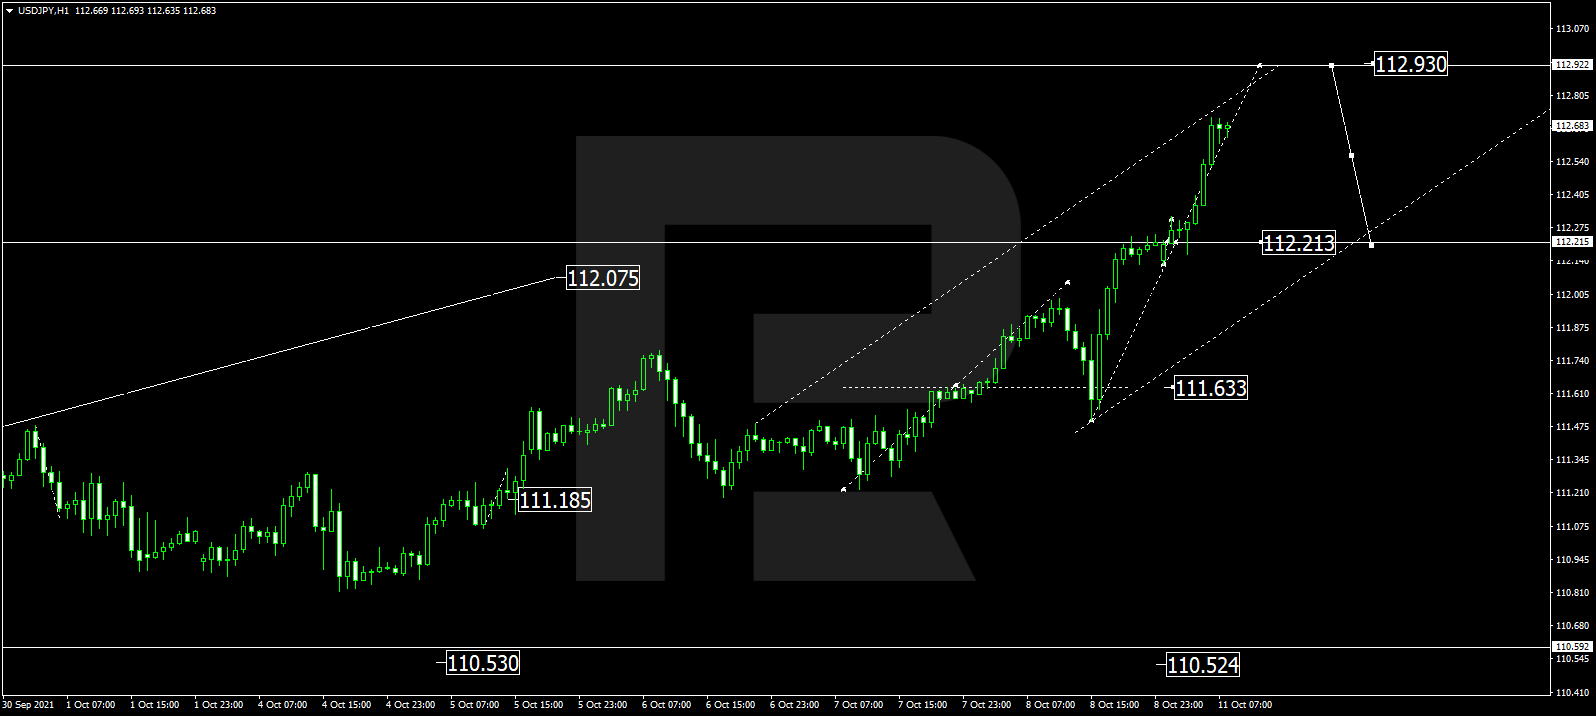
Japanese Yen Futures:

10-Year Treasury Notes Bonds Futures COT Chart
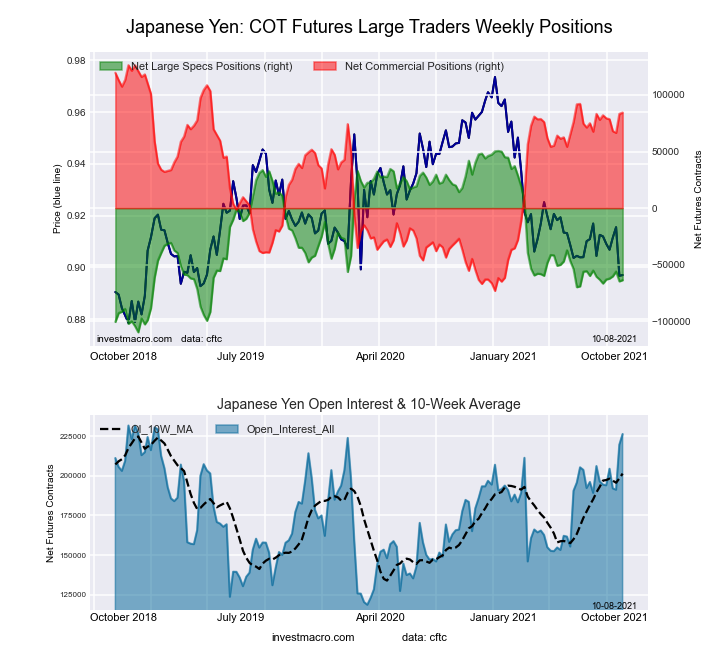
The Japanese Yen large speculator standing this week equaled a net position of -64,760 contracts in the data reported through Tuesday. This was a weekly fall of -8,689 contracts from the previous week which had a total of -56,071 net contracts.

This week’s current strength score (the trader positioning range over the past three years, measured from 0 to 100) shows the speculators are currently Bearish with a score of 30.4 percent. The commercials are Bullish with a score of 74.0 percent and the small traders (not shown in chart) are Bearish-Extreme with a score of 12.3 percent.

JAPANESE YEN StatisticsSPECULATORSCOMMERCIALSSMALL TRADERS
– Percent of Open Interest Longs:16.175.28.1
– Percent of Open Interest Shorts:45.637.316.5
– Net Position:-64,76083,279-18,519
– Gross Longs:35,328165,24617,806
– Gross Shorts:100,08881,96736,325
– Long to Short Ratio:0.4 to 12.0 to 10.5 to 1
NET POSITION TREND:
– COT Index Score (3 Year Range Pct):30.474.012.3
– COT Index Reading (3 Year Range):BearishBullishBearish-Extreme
NET POSITION MOVEMENT INDEX:
– 6-Week Change in Strength Index:-0.92.5-7.7


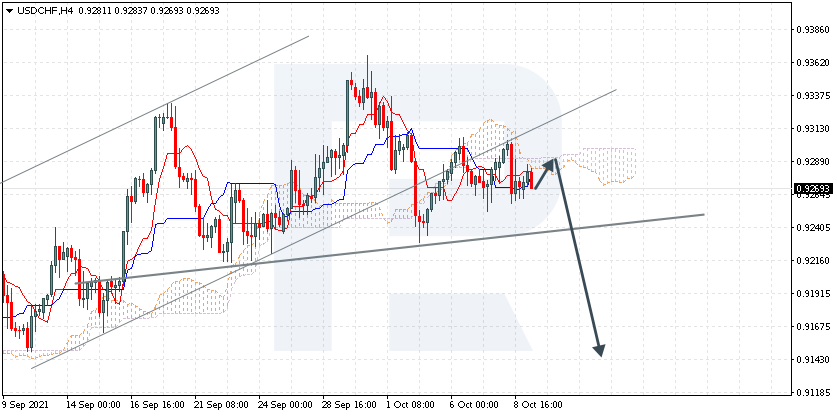
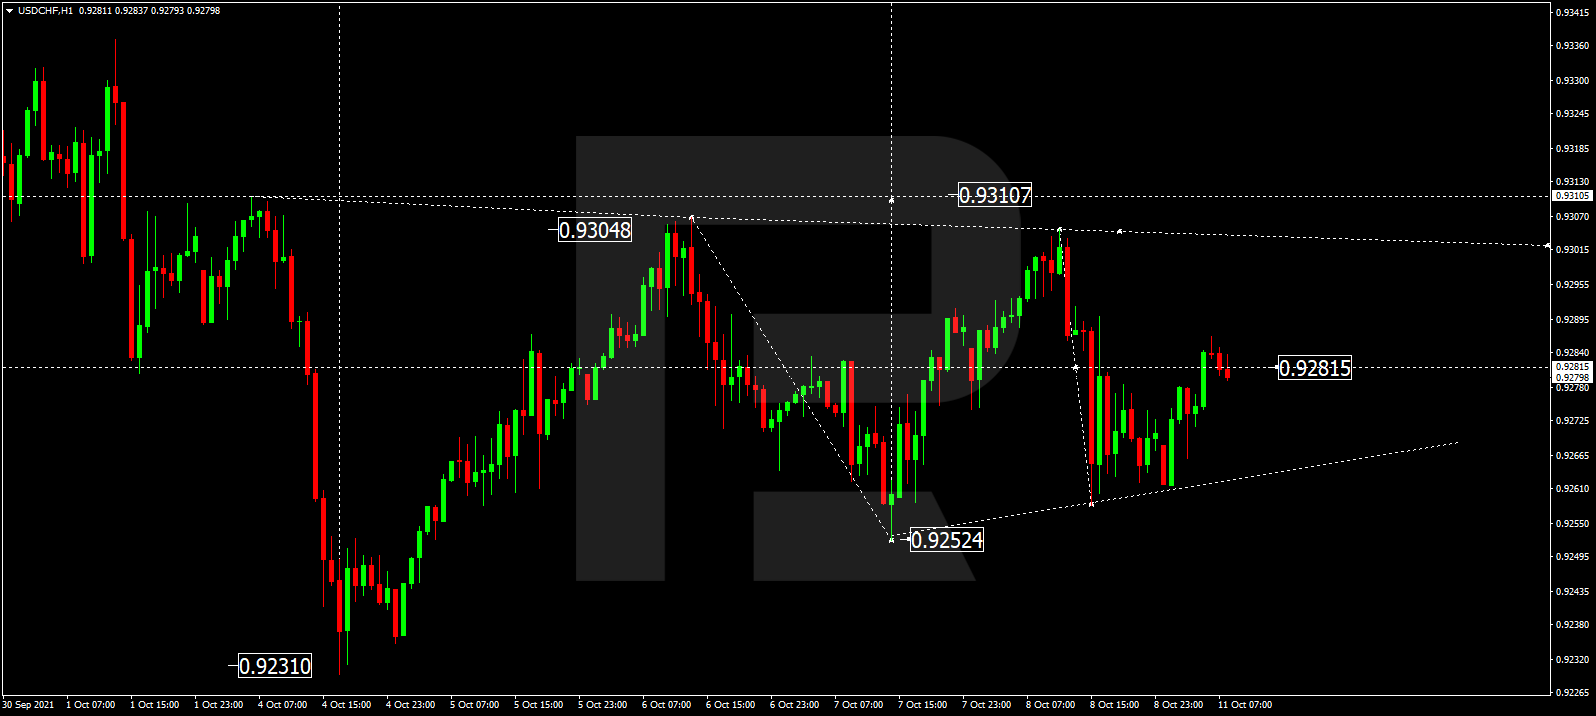
Swiss Franc Futures:

Ultra 10-Year Treasury Notes Bonds Futures COT Chart
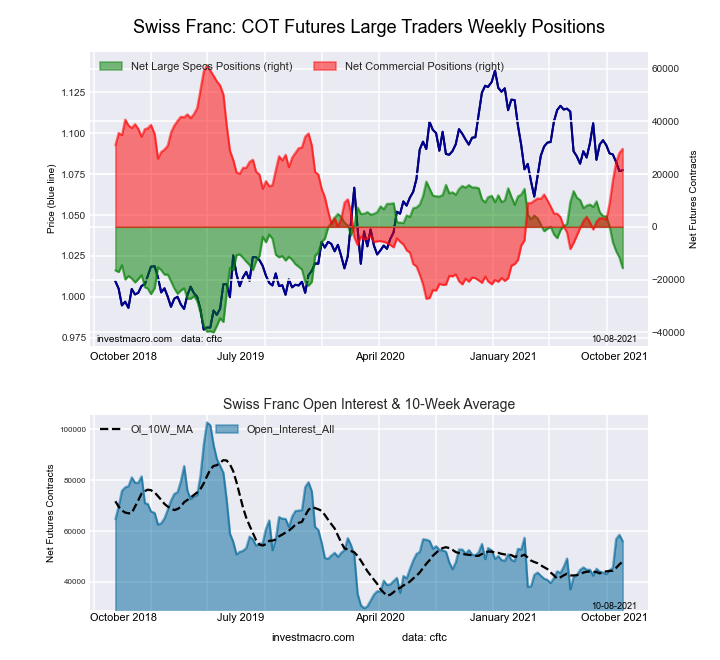
The Swiss Franc large speculator standing this week equaled a net position of -11,587 contracts in the data reported through Tuesday. This was a weekly reduction of -2,370 contracts from the previous week which had a total of -9,217 net contracts.

This week’s current strength score (the trader positioning range over the past three years, measured from 0 to 100) shows the speculators are currently Bearish with a score of 49.7 percent. The commercials are Bullish with a score of 62.4 percent and the small traders (not shown in chart) are Bearish-Extreme with a score of 15.0 percent.

SWISS FRANC StatisticsSPECULATORSCOMMERCIALSSMALL TRADERS
– Percent of Open Interest Longs:11.572.915.5
– Percent of Open Interest Shorts:31.325.043.6
– Net Position:-11,58728,058-16,471
– Gross Longs:6,73442,6759,060
– Gross Shorts:18,32114,61725,531
– Long to Short Ratio:0.4 to 12.9 to 10.4 to 1
NET POSITION TREND:
– COT Index Score (3 Year Range Pct):49.762.415.0
– COT Index Reading (3 Year Range):BearishBullishBearish-Extreme
NET POSITION MOVEMENT INDEX:
– 6-Week Change in Strength Index:-30.028.0-22.4


Canadian Dollar Futures:

US Year Treasury Notes Long Bonds Futures COT Chart
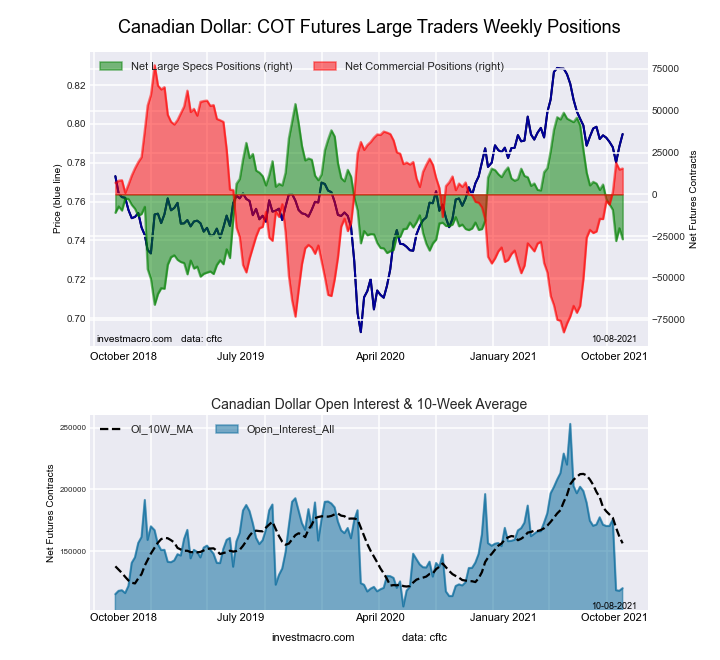
The Canadian Dollar large speculator standing this week equaled a net position of -20,235 contracts in the data reported through Tuesday. This was a weekly rise of 7,642 contracts from the previous week which had a total of -27,877 net contracts.

This week’s current strength score (the trader positioning range over the past three years, measured from 0 to 100) shows the speculators are currently Bearish with a score of 38.1 percent. The commercials are Bullish with a score of 60.9 percent and the small traders (not shown in chart) are Bullish with a score of 54.9 percent.

CANADIAN DOLLAR StatisticsSPECULATORSCOMMERCIALSSMALL TRADERS
– Percent of Open Interest Longs:18.553.026.9
– Percent of Open Interest Shorts:35.740.422.3
– Net Position:-20,23514,8335,402
– Gross Longs:21,87362,54931,747
– Gross Shorts:42,10847,71626,345
– Long to Short Ratio:0.5 to 11.3 to 11.2 to 1
NET POSITION TREND:
– COT Index Score (3 Year Range Pct):38.160.954.9
– COT Index Reading (3 Year Range):BearishBullishBullish
NET POSITION MOVEMENT INDEX:
– 6-Week Change in Strength Index:-19.118.5-9.9


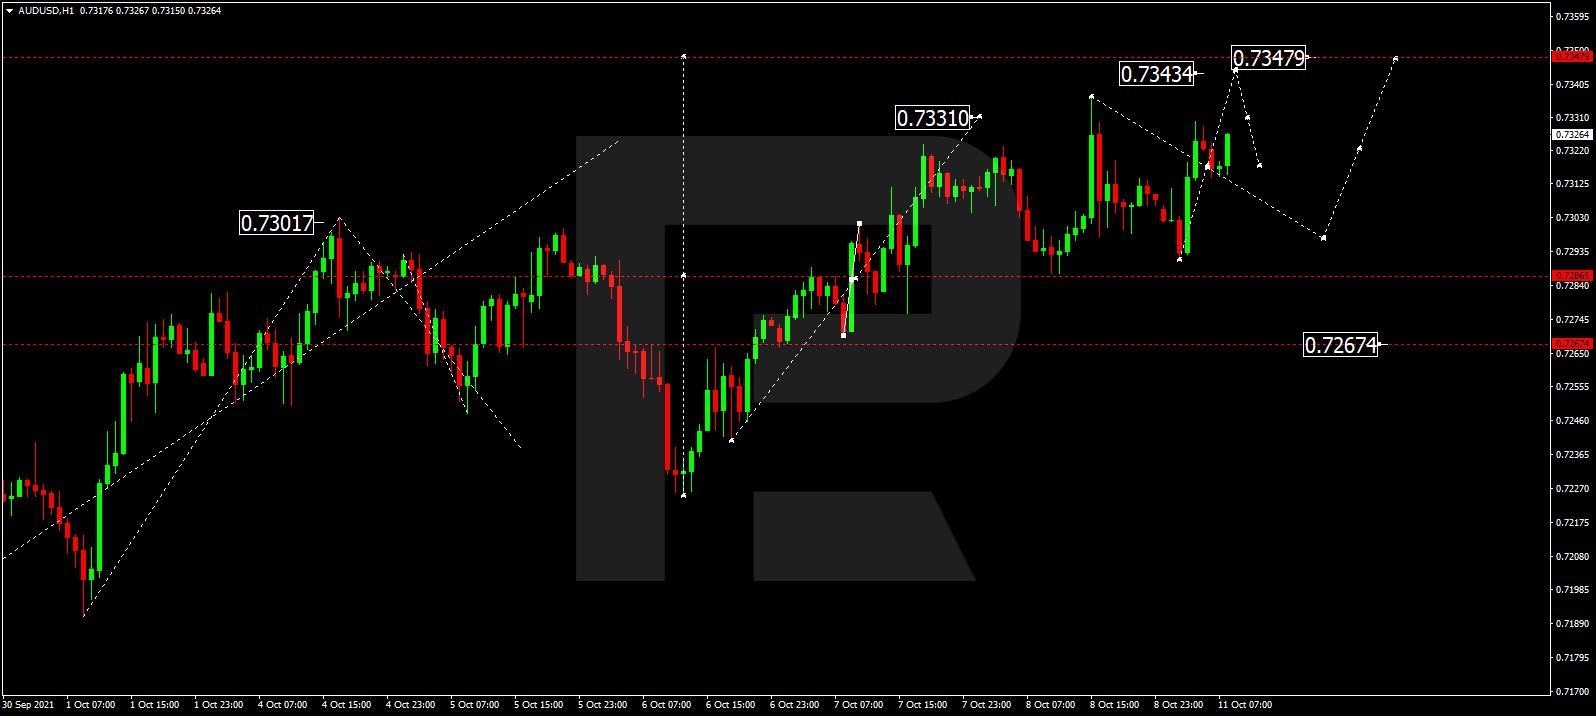
Australian Dollar Futures:

Ultra US Year Treasury Notes Long Bonds Futures COT Chart
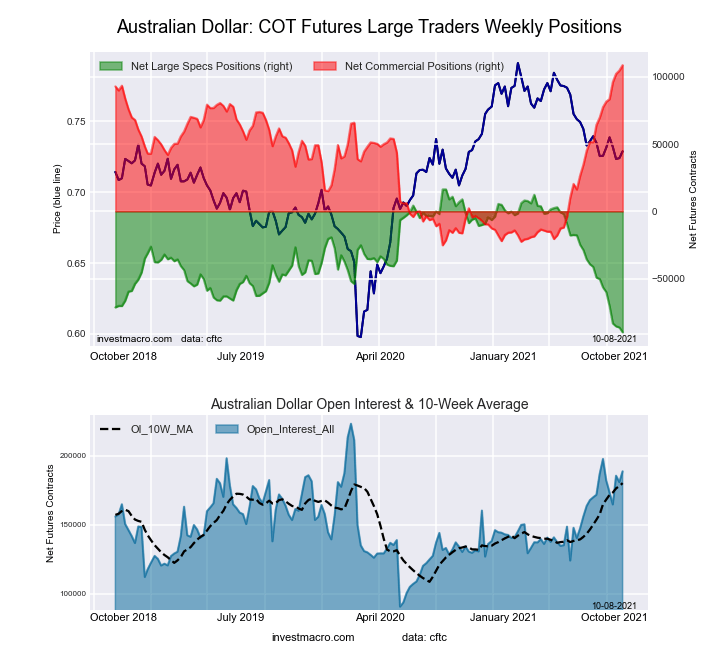
The Australian Dollar large speculator standing this week equaled a net position of -86,383 contracts in the data reported through Tuesday. This was a weekly lowering of -799 contracts from the previous week which had a total of -85,584 net contracts.

This week’s current strength score (the trader positioning range over the past three years, measured from 0 to 100) shows the speculators are currently Bearish-Extreme with a score of 0.0 percent. The commercials are Bullish-Extreme with a score of 100.0 percent and the small traders (not shown in chart) are Bearish-Extreme with a score of 11.0 percent.

AUSTRALIAN DOLLAR StatisticsSPECULATORSCOMMERCIALSSMALL TRADERS
– Percent of Open Interest Longs:10.279.58.0
– Percent of Open Interest Shorts:57.921.718.1
– Net Position:-86,383104,698-18,315
– Gross Longs:18,407143,86314,460
– Gross Shorts:104,79039,16532,775
– Long to Short Ratio:0.2 to 13.7 to 10.4 to 1
NET POSITION TREND:
– COT Index Score (3 Year Range Pct):0.0100.011.0
– COT Index Reading (3 Year Range):Bearish-ExtremeBullish-ExtremeBearish-Extreme
NET POSITION MOVEMENT INDEX:
– 6-Week Change in Strength Index:-35.126.92.4


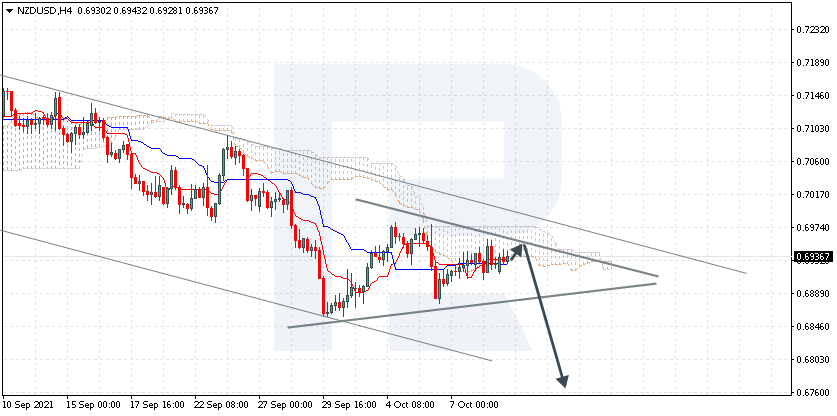
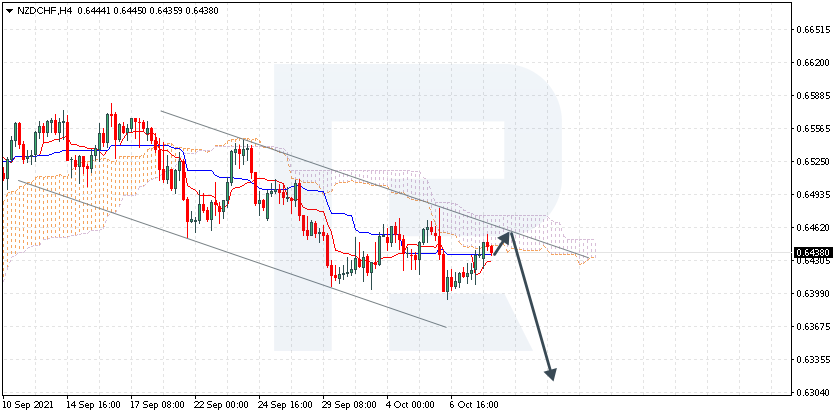
New Zealand Dollar Futures:

Eurodollar Bonds Futures COT Chart
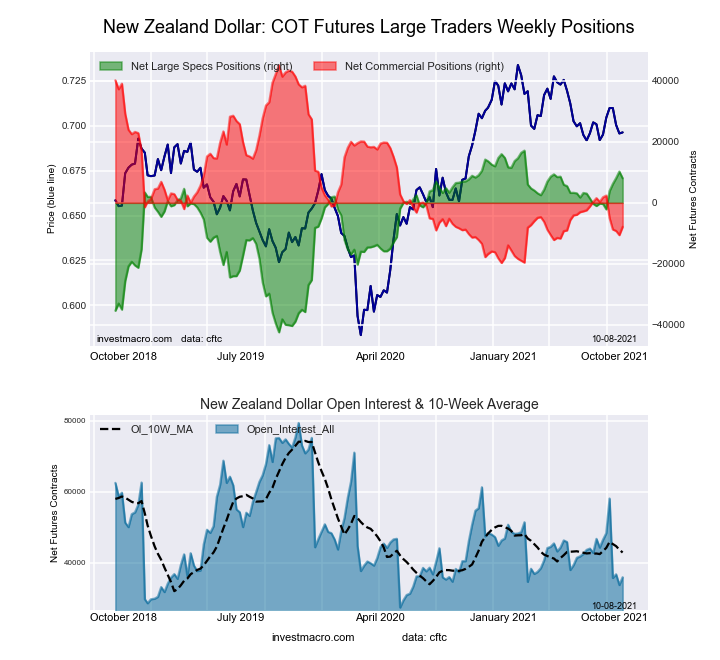
The New Zealand Dollar large speculator standing this week equaled a net position of 10,246 contracts in the data reported through Tuesday. This was a weekly boost of 2,144 contracts from the previous week which had a total of 8,102 net contracts.

This week’s current strength score (the trader positioning range over the past three years, measured from 0 to 100) shows the speculators are currently Bullish-Extreme with a score of 88.5 percent. The commercials are Bearish-Extreme with a score of 14.1 percent and the small traders (not shown in chart) are Bullish with a score of 57.2 percent.

NEW ZEALAND DOLLAR StatisticsSPECULATORSCOMMERCIALSSMALL TRADERS
– Percent of Open Interest Longs:54.431.112.2
– Percent of Open Interest Shorts:24.062.611.1
– Net Position:10,246-10,598352
– Gross Longs:18,32410,4724,106
– Gross Shorts:8,07821,0703,754
– Long to Short Ratio:2.3 to 10.5 to 11.1 to 1
NET POSITION TREND:
– COT Index Score (3 Year Range Pct):88.514.157.2
– COT Index Reading (3 Year Range):Bullish-ExtremeBearish-ExtremeBullish
NET POSITION MOVEMENT INDEX:
– 6-Week Change in Strength Index:17.6-16.95.1


Mexican Peso Futures:

Ultra 10-Year Treasury Notes Bonds Futures COT Chart
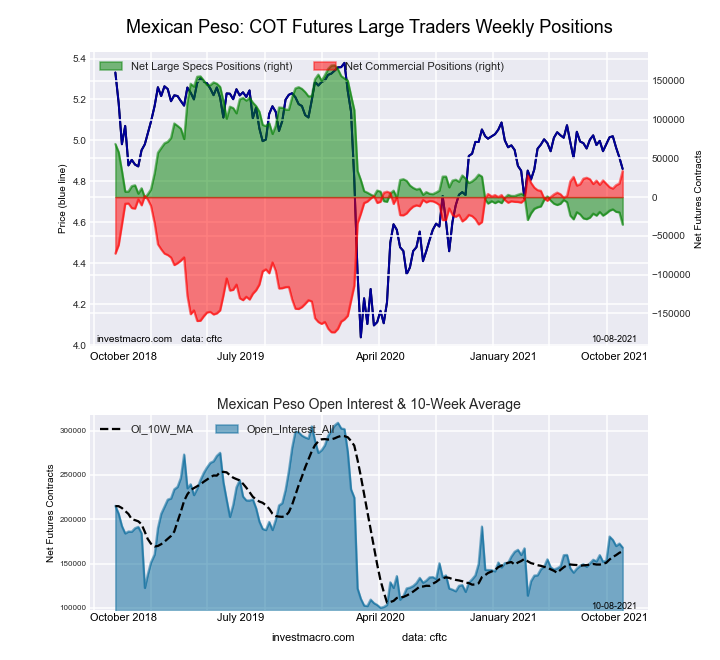
The Mexican Peso large speculator standing this week equaled a net position of -19,595 contracts in the data reported through Tuesday. This was a weekly reduction of -580 contracts from the previous week which had a total of -19,015 net contracts.

This week’s current strength score (the trader positioning range over the past three years, measured from 0 to 100) shows the speculators are currently Bearish-Extreme with a score of 4.9 percent. The commercials are Bullish-Extreme with a score of 94.8 percent and the small traders (not shown in chart) are Bullish with a score of 52.0 percent.

MEXICAN PESO StatisticsSPECULATORSCOMMERCIALSSMALL TRADERS
– Percent of Open Interest Longs:53.542.33.2
– Percent of Open Interest Shorts:64.932.22.0
– Net Position:-19,59517,4872,108
– Gross Longs:92,42373,0865,510
– Gross Shorts:112,01855,5993,402
– Long to Short Ratio:0.8 to 11.3 to 11.6 to 1
NET POSITION TREND:
– COT Index Score (3 Year Range Pct):4.994.852.0
– COT Index Reading (3 Year Range):Bearish-ExtremeBullish-ExtremeBullish
NET POSITION MOVEMENT INDEX:
– 6-Week Change in Strength Index:-0.20.8-4.5


Brazilian Real Futures:

US Year Treasury Notes Long Bonds Futures COT Chart
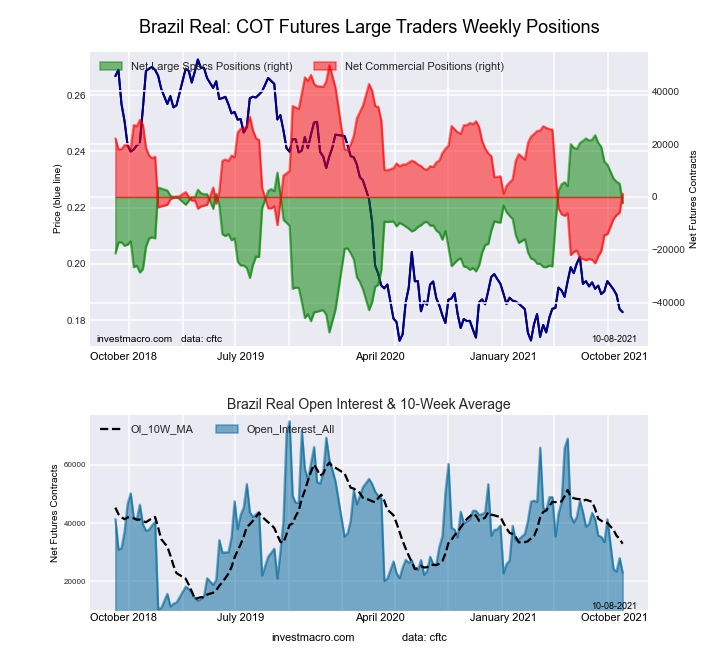
The Brazilian Real large speculator standing this week equaled a net position of 5,086 contracts in the data reported through Tuesday. This was a weekly fall of -686 contracts from the previous week which had a total of 5,772 net contracts.

This week’s current strength score (the trader positioning range over the past three years, measured from 0 to 100) shows the speculators are currently Bullish with a score of 75.4 percent. The commercials are Bearish with a score of 25.5 percent and the small traders (not shown in chart) are Bullish with a score of 77.3 percent.

BRAZIL REAL StatisticsSPECULATORSCOMMERCIALSSMALL TRADERS
– Percent of Open Interest Longs:45.542.210.7
– Percent of Open Interest Shorts:27.363.57.6
– Net Position:5,086-5,956870
– Gross Longs:12,73711,7963,007
– Gross Shorts:7,65117,7522,137
– Long to Short Ratio:1.7 to 10.7 to 11.4 to 1
NET POSITION TREND:
– COT Index Score (3 Year Range Pct):75.425.577.3
– COT Index Reading (3 Year Range):BullishBearishBullish
NET POSITION MOVEMENT INDEX:
– 6-Week Change in Strength Index:-18.619.4-7.6


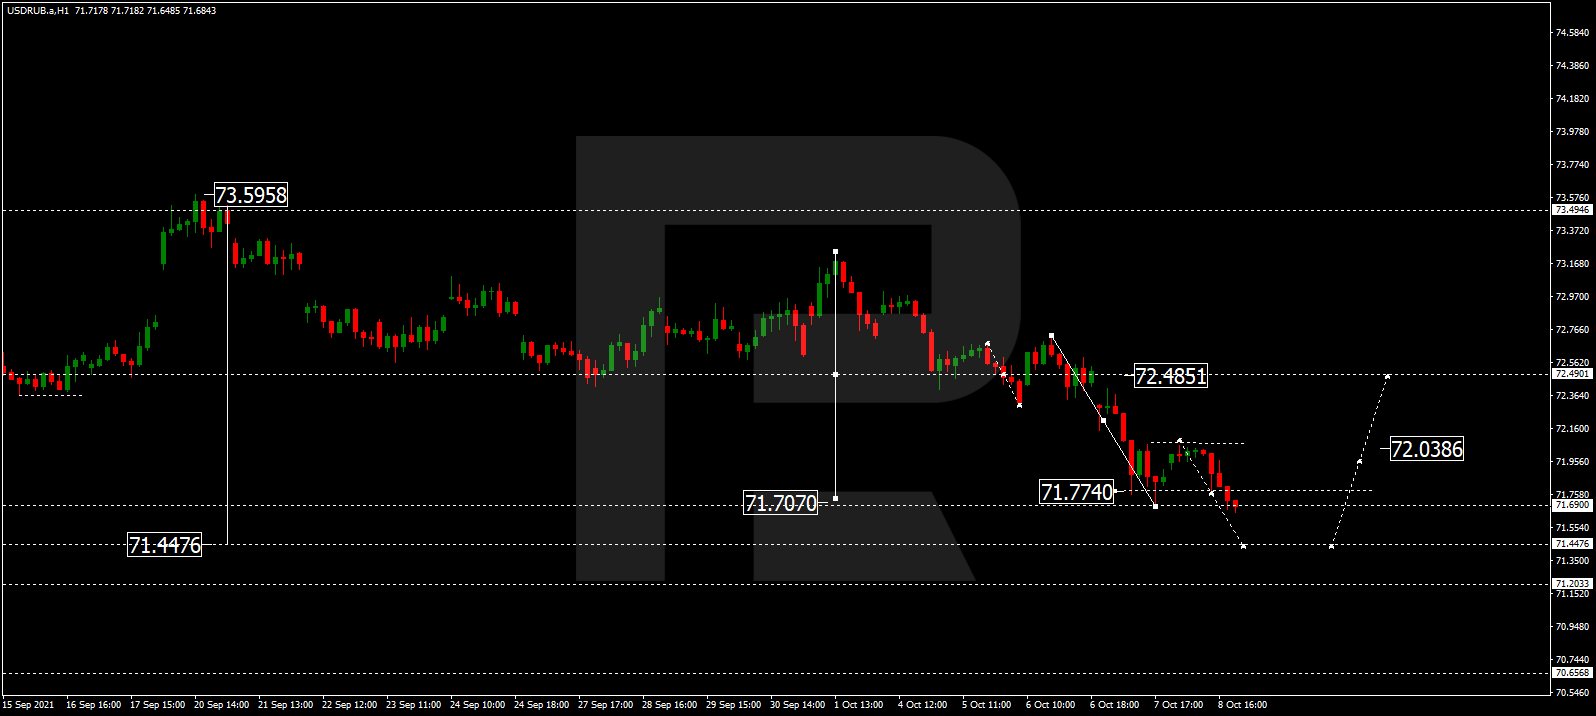
Russian Ruble Futures:

Ultra US Year Treasury Notes Long Bonds Futures COT Chart
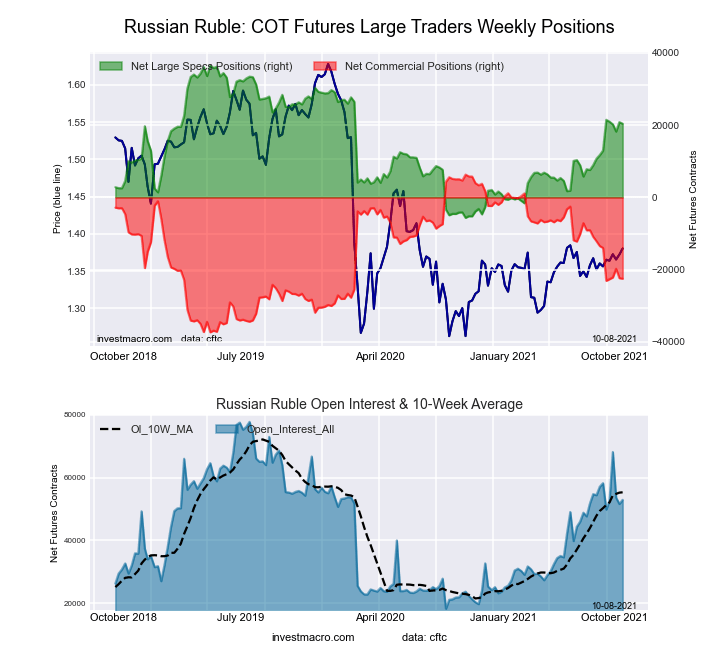
The Russian Ruble large speculator standing this week equaled a net position of 20,828 contracts in the data reported through Tuesday. This was a weekly rise of 2,595 contracts from the previous week which had a total of 18,233 net contracts.

This week’s current strength score (the trader positioning range over the past three years, measured from 0 to 100) shows the speculators are currently Bullish with a score of 62.7 percent. The commercials are Bearish with a score of 34.3 percent and the small traders (not shown in chart) are Bullish-Extreme with a score of 85.6 percent.

RUSSIAN RUBLE StatisticsSPECULATORSCOMMERCIALSSMALL TRADERS
– Percent of Open Interest Longs:55.040.04.8
– Percent of Open Interest Shorts:14.783.21.9
– Net Position:20,828-22,3341,506
– Gross Longs:28,39720,6172,485
– Gross Shorts:7,56942,951979
– Long to Short Ratio:3.8 to 10.5 to 12.5 to 1
NET POSITION TREND:
– COT Index Score (3 Year Range Pct):62.734.385.6
– COT Index Reading (3 Year Range):BullishBearishBullish-Extreme
NET POSITION MOVEMENT INDEX:
– 6-Week Change in Strength Index:21.6-20.4-7.4


Bitcoin Futures:

Eurodollar Bonds Futures COT Chart
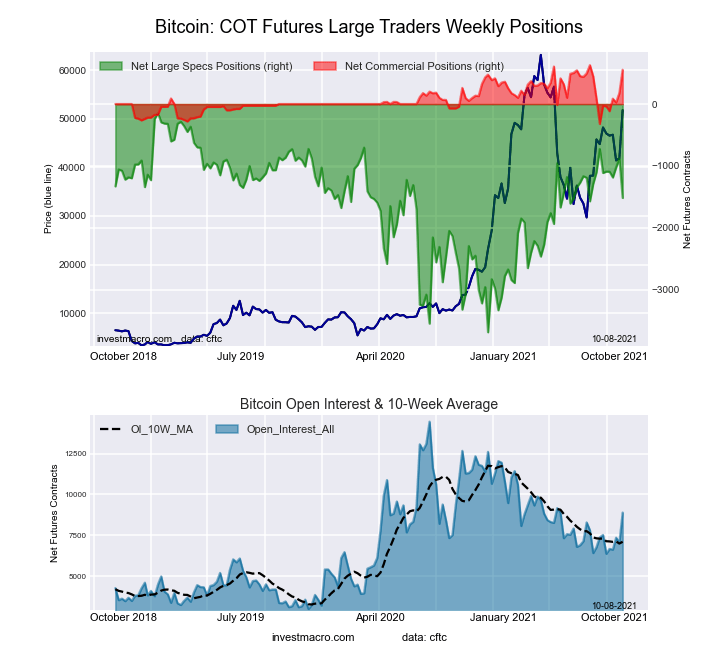
The Bitcoin large speculator standing this week equaled a net position of -883 contracts in the data reported through Tuesday. This was a weekly gain of 142 contracts from the previous week which had a total of -1,025 net contracts.

This week’s current strength score (the trader positioning range over the past three years, measured from 0 to 100) shows the speculators are currently Bullish with a score of 79.1 percent. The commercials are Bullish with a score of 52.6 percent and the small traders (not shown in chart) are Bearish-Extreme with a score of 12.9 percent.

BITCOIN StatisticsSPECULATORSCOMMERCIALSSMALL TRADERS
– Percent of Open Interest Longs:64.56.821.0
– Percent of Open Interest Shorts:77.04.311.0
– Net Position:-883178705
– Gross Longs:4,5394791,480
– Gross Shorts:5,422301775
– Long to Short Ratio:0.8 to 11.6 to 11.9 to 1
NET POSITION TREND:
– COT Index Score (3 Year Range Pct):79.152.612.9
– COT Index Reading (3 Year Range):BullishBullishBearish-Extreme
NET POSITION MOVEMENT INDEX:
– 6-Week Change in Strength Index:-4.452.6-11.3


Article By InvestMacro.comReceive our weekly COT Reports by Email

*COT Report: The COT data, released weekly to the public each Friday, is updated through the most recent Tuesday (data is 3 days old) and shows a quick view of how large speculators or non-commercials (for-profit traders) were positioned in the futures markets.

The CFTC categorizes trader positions according to commercial hedgers (traders who use futures contracts for hedging as part of the business), non-commercials (large traders who speculate to realize trading profits) and nonreportable traders (usually small traders/speculators).

Find CFTC criteria here: (http://www.cftc.gov/MarketReports/CommitmentsofTraders/ExplanatoryNotes/index.htm).