
By Orbex

The formation of the NZDUSD currency pair in the long term hints at a cycle zigzag pattern, consisting of three main sub-waves a-b-c.
On the current chart, we see the second half of a major correction wave b. It looks fully completed, taking the form of a primary triple zigzag Ⓦ-Ⓧ-Ⓨ-Ⓧ-Ⓩ. The last actionary wave Ⓩ is equal to the primary wave Ⓨ. So there is a possibility that the development of the triple zigzag is over.
In this case, in the near future, the market will turn around and the formation of a cycle wave c will begin. In turn, this can take the form of an impulse or an ending diagonal.
Bullish movement in wave c may reach the October peak at the 0.722 level (marked by an intervening wave Ⓧ) and then rise to higher levels.
Free Reports:
 Download Our Metatrader 4 Indicators – Put Our Free MetaTrader 4 Custom Indicators on your charts when you join our Weekly Newsletter
 Get our Weekly Commitment of Traders Reports - See where the biggest traders (Hedge Funds and Commercial Hedgers) are positioned in the futures markets on a weekly basis.
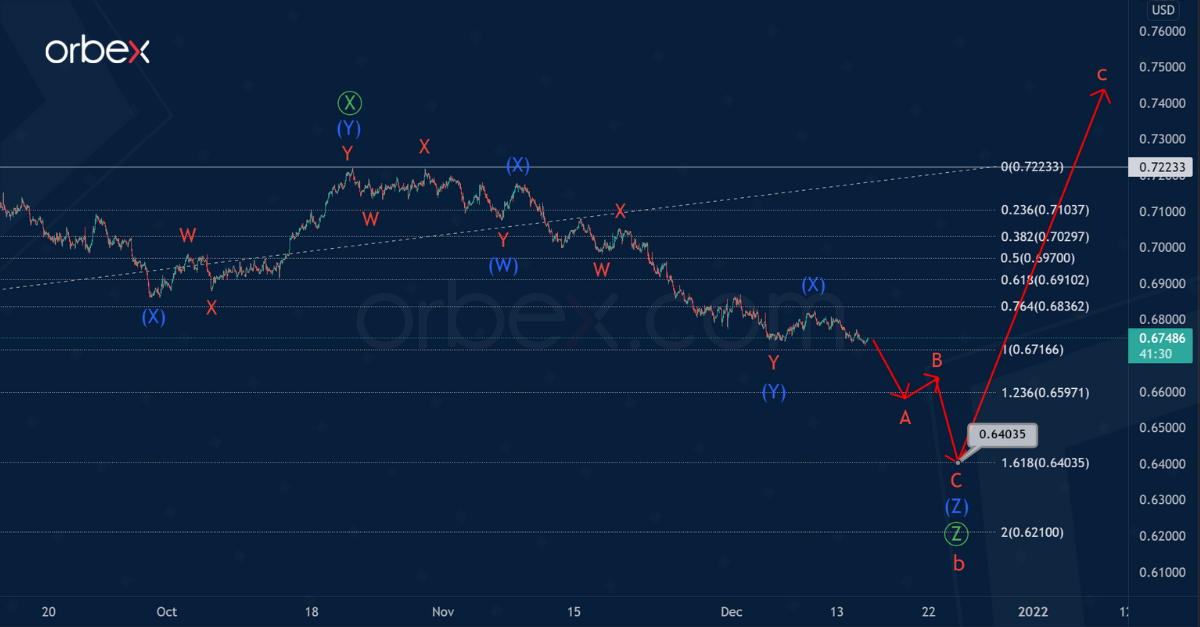
However, the formation of a correction wave b of the cycle degree can continue. Perhaps the primary wave Ⓩ will not be a double zigzag, but a triple zigzag (W)-(X)-(Y)-(X)-(Z) of the intermediate degree.
We see that the first four parts of the intermediate pattern are fully completed. And in htis case, the price may soon begin to decline in the final intermediate wave (Z). Wave (Z) can take the form of a simple zigzag A-B-C of the minor degree, as shown on the chart.
The fall of the exchange rate in the alternative scenario could be in the 0.640 area. At that level, primary wave Ⓩ will be at 161.8% of primary wave Ⓨ.
![]() Article by Orbex
Article by Orbex
Orbex is a fully licensed broker that was established in 2011. Founded with a mission to serve its traders responsibly and provides traders with access to the world’s largest and most liquid financial markets. www.orbex.com

- GBP/USD at Month’s Lows: The Outlook Remains Weak Jul 29, 2026
- Crude oil falls below $80 per barrel. Australia sees inflation slowdown Jul 29, 2026
- The US Tech sector hit by sell‑off. Oil prices decline on renewed negotiations Jul 28, 2026
- Gold Declines, Focus on Fed and Falling Oil Prices Jul 28, 2026
- This week will be one of the most crowded for central‑bank meetings Jul 27, 2026
- EUR/USD Ahead of a Key Week: Holding Near Lows Jul 27, 2026
- COT Metals Charts: Weekly Speculator Changes led by Copper Jul 26, 2026
- COT Bonds Charts: Speculator Bets led by SOFR 3-Months & 5-Year Bonds Jul 26, 2026
- COT Energy Charts: Weekly Speculator Bets led by WTI Crude & Natural Gas Jul 26, 2026
- COT Soft Commodities Charts: Weekly Speculator Bets led by Corn & Soybeans Jul 26, 2026