
By Orbex
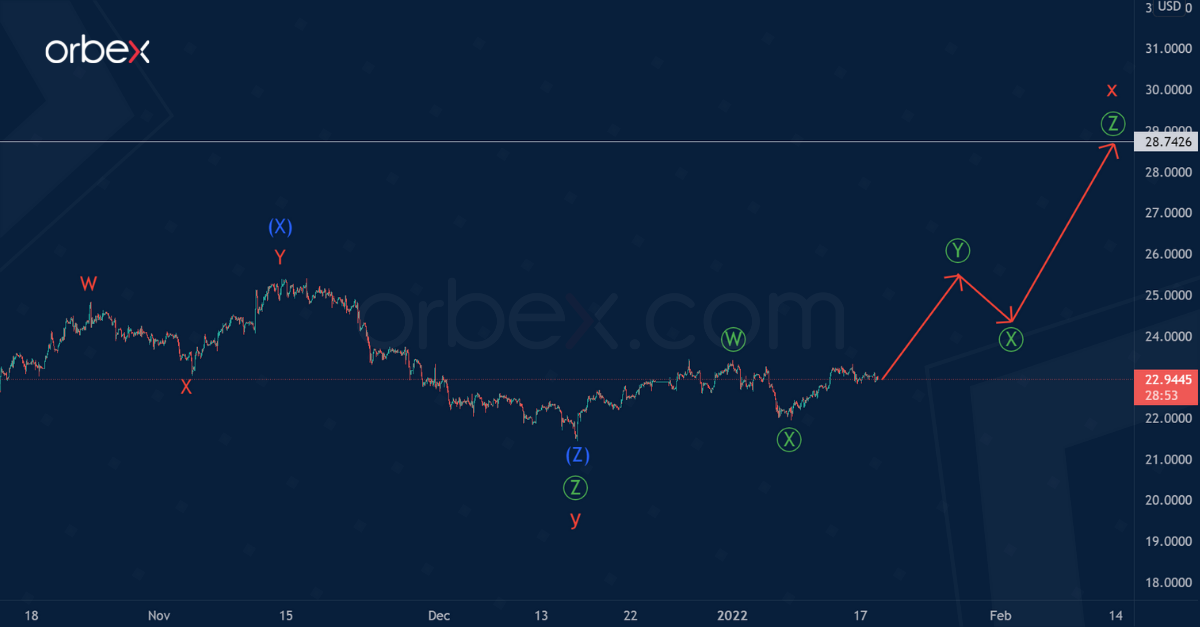
The XAGUSD structure suggests the development of a cycle triple zigzag w-x-y-x-z. In this chart, we see the final part of the bearish wave y. There is an assumption that in the second half of December, the price reached a peak, which means that the formation of the wave y has completely ended.
The cycle wave y took the form of a triple zigzag, where the last actionary wave Ⓩ is also a triple zigzag of a smaller wave level.
Consequently, in the upcoming trading weeks, we can expect an upward price movement and the development of a cycle intervening wave x. This wave can take the form of a primary triple zigzag.
Most likely, the price in wave x will rise to the previous maximum at 28.742.
Free Reports:
 Get our Weekly Commitment of Traders Reports - See where the biggest traders (Hedge Funds and Commercial Hedgers) are positioned in the futures markets on a weekly basis.
 Download Our Metatrader 4 Indicators – Put Our Free MetaTrader 4 Custom Indicators on your charts when you join our Weekly Newsletter

There is a possibility that the reactionary intervening wave x has ended. So, it is worth paying attention to the alternative option, in which we see a downward price movement and the formation of the actionary wave z.
Perhaps the wave z will be a simple zigzag of the primary degree. The impulse wave Ⓐ and the correction Ⓑ in the form of a double zigzag have already been built. Therefore, we are waiting for a drop in the primary impulse wave Ⓒ.
Most likely, the wave z will complete its pattern near 16.89. At that level, it will be at the 100% Fibonacci extension of wave y.
![]() Article by Orbex
Article by Orbex
Orbex is a fully licensed broker that was established in 2011. Founded with a mission to serve its traders responsibly and provides traders with access to the world’s largest and most liquid financial markets. www.orbex.com

- COT Metals Charts: Weekly Speculator Changes led by Copper Jul 26, 2026
- COT Bonds Charts: Speculator Bets led by SOFR 3-Months & 5-Year Bonds Jul 26, 2026
- COT Energy Charts: Weekly Speculator Bets led by WTI Crude & Natural Gas Jul 26, 2026
- COT Soft Commodities Charts: Weekly Speculator Bets led by Corn & Soybeans Jul 26, 2026
- The US introduces new import tariffs for 60 countries. Brent crude surpasses $100 per barrel Jul 24, 2026
- USD/JPY Breaks Records: Nothing Slows the Yen’s Decline Jul 24, 2026
- Oil prices reached a 6‑week high. The AUD strengthened on the back of a strong labor‑market report Jul 23, 2026
- EUR/USD Recovers as Dollar Weakens Jul 23, 2026
- Bitcoin rose to $66,000. The New Zealand dollar continues to strengthen Jul 22, 2026
- Inflationary pressure is easing in Canada. In New Zealand, on the contrary, inflation is rising Jul 21, 2026