Archive for Forex and Currency News – Page 182

Intraday Market Analysis – USD Consolidates

By Orbex

AUDUSD attempts rebound

AUDUSD

The Australian dollar bounces back over strong retail sales in November. The pair saw bids near a previous trough (0.7130).

The RSI’s double-dip into the oversold area attracted some traders in taking up the bargain. A bullish RSI divergence suggests a deceleration in the downward momentum. And a jump above 0.7180 could be the first step towards a bounce.

The Aussie may surge to the daily resistance at 0.7360 if buyers succeed in lifting offers around 0.7270. Otherwise, the price could test the critical floor at 0.7080.

USDJPY tests support

USDJPY

The Japanese yen rose as risk appetite fades across markets.

A bullish MA cross on the daily chart indicates that the dollar’s rally gained traction. However, an overbought RSI means that a pullback could be an opportunity for the bulls to buy dips.

The dollar is testing the psychological level of 115.00, the origin of the rally above the November peak (115.50). An oversold RSI has brought in some buying interest. A bearish breakout could trigger a correction to 114.30. Then, the bulls will need to reclaim 115.90 in order to resume the uptrend.

US 30 continues to retreat

DJIA

The Dow Jones tumbled as US Treasury yields hit a two-year high on hike bets.

A bearish RSI divergence foreshadowed the current sell-off. A drop below 36300 prompted leveraged positions to close out, driving up volatility as short-term sentiment deteriorated. Rebounds could be opportunities for the bears to sell into strength.

35700 is an area of interest, as it lies in a former supply zone and along the 30-day moving average. 35200 would be a second layer of support, while 36400 is the immediate resistance.


Orbex-LogoArticle by Orbex

Orbex is a fully licensed broker that was established in 2011. Founded with a mission to serve its traders responsibly and provides traders with access to the world’s largest and most liquid financial markets. www.orbex.com

Forex Technical Analysis & Forecast 11.01.2022

Article By RoboForex.com

EURUSD, “Euro vs US Dollar”

Having completed the descending wave at 1.1285, EURUSD is growing towards 1.1365. Later, the market may start a new decline to reach 1.1330 and then form one more ascending structure with the target at 1.1400.

EURUSD
Risk Warning: the result of previous trading operations do not guarantee the same results in the future

GBPUSD, “Great Britain Pound vs US Dollar”

After finishing the descending wave at 1.3530, GBPUSD is growing towards 1.3610. After that, the instrument may correct to reach 1.3570 and then start another growth with the target at 1.3628.

GBPUSD
Risk Warning: the result of previous trading operations do not guarantee the same results in the future

USDRUB, “US Dollar vs Russian Ruble”

USDRUB has completed the descending wave at 74.88. Possibly, today the pair may grow to reach 76.03 and then resume trading downwards with the short-term target at 74.10.

USDRUB
Risk Warning: the result of previous trading operations do not guarantee the same results in the future

USDJPY, “US Dollar vs Japanese Yen”

After completing the descending wave at 115.05, USDJPY is expected to correct and reach 115.60. Later, the market may resume falling with the target at 114.92.

USDJPY
Risk Warning: the result of previous trading operations do not guarantee the same results in the future

USDCHF, “US Dollar vs Swiss Franc”

Having finished the ascending wave at 0.9274, USDCHF is correcting towards 0.9180. After that, the instrument may resume trading upwards to break 0.9270 and then continue growing with the short-term target at 0.9365.

USDCHF
Risk Warning: the result of previous trading operations do not guarantee the same results in the future

AUDUSD, “Australian Dollar vs US Dollar”

AUDUSD is still consolidating around 0.7188. Possibly, the pair may break this range to the downside and resume falling with the short-term target at 0.7080. Later, the market may form one more ascending structure towards 0.7188 and then start another decline to reach 0.6900.

AUDUSD
Risk Warning: the result of previous trading operations do not guarantee the same results in the future

BRENT

Brent has completed the descending structure at 80.60 and may later grow towards 84.24. After that, the instrument may start a new correction to reach 80.00 and then resume trading upwards with the target at 90.00.

BRENT
Risk Warning: the result of previous trading operations do not guarantee the same results in the future

XAUUSD, “Gold vs US Dollar”

Gold has completed the ascending wave at 1806.00. Possibly, today the metal may extend the correction towards 1813.30 and then resume falling to break 1790.20. Later, the market may continue trading downwards to reach 1780.20 and then form one more ascending structure with the target at 1830.60.

GOLD
Risk Warning: the result of previous trading operations do not guarantee the same results in the future

S&P 500

After finishing the correction at 4580.9, the S&P index is expected to grow towards 4698.9 and may later start a new decline to reach 4639.5, thus forming a new consolidation range between the two latter levels. If the price breaks this range to the downside, the market may form a new descending structure towards 4490.0; if to the upside – resume growing with the target at 4846.0.

S&P 500

Article By RoboForex.com

Attention!
Forecasts presented in this section only reflect the author’s private opinion and should not be considered as guidance for trading. RoboForex LP bears no responsibility for trading results based on trading recommendations described in these analytical reviews.

Japanese Candlesticks Analysis 11.01.2022 (XAUUSD, NZDUSD, GBPUSD)

Article By RoboForex.com

XAUUSD, “Gold vs US Dollar”

As we can see in the H4 chart, the asset is still trading upwards. After forming a Hammer reversal pattern not far from the support level, XAUUSD is reversing and may continue forming its ascending impulse. In this case, the upside target may be the resistance area at 1835.50. At the same time, an opposite scenario implies that the price may correct towards 1800.00 before resuming its ascending tendency.

XAUUSD
Risk Warning: the result of previous trading operations do not guarantee the same results in the future

NZDUSD, “New Zealand vs US Dollar”

As we can see in the H4 chart, NZDUSD has formed a Hammer reversal pattern close to the support area. At the moment, the asset is reversing and may form a new ascending impulse towards the resistance level. In this case, the upside target may be at 0.6825. After that, the asset may break this level and continue moving upwards. However, an alternative scenario implies that the price may fall to reach 0.6750 first and then resume its uptrend towards the resistance level.

NZDUSD
Risk Warning: the result of previous trading operations do not guarantee the same results in the future

GBPUSD, “Great Britain Pound vs US Dollar”

As we can see in the H4 chart, GBPUSD has formed a Hammer reversal pattern near the support level. At the moment, the pair may reverse and start a new impulse to the upside. In this case, the upside target may be at 1.3665. After testing the resistance area, the market may break it and continue trading upwards. Still, there might be an alternative scenario, according to which the asset may correct to reach 1.3540 before starting another growth.

GBPUSD

Article By RoboForex.com

Attention!
Forecasts presented in this section only reflect the author’s private opinion and should not be considered as guidance for trading. RoboForex LP bears no responsibility for trading results based on trading recommendations described in these analytical reviews.

The Analytical Overview of the Main Currency Pairs on 2022.01.11

by JustForex

The EUR/USD currency pair

Technical indicators of the currency pair:
  • Prev Open: 1.1355
  • Prev Close: 1.1328
  • % chg. over the last day: -0.24%

Any increase in the ECB’s inflation forecast at its upcoming meeting in March could raise expectations of earlier monetary policy tightening by the ECB, but amid the Fed’s aggressive interest rate hike, most analysts are leaning toward a bearish EUR/USD outlook over the medium term of several months.

Trading recommendations
  • Support levels: 1.1305, 1.1288, 1.1271
  • Resistance levels: 1.1350, 1.1369, 1.1436, 1.1535, 1.1613, 1.1667, 1.1717

From a technical point of view, the EUR/USD on the hour time frame is bullish. The price is traded in a wide range, which is clearly visible on the daily chart. Yesterday, the price again tested the priority change level, but the buyers again defended their positions. Under such market conditions, it is better to consider sell deals from the 1.1350 resistance level, but with additional confirmation. Buy trades can be considered on the lower time frames from the support level 1.1305, but only with additional confirmation in the form of the buyers’ initiative.

Alternative scenario: if the price breaks down through the 1.1288 support level and fixes below, the mid-term uptrend will be broken.

EUR/USD
News feed for 2022.01.11:
  • – ECB President Lagarde’s Speech at 12:20 (GMT+2);
  • – US FOMC Member Mester’s Speech at 16:00 (GMT+2);
  • – US FOMC Member George’s Speech at 16:30 (GMT+2);
  • – US Fed Chair Powell’s Testifies at 17:00 (GMT+2).

The GBP/USD currency pair

Technical indicators of the currency pair:
  • Prev Open: 1.3573
  • Prev Close: 1.3575
  • % chg. over the last day: +0.01%

Omicron could cause $48 billion in damage to the UK economy. The projected loss is equivalent to 8.8% of gross domestic product and is based on government planning assumptions of 25% isolation. The British currency is strengthening right now on the back of a rate hike from the Bank of England, but any strengthening of the dollar index in the near term could trigger a decline in GBP/USD.

Trading recommendations
  • Support levels: 1.3551, 1.3473, 1.3396, 1.3352, 1.3257, 1.3220
  • Resistance levels: 1.3597, 1.3685

On the hourly time frame, the trend on GBP/USD is bullish. The price is now trading in a wide corridor. The MACD indicator is still signaling divergence. Under such market conditions, traders should consider buy positions from the 1.3551 support level but only with additional confirmation in the form of a buyers’ initiative. Sell trades can be considered from the resistance level of 1.3597 after a new initiative from the sellers.

Alternative scenario: if the price breaks down through the 1.3473 support level and consolidates below, the bearish scenario will likely resume.

GBP/USD
There is no news feed for today.

The USD/JPY currency pair

Technical indicators of the currency pair:
  • Prev Open: 115.60
  • Prev Close: 115.18
  • % chg. over the last day: -0.36%

The Japanese Yen has strengthened a little bit in the last few days. Such corrections are acceptable and necessary for further uptrend. The mid-term fundamental picture right now is in favor of a stronger dollar index and a weaker JPY as the Fed is preparing for 3 or 4 interest rate hikes this year as the BoJ continues its aggressive stimulus program.

Trading recommendations
  • Support levels: 115.09, 113.74
  • Resistance levels: 115.34, 115.64, 116.08, 116.50

The global USD/JPY currency pair trend is bullish. However, the price reached the priority change level yesterday. The MACD indicator became negative. It is best to look for buy deals from the support levels on the lower time frames, near the priority change level. Sell positions are better to look from the resistance level of 115.64, but only with confirmation and with short targets.

Alternative scenario: if the price fixes below 115.09, the uptrend will likely be broken.

USD/JPY
There is no news feed for today.

The USD/CAD currency pair

Technical indicators of the currency pair:
  • Prev Open: 1.2641
  • Prev Close: 1.2676
  • % chg. over the last day: +0.28%

The Canadian dollar is a commodity currency, so it depends not only on the monetary policy of the Bank of Canada but also on the oil prices and the dollar index. Against the background of the stable oil and a slight decrease of the dollar index, the USD/CAD quotes went up a little bit yesterday. The speech of Federal Reserve Chairman Jerome Powell, in front of the US Senate, should be watched closely today. This speech might provoke the dollar index growth and lead to the rise of USD/CAD quotes.

Trading recommendations
  • Support levels: 1.2628, 1.2598
  • Resistance levels: 1.2681, 1.2715, 1.2792, 1.2824, 1.2903, 1.2951

From a technical point of view, the USD/CAD currency pair has changed to bearish. Friday’s increase in oil prices and the decline in the dollar index on non-farm reports led to the strengthening of the Canadian dollar. But the price broke through the local downward trend line yesterday, which suggests a possible correction in the coming days. The MACD indicator has become inactive. Under such market conditions, it is better to look for buy trades from 1.2628. It is best to look for sell deals from the resistance levels around the moving average.

Alternative scenario: if the price breaks through the 1.2792 resistance level and fixes above, the downtrend is likely to be broken.

USD/CAD
There is no news feed for today.

by JustForex


This article reflects a personal opinion and should not be interpreted as an investment advice, and/or offer, and/or a persistent request for carrying out financial transactions, and/or a guarantee, and/or a forecast of future events.

Intraday Market Analysis – USD Struggles For Support

By Orbex

EURUSD tests key resistance

EURUSD

The US dollar retreated after December’s nonfarm payrolls came in far below expectations. The pair has been in a narrowing range between 1.1270 and 1.1365.

The previous fall below 1.1280 added pressure on the buy side, though it turned out to be an opportunity for the bulls to accumulate at a bargain.

A break above the resistance could end the sideways action and trigger a runaway rally towards 1.1460. The RSI surged into the overbought area and may cause a brief pullback above 1.1295.

USDCAD tests daily support

USDCAD

The loonie rallied after Canada added twice as many jobs as expected in December. The year-end sell-off met strong bids near the daily support at 1.2620.

But the rebound came to halt at the supply zone around 1.2810, which used to be a support from the previous consolidation. The RSI’s double top in the overbought zone has restrained the upward momentum.

1.2730 is a fresh resistance as price action is about to retest the critical level at 1.2620. A bearish breakout could trigger a plunge to 1.2540.

GER 40 seeks support

GER 40

The Dax 40 edged lower as rising CPI in the eurozone argues in favor of tightening. The index saw stiff selling pressure right under the all-time high at 16300.

A bearish RSI divergence in this major supply area indicates a lack of commitment from the bulls as buying slows down. A combination of profit-taking and fresh selling has led to a drop below 16100, a warning sign for a steeper correction.

15800 is the next key support. A breakout could send the index to 15500 at the base of the latest rally.


Orbex-LogoArticle by Orbex

Orbex is a fully licensed broker that was established in 2011. Founded with a mission to serve its traders responsibly and provides traders with access to the world’s largest and most liquid financial markets. www.orbex.com

Fibonacci Retracements Analysis 10.01.2022 (GOLD, USDCHF)

Article By RoboForex.com

XAUUSD, “Gold vs US Dollar”

In the H4 chart, after finishing the correctional uptrend at 61.8% fibo, XAUUSD is trying to form a new wave to the downside towards the low at 1752.50, a breakout of which may lead to a further downtrend towards 61.8% and 76.0% fibo at 1729.90 and 1696.13 respectively. The local resistance is at 1831.66.

GOLD_H4
Risk Warning: the result of previous trading operations do not guarantee the same results in the future

As we can see in the H1 chart, the asset has reached 61.8% fibo. In the nearest future, the pair may form a slight pullback and then resume falling to break 76.0% fibo at 1771.50. Later, the market may continue falling to reach the low.

GOLD_H1
Risk Warning: the result of previous trading operations do not guarantee the same results in the future

USDCHF, “US Dollar vs Swiss Franc”

As we can see in the H4 chart, the asset is forming a new wave to the upside after convergence on MACD; it has already reached 38.2% fibo and may later continue towards 50.0% and 61.8% fibo at 0.9238 and 0.9270 respectively. However, the key upside target is the high at 0.9374, while the key support is at 0.9085.

USDCHF_H4
Risk Warning: the result of previous trading operations do not guarantee the same results in the future

In the H1 chart, having completed the pullback, USDCHF is growing to reach 50.0% fibo at 0.9236. The local support is the low at 0.9102.

USDCHF_H1

Article By RoboForex.com

Attention!
Forecasts presented in this section only reflect the author’s private opinion and should not be considered as guidance for trading. RoboForex LP bears no responsibility for trading results based on trading recommendations described in these analytical reviews.

Ichimoku Cloud Analysis 10.01.2022 (XAUUSD, GBPUSD, USDJPY)

Article By RoboForex.com

XAUUSD, “Gold vs US Dollar”

XAUUSD is trading at 1793.00; the instrument is moving below Ichimoku Cloud, thus indicating a descending tendency. The markets could indicate that the price may test the cloud’s downside border at 1810.00 and then resume moving downwards to reach 1755.00. Another signal in favour of a further downtrend will be a rebound from the rising channel’s downside border. However, the bearish scenario may no longer be valid if the price breaks the cloud’s upside border and fixes above 1825.00. In this case, the pair may continue growing towards 1850.00.

XAUUSD
Risk Warning: the result of previous trading operations do not guarantee the same results in the future

GBPUSD, “Great Britain Pound vs US Dollar”

GBPUSD is trading at 1.3581; the instrument is moving above Ichimoku Cloud, thus indicating an ascending tendency. The markets could indicate that the price may test Tenkan-Sen and Kijun-Sen at 1.3565 and then resume moving upwards to reach 1.3770. Another signal in favour of a further uptrend will be a rebound from the rising channel’s downside border. However, the bullish scenario may no longer be valid if the price breaks the cloud’s downside border and fixes below 1.3405. In this case, the pair may continue falling towards 1.3315.

GBPUSD
Risk Warning: the result of previous trading operations do not guarantee the same results in the future

USDJPY, “US Dollar vs Japanese Yen”

USDJPY is trading at 115.78; the instrument is moving above Ichimoku Cloud, thus indicating an ascending tendency. The markets could indicate that the price may test the cloud’s upside border at 115.60 and then resume moving upwards to reach 117.05. Another signal in favour of a further uptrend will be a rebound from the rising channel’s downside border. However, the bullish scenario may no longer be valid if the price breaks the cloud’s downside border and fixes below 114.85. In this case, the pair may continue falling towards 113.95. To confirm further growth, the asset must break the descending channel’s upside border and fix above 115.95.

USDJPY

Article By RoboForex.com

Attention!
Forecasts presented in this section only reflect the author’s private opinion and should not be considered as guidance for trading. RoboForex LP bears no responsibility for trading results based on trading recommendations described in these analytical reviews.

The Analytical Overview of the Main Currency Pairs on 2022.01.10

by JustForex

The EUR/USD currency pair

Technical indicators of the currency pair:
  • Prev Open: 1.1296
  • Prev Close: 1.1361
  • % chg. over the last day: +0.57%

The inflation rate in Europe increased to 5%, which was the highest value since the founding of the European Union. Last week, Eurozone policymakers said that they expected inflation to slow gradually in 2022, and this year, a rate hike will likely not be necessary. ECB officials, including ECB head Christine Lagarde, are expected to speak this week. Industrial production in Germany fell unexpectedly in November. The production decreased by 2.4% in annual terms in November.

Trading recommendations
  • Support levels: 1.1322, 1.1305, 1.1288, 1.1271
  • Resistance levels: 1.1350, 1.1369, 1.1436, 1.1535, 1.1613, 1.1667, 1.1717

From a technical point of view, the EUR/USD on the hour time frame is bullish. On Friday, the price jumped sharply on a non-farm report. Under such market conditions, it is better to consider sell deals from the 1.1350 resistance level, but with additional confirmation. Buy trades can be considered on the lower time frames from the support level 1.1322 or from 1.1305, but only with additional confirmation in the form of the buyers’ initiative.

Alternative scenario: if the price breaks down through the 1.1288 support level and fixes below, the mid-term uptrend will be broken.

EUR/USD
News feed for 2022.01.10:
  • – Eurozone Unemployment Rate (m/m) at 12:00 (GMT+2).

The GBP/USD currency pair

Technical indicators of the currency pair:
  • Prev Open: 1.3527
  • Prev Close: 1.3588
  • % chg. over the last day: +0.45%

Growth in the UK construction sector slowed due to the Omicron spread in December. On Saturday, the UK Prime Minister Boris Johnson urged the UK public to get vaccinated against COVID-19 as the number of deaths in the country exceeded 150,000. A series of reports showed that the UK economy would face difficulties in the spring as strong consumer price increases have already hit disposable income and undermined consumer confidence.

Trading recommendations
  • Support levels: 1.3551, 1.3465, 1.3396, 1.3352, 1.3257, 1.3220
  • Resistance levels: 1.3583, 1.3685

On the hourly time frame, the GBP/USD trend is bullish. The price is now traded in a wide corridor. The MACD indicator is still signaling divergence. Under such market conditions, traders should consider buy positions from the 1.3551 support level but only with additional confirmation in the form of a buyers’ initiative. Sell trades can be considered from the resistance level of 1.3583 after a new initiative from the sellers.

Alternative scenario: if the price breaks down through the 1.3465 support level and consolidates below, the bearish scenario will likely resume.

GBP/USD
There is no news feed for today.

The USD/JPY currency pair

Technical indicators of the currency pair:
  • Prev Open: 115.82
  • Prev Close: 115.52
  • % chg. over the last day: -0.26%

On Friday, Japanese Finance Minister Shunichi Suzuki said that the national currency should be stable. Domestic media and some market participants have warned of the potential downside of a weak yen, which raises import prices and household living costs. Japanese policymakers have traditionally favored a weak yen because it gives exporters a competitive advantage. Analysts at J.P. Morgan believe the yen, which has fallen to its lowest level in 50 years, will continue to fall, reducing consumer purchasing power.

Trading recommendations
  • Support levels: 115.64, 115.34, 115.09, 113.74
  • Resistance levels: 116.08, 116.50

The global USD/JPY currency pair trend is bullish. The MACD indicator has become inactive. The price is now trading in a price range, and a false breakdown zone was formed. It is best to look for buy deals from the support level of 115.64. Sell positions are better to look from the resistance level of 116.08, but only with confirmation and with short targets.

Alternative scenario: if the price fixes below 115.09, the uptrend will likely be broken.

USD/JPY
There is no news feed for today.

The USD/CAD currency pair

Technical indicators of the currency pair:
  • Prev Open: 1.2724
  • Prev Close: 1.2641
  • % chg. over the last day: -0.66%

A Reuters poll showed that the Canadian dollar would strengthen this year as the global economy recovered from the crisis, but the currency’s gains could be tempered by interest rate hikes by the Federal Reserve. The median forecast in the Reuters poll is that the Canadian dollar will strengthen to 1.26 per US dollar. The strengthening Canadian dollar is also supported by rising oil prices and the monetary policy of the Bank of Canada, which is likely to start raising interest rates in the near future. The Canadian dollar was the only currency from the G10 countries to strengthen against the US dollar in 2021.

Trading recommendations
  • Support levels: 1.2628, 1.2598
  • Resistance levels: 1.2681, 1.2715, 1.2792, 1.2824, 1.2903, 1.2951

From a technical point of view, the USD/CAD currency pair has changed to bearish. Friday’s increase in oil prices and the decline in the dollar index on non-farm reports led to the strengthening of the Canadian dollar. The MACD indicator is in the negative zone. Under such market conditions, it is better to look for buy trades from 1.2628, but after additional confirmation in the form of the buyers’ initiative. It is best to look for sell deals from the resistance levels around the moving average.

Alternative scenario: if the price breaks through the 1.2792 resistance level and fixes above, the downtrend is likely to be broken.

USD/CAD
There is no news feed for today.

by JustForex


This article reflects a personal opinion and should not be interpreted as an investment advice, and/or offer, and/or a persistent request for carrying out financial transactions, and/or a guarantee, and/or a forecast of future events.

EUR/USD Keep Falling

By Dmitriy Gurkovskiy, Chief Analyst at RoboForex

The major currency pair is falling after demonstrating some growth last week. The asset is mostly trading at 1.1330.

Market players are still processing the FOMC Meeting Minutes published last Wednesday. The document says that the benchmark interest rate may be raised sooner than expected earlier due to constantly increasing inflation. It also mentions that the QE programme may be closed as early as March instead of June as it was announced in the past.

Investors also paid attention to the regulator’s comments that it didn’t exclude a possibility of decreasing its own balance right after the rate hike. In fact, it may happen in the first half of 2022, which means that the liquidity ratio will drop.

In the H4 chart, EUR/USD has finished another ascending wave at 1.1363. Possibly, today the pair may correct to reach 1.1310 and then grow towards 1.1333, thus forming a new consolidation range. If later the price breaks this range to the upside, the market may resume growing towards 1.1400; if to the downside – start a new decline with the target at 1.1200. From the technical point of view, this scenario is confirmed by MACD Oscillator: its signal line is moving above 0 and may later resume falling to return to this level.

As we can see in the H1 chart, after completing the ascending wave at 1.1361 and rebounding from this level, EUR/USD is correcting and the first correctional wave is expected to reach 1.1310. Later, the market may grow towards 1.1333. From the technical point of view, this idea is confirmed by the Stochastic Oscillator: its signal line is moving below 20, thus indicating a further downtrend in the price chart.

Disclaimer

Any forecasts contained herein are based on the author’s particular opinion. This analysis may not be treated as trading advice. RoboForex bears no responsibility for trading results based on trading recommendations and reviews contained herein.

The Decoupling of the US Dollar-Yuan Relationship?

By Dan Steinbock

In the past, US dollar and Chinese yuan used to move inversely. Recently, that has not been the case. Dollar is appreciating, and so is yuan. Are the bilateral currencies decoupling?

In early December, Chinese business and finance media Caixin reported that Chinese yuan has “broken its traditional relationship with the U.S. dollar.”

The breakup was characterized as an “unusual currency decoupling, which has been evident since September.”

The real story, however, is nuanced, complex and not just about currencies.

The Dollar-Yuan Divergence

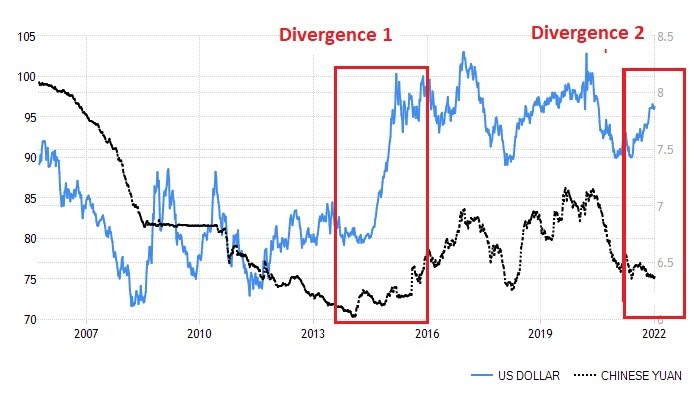
The Caixin report attracted great attention internationally. After all, the relationship between the yuan and the dollar has been relatively consistent since the mid-2010s, as measured by the US Dollar Index (DXY), which reflects the value of the dollar relative to a basket of currencies of some of America’s biggest trading partners.

Caixin traced the decoupling back to September 2021. It was visualized with a 1-year timeline. And sure enough, the yuan seems to mimic the dollar’s trajectory until late September 2021, which is followed by significant divergence (Figure 1a).

Nonetheless, the current divergence is not the first of its kind. It was preceded by another in the mid-2010s, when the Fed began its gradual exit from ultra-low rates. The dollar soared after the 2015 Chinese market correction until the self-induced double-whammy: US trade wars and pandemic mismanagement (Figure 1b).

Figure 1 Decoupling Yuan-Dollar Relationship

  • 1-Year Perspective

chinese yuan us dollar

  • 15-Year Perspective

chinese yuan us dollar

Forces Behind Decoupling

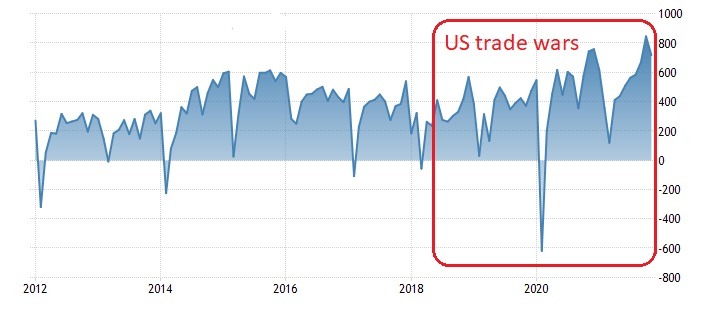
There are multiple central economic drivers behind the current decoupling, particularly trade balance. The yuan’s recent appreciation has been explained on the basis of China’s strong export performance. In November, exports exceeded $300 billion for a third straight month (22% from the previous year). Yet, imports grew even faster to $254 billion (32%). Export growth has slowed on the back of a stronger yuan, and weakening demand due to the Omicron wave and higher costs.

Overall, the drivers of the trade surplus have narrowed, although it remains strong in a 10-year perspective, despite US trade war (Figure 2).

Figure 2 China’s Trade Balance (2012-Present)

chinese yuan us dollar

Decoupling has been reinforced by strong capital flows, thanks to China’s encouragement of foreign direct investment (FDI) and further opening of capital markets. In the first three quarters of 2021, China’s actual utilization of FDI climbed to almost $130 billion (25% year-on-year). Meanwhile, overseas investors have raised their holdings of mainland stocks and bonds by over 11% since the end of 2020, according to data by the People’s Bank of China (PBOC).

Foreign investment was strong (17%) in the first 11 months of 2021, including into the service sector and particularly advanced technology (19%). In relative terms, FDI into China from the Belt and Road (25%) and ASEAN economies (24%) surged even faster, according to data by China’s Ministry of Commerce.

Bumpy normalization

Even if the Fed’s rate normalization will reduce capital flows to Chinese markets, the continued opening of the mainland’s financial sector may offset some of the pressure. FDI into China is also likely to be resilient, due to capital inflows from the Belt and Road and ASEAN economies.

What complicates assessments of potential dollar-yuan decoupling is the impact of pandemic uncertainty on monetary policies and rates.

Last October, the PBOC stated it was phasing out the use of the countercyclical factor, launched in 2017 to contain yuan’s depreciation. A more hands-off stance toward the exchange rate fosters appreciation. As the PBOC has signaled, the yuan may face a rougher ride in 2022, due to normalization by overseas central banks.

Also, higher interest rates could narrow the yield spread between US Treasuries and Chinese government bonds. The former has traded around 1.6% and is expected to rise. Chinese government bond is currently around 2.8% and could climb to 2.95% in 2022. The gap could increase if the PBOC decides to tighten (Figure 3).

Figure 3 The Yield Difference: US and China Government Bonds (10Y)

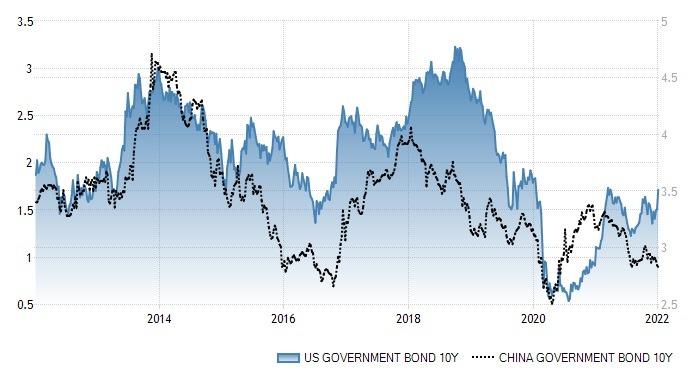
In November, U.S. inflation surged to near 40-year high, at 6.8%. Only days later, the Fed indicated it would end its pandemic-era bond purchases in March, thus paving the way for two to three interest rate hikes by the end of 2022.

Pandemic Uncertainty

After the new year, the U.S. reported almost 1.1 million new daily COVID-19 cases, a new global record. The death toll surpassed 800,000. Consequently, the supply disruptions and labor shortages that most countries have seen in the past months will not diminish overnight. And that has significant implications.

Political polarization is likely to escalate, particularly by the US mid-term election in November. Political violence then or in 2022 can no longer be excluded.

Moreover, the Fed and other major central banks have consistently underestimated the persistence of inflation, which was initially seen as merely “transitory.”

These effects could significantly worsen, if the assumption that Omicron is the last hold of the pandemic proves flawed. Despite current surges in the US, Europe, Brazil, India and elsewhere, most observers assume that Omicron trajectories will emulate the South African experience: rapid peak, then speedy decline.

In reality, the global pandemic has changed every few months since spring 2020 from the initial virus to the UK variant, superseded by the Delta and Omicron. The number of the vaccinated has increased significantly. Yet, the pandemic effects may linger for months, perhaps years, due to inadequate global cooperation, vaccine inequality and the huge numbers of the unvaccinated (35 million even in the US).

If the next variant proves highly transmissible, as Omicron, and far more lethal than Delta, it will derail all current economic projections.

From Stagflation to Stagflation

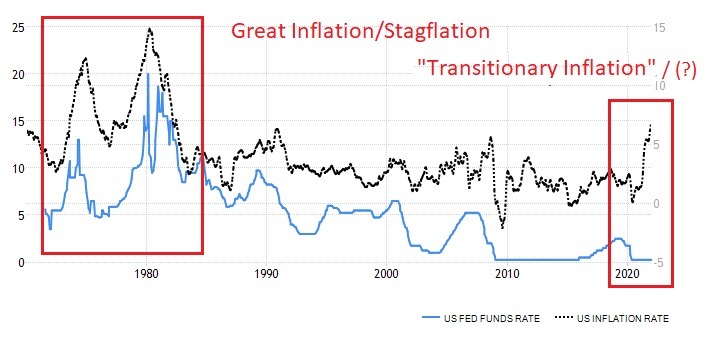
In the US, inflation and federal funds have moved fairly synchronously in the past half century. The current combination of low rates and high inflation is untenable. In the 1970s, the Great Inflation, following two energy crises, morphed into persistent stagflation. In the 2020s, transitionary inflation may prove not-so-transitionary, especially coupled with secular stagnation in the US, Western Europe and Japan (Figure 4).

Figure 4 Two Untenable Trajectories

Rate-Inflation (1970-Present)

In the 1980s, the Reagan rearmament drive deferred the awakening. In the 2020s, US pivot to Asia and new Cold Wars seem to serve a similar function. When economics no longer offers exit strategy, geopolitics does.

After all, the current stagflation has been fueled by the Fed’s ultra-easy monetary policy and the Trump-Biden trade war, both of which are contributing to higher prices. The resulting high inflation cannot be subdued without rate normalization.

When the Fed in 2008 opted for ultra-low rates and rounds of QE, it took a risky path that has suck it into a money-printing quagmire. As Thomas Hoenig, former member of the Fed’s top policy committee (FOMC), has stressed, the Fed may not be able to easily escape without destabilizing the entire financial system.

And the Chinese yuan? In 2022, it will face centrifugal pressures but fundamentals do not warrant disruptive changes. In November, the weakness of other major world currencies pushed the CFETS RMB Index, China’s version of the US Dollar Index, at a record-high of 102.8. Chinese yuan is propelling emerging currencies unlike ever before.

In the longer-term, US dollar and Chinese yuan will decouple. In the short-term, uncertainties reign. And they are not just about economics anymore.

About the Author:

Dr. Dan Steinbock is an internationally recognized strategist of the multipolar world and the founder of Difference Group. He has served at India, China and America Institute (US), Shanghai Institutes for International Studies (China) and the EU Center (Singapore). For more, see https://www.differencegroup.net/  

The original commentary was published by China-US Focus on Jan 7, 2021