Archive for Forex and Currency News – Page 173

The Analytical Overview of the Main Currency Pairs on 2022.02.08

by JustForex

The EUR/USD currency pair

Technical indicators of the currency pair:
  • Prev Open: 1.1462
  • Prev Close: 1.1441
  • % chg. over the last day: -0.18%

A stronger-than-expected US jobs report last week underscored the focus on inflation. Investors are in no hurry to open new positions ahead of US inflation data. Strong consumer growth will force the Fed to accelerate its tightening policy. Since no important economic events are expected until Thursday, the EUR/USD currency pair will be trading in a wide flat, possibly with a slight advantage in favor of a stronger dollar.

Trading recommendations
  • Support levels: 1.1414, 1.1362, 1.1329, 1.1275
  • Resistance levels: 1.1481, 1.1534, 1.1617

From the technical point of view, the EUR/USD on the hourly time frame is bullish. The EUR/USD currency pair is trading in the wide corridor of 1.1414-1.1481, but there is a slight sellers’ pressure to the lower boundary. Under such market conditions, buy trades should be looked for after a small pullback to the moving average line because the price has deviated strongly from the average values. Sell trades are better to look for on intraday time frames from the upper boundary of the corridor, but only with short targets.

Alternative scenario: if the price breaks out through the 1.1275 support level and fixes below, the mid-term uptrend will likely be broken.

EUR/USD
There is no news feed for today.

The GBP/USD currency pair

Technical indicators of the currency pair:
  • Prev Open: 1.3531
  • Prev Close: 1.3535
  • % chg. over the last day: -0.03%

The British pound now has fundamental support from the Bank of England because when interest rates rise, the national rate strengthens in the medium term. However, it should not be forgotten that the Fed is also preparing to raise interest rates since March and may do so more aggressively if Thursday’s inflation data turns out to be worse than expected.

Trading recommendations
  • Support levels: 1.3475, 1.3457, 1.3434
  • Resistance levels: 1.3550, 1.3583, 1.3619, 1.3639, 1.3662

On the hourly time frame, the trend on GBP/USD is bullish. But the price has now locally corrected to the moving average, with the MACD indicator becoming inactive. Under such market conditions, buy trades should be looked at from the support level 1.3475. There are no optimal entry points for sell deals now.

Alternative scenario: if the price breaks out through the 1.3475 support level and consolidates below, the bullish scenario will be broken.

GBP/USD
There is no news feed for today.

The USD/JPY currency pair

Technical indicators of the currency pair:
  • Prev Open: 115.26
  • Prev Close: 115.09
  • % chg. over the last day: -0.15%

The monetary policy of the Bank of Japan is now aimed at making the JPY cheaper due to the maximum stimulus, while the Fed is tightening monetary policy and may do it more aggressively if Thursday’s inflation data turns out to be disappointing. In the medium term, the USD/JPY quotes will rise.

Trading recommendations
  • Support levels: 115.15, 114.96, 114.76
  • Resistance levels: 115.73, 116.08

The global trend on the USD/JPY currency pair is bullish. The Japanese yen keeps getting cheaper amid the rising dollar index and due to the ultra-soft monetary policy of the Bank of Japan. Under such market conditions, it is best to look for buy deals on the lower time frames from the support level of 115.15. Sell potions can be looked for at the nearest resistance levels, but only with short targets and additional confirmation.

Alternative scenario: if the price fixes below 114.76, the uptrend will likely be broken.

USD/JPY
There is no news feed for today.

The USD/CAD currency pair

Technical indicators of the currency pair:
  • Prev Open: 1.2745
  • Prev Close: 1.2664
  • % chg. over the last day: -0.64%

The Canadian dollar is a commodity currency, so it depends not only on the monetary policy of the Bank of Canada but also on the oil prices and the dollar index. The outlook for the Canadian dollar is getting more bullish as oil trades at its 7-year highs, and there are all the prerequisites for further growth. The fundamental picture is that both the dollar index and oil prices will increase. That is why it is not worth waiting for the USD/CAD to show a medium-term trend at the moment.

Trading recommendations
  • Support levels: 1.2649, 1.2586, 1.2506
  • Resistance levels: 1.2729, 1.2792

From a technical point of view, the USD/CAD currency pair is bullish. But yesterday, the price corrected back deeply into the corridor, where there was an impulse exit. As a rule, such a return is not good for continuing the movement, so it’s very likely that the price will now form a new, wider flat. Under such market conditions, it is better to look for buy trades on the lower time frames from the support levels of 1.2649. There are no optimal entry points to sell deals now.

Alternative scenario: if the price breaks through the 1.2649 support level and fixes below, the downtrend is likely to resume.

USD/CAD
There is no news feed for today.

by JustForex


This article reflects a personal opinion and should not be interpreted as an investment advice, and/or offer, and/or a persistent request for carrying out financial transactions, and/or a guarantee, and/or a forecast of future events.

Volatility in financial markets declines ahead of the release of US inflation data

by JustForex

US stock indices mainly decreased on Monday. At the close of the stock exchange, the Dow Jones (US30) remained at the same level, the S&P500 (US500) fell by 0.37%, and the NASDAQ (US100) tech index lost 0.58%.

Tom Lee, the founder of the research company Fundstrat, believes that the US stock market will experience a rapid rally in February amid market sensitivity after the collapse. The expert predicts that by the end of the first half of 2022, the S&P500 (US500) may jump above 4850 points, which is 8% above current levels.

This week, investors’ attention is focused on US consumer price data for January, released on Thursday. Forecasts show that markets expect another rise in inflation, which could be a strong argument for the Fed to tighten monetary policy more quickly. This mainly concerns the 0.5% interest rate hike at the March meeting.

The corporate reporting season is coming to an end. About 75% of S&P500 index companies have already reported for the previous quarter, and their profits on average exceeded market forecasts by 8%. But many companies failed to meet investors’ expectations. This week, Pfizer, KKR, Uber, Walt Disney, Coca-Cola, PepsiCo, and Twitter will have their quarterly reports.

This week, a delegation of senior US officials, including representatives from the Treasury Department, the State Department, and the Commerce Department, will visit European countries (United Kingdom, France, Belgium, and Germany). They will discuss the coordination of possible sanctions and export controls that the US and its allies might impose in the event of a Russian invasion of Ukraine.

European stock indices mostly rose yesterday. German DAX (DE30) gained 0.71%, French CAC 40 (FR40) jumped by 0.83%, British FTSE 100 (UK100) added 0.76%, but Spanish IBEX 35 (ES35) decreased by 0.36%.

During a visit to Washington, German Chancellor Olaf Scholz told reporters that by 2045 Germany plans to go completely CO2 emission-free. As part of the strategy to fight climate change, Germany has decided in a short period of 25 years to completely abandon the use of oil, coal, and gas. According to the chancellor, new decisions will be made as early as this year to expand wind energy, solar power plants, and developments in the field of hydrogen energy.

Crude oil prices fell for the first time in seven sessions after reports of a high possibility of a US-Iran nuclear deal following talks that dragged on for more than a year. “WTI crude oil could fall as low as $82-$85 a barrel if we continue to get positive headlines about talks with Iran,” said John Kilduff, a partner at New York-based energy hedge fund Again Capital.

Asian markets don’t show a single dynamic on Tuesday. Japan’s Nikkei 225 (JP225) added 0.13%, Australia’s S&P/ASX 200 (AU200) increased by 1.07%, and Hong Kong’s Hang Seng (HK50) decreased by 0.73% today.

Trading of Chinese biotechnology company Wuxi Biologics (Cayman) Inc. was suspended in Hong Kong after a sharp drop of 32% due to the US authorities adding the company to the “suspicious list.”

Former Reserve Bank of Australia Governor John Edwards said the Reserve Bank of Australia (RBA) could raise its key rate four times in 2022, given the economy’s current upward trajectory. He also noted that the RBA is likely to make the first rate hike in August.

Main market quotes:

S&P 500 (F) (US500) 4,483.87 -16.66 (-0.37%)

Dow Jones (US30) 35,091.13 +1.39 (+0.004%)

DAX (DE40) 15,206.64 +107.08 (+0.71%)

FTSE 100 (UK100) 7,573.47 +57.07 (+0.76%)

USD Index 95.44 -0.04 (-0.04%)

Important events for today:
  • – New Zealand RBNZ Gov Orr’s Speech at 04:15 (GMT+2).

by JustForex


This article reflects a personal opinion and should not be interpreted as an investment advice, and/or offer, and/or a persistent request for carrying out financial transactions, and/or a guarantee, and/or a forecast of future events.

Important Calculations In Forex Trading – FREE Live Webinar!

By Orbex

forex trading

Calling all beginner Forex traders! We’ve put together a comprehensive webinar dedicated to teaching you how to trade the financial markets!

Next Monday, February 14th at 6 pm GMT, our seasoned market expert David Kindley will be going live on Zoom to cover all the basic forex calculations you need to begin your online trading journey.

Sign up now for a chance to learn:

  • How to calculate margins when trading
  • How to include leverages into your trades
  • How to calculate pips and points
  • How to set pending orders

The webinar is free to attend, but seats are limited.

Book your spot today to start trading responsibly!

Register Now!


Orbex-LogoArticle by Orbex

Orbex is a fully licensed broker that was established in 2011. Founded with a mission to serve its traders responsibly and provides traders with access to the world’s largest and most liquid financial markets. www.orbex.com

AUDUSD Is The Primary Triple Three Ⓧ Wave Ending?

By Orbex

AUDUSD

The AUDUSD currency pair shows the formation of a long-term descending triple combination consisting of primary sub-waves Ⓦ-Ⓧ-Ⓨ-Ⓧ-Ⓩ.

Not so long ago, wave Ⓨ, which is a triple zigzag, ended. This included intermediate sub-waves (W)-(X)-(Y)-(X)-(Z), marked with blue letters in parentheses.

If we take a closer look at the primary intervening wave Ⓧ, we will see that it is a triple three. Wave Ⓨ consists of intermediate sub-waves (W)-(X)-(Y)-(X)-(Z).

At the moment, the development of the last intermediate wave (Z) is taking place, in which we see minor sub-waves A-B-C. A and B have already been built, and C is now under construction.

In the upcoming trading days, prices will rise in the impulse wave C to the 0.730 level. The target is determined by the previous maximum formed by the wave (Y).

AUDUSD

An alternative option indicates that the primary intervening wave Ⓧ could complete earlier at the top of the chart. After that, the decline in the wave Ⓩ will begin. This wave consists of intermediate sub-waves (W)-(X)-(Y), where (W) and (X) are fully complete.

The intermediate wave (Z) is currently under construction. For us, this wave is of the greatest interest now, because it is not complete yet, and it has a complex internal structure.

In fact, sub-waves W-X-Y in (Z) and W have taken the form of a triple zigzag.

Apparently, the development of the minor wave Y, which can end near 0.688, is now taking place. At that level, the entire intermediate wave (Y) will be at 76.4% of wave (W), so the completion of the minor Y in this area is very likely.


Orbex-LogoArticle by Orbex

Orbex is a fully licensed broker that was established in 2011. Founded with a mission to serve its traders responsibly and provides traders with access to the world’s largest and most liquid financial markets. www.orbex.com

Intraday Market Analysis – USD Regains Momentum

By Orbex

USDCHF bounces higher

USDCHF

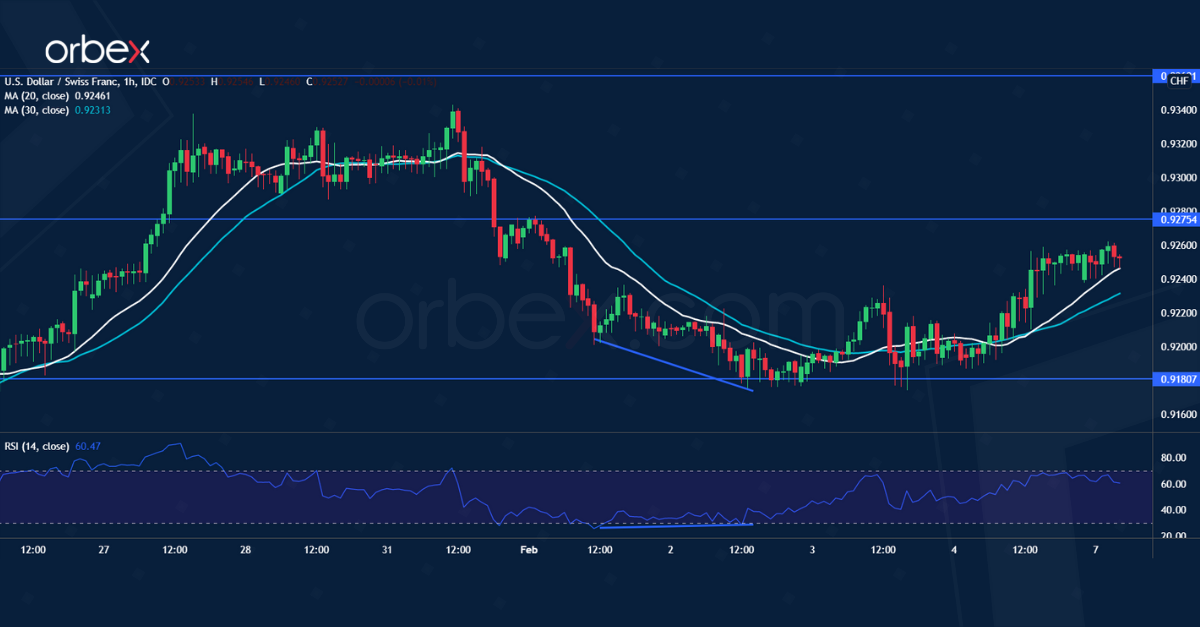
The US dollar rallied after January’s nonfarm payrolls exceeded expectations. The latest pullback found support near the previous low at 0.9180.

A bullish RSI divergence suggests a loss of momentum in the sell-off. A close above 0.9275 would force short-term sellers to cover and pave the way for a broader rebound.

Then the double top (0.9360) on the daily chart would be the next target. On the downside, a bearish breakout may send the pair to 0.9110.

USDCAD awaits breakout

USDCAD

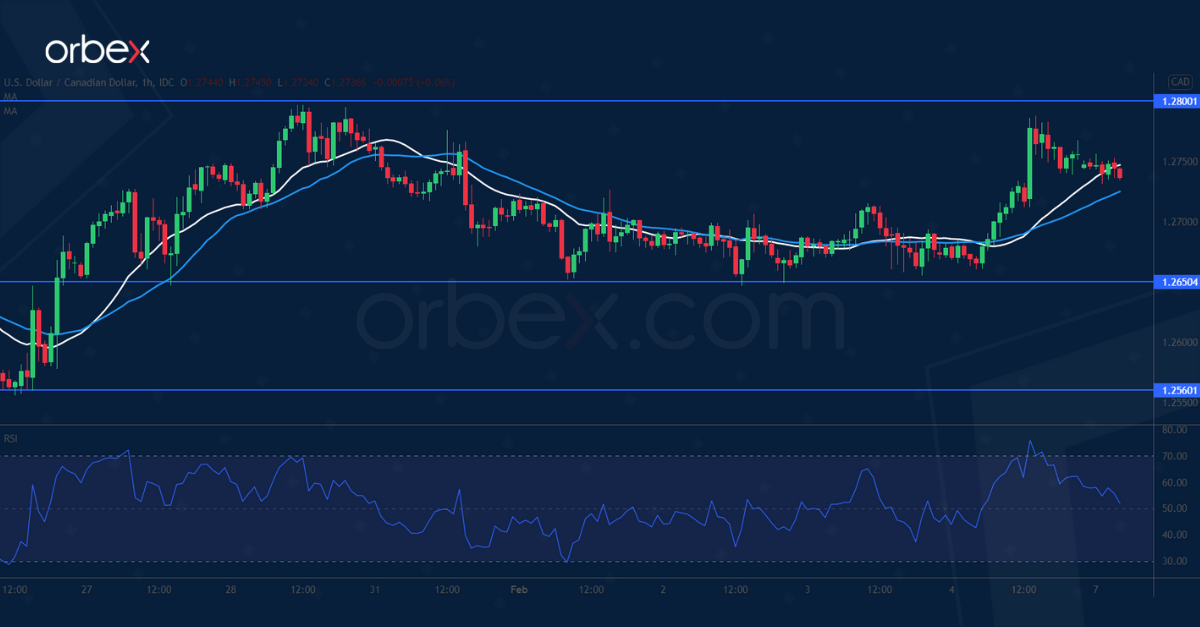
The loonie weakened after a rise in Canada’s unemployment rate in January. The greenback has previously come to a halt at the daily resistance (1.2800).

The retracement then found bids at the resistance-turned-support at 1.2650, suggesting traders’ strong interest in keeping the two-week-long rally intact. The RSI has inched into the overbought territory and may drive the price lower with short-term profit-taking.

A bullish breakout may extend the uptrend to December’s peak at 1.2950.

GER 40 lacks support

GER 40

The Dax 40 drifts lower after the ECB’s hawkish turn. The recent rebound met stiff selling pressure at 15740. Then a fall below 15350 indicates a lack of commitment from the buy-side.

A bearish MA cross suggests an acceleration to the downside and may attract more bears. The demand area around 14850 is a critical floor on the daily chart. Its breach could trigger a bearish reversal in the medium term.

An oversold RSI may cause a limited bounce. The bulls need to reclaim 15500 in order to turn sentiment around.


Orbex-LogoArticle by Orbex

Orbex is a fully licensed broker that was established in 2011. Founded with a mission to serve its traders responsibly and provides traders with access to the world’s largest and most liquid financial markets. www.orbex.com

Fibonacci Retracements Analysis 07.02.2022 (GOLD, USDCHF)

Article By RoboForex.com

XAUUSD, “Gold vs US Dollar”

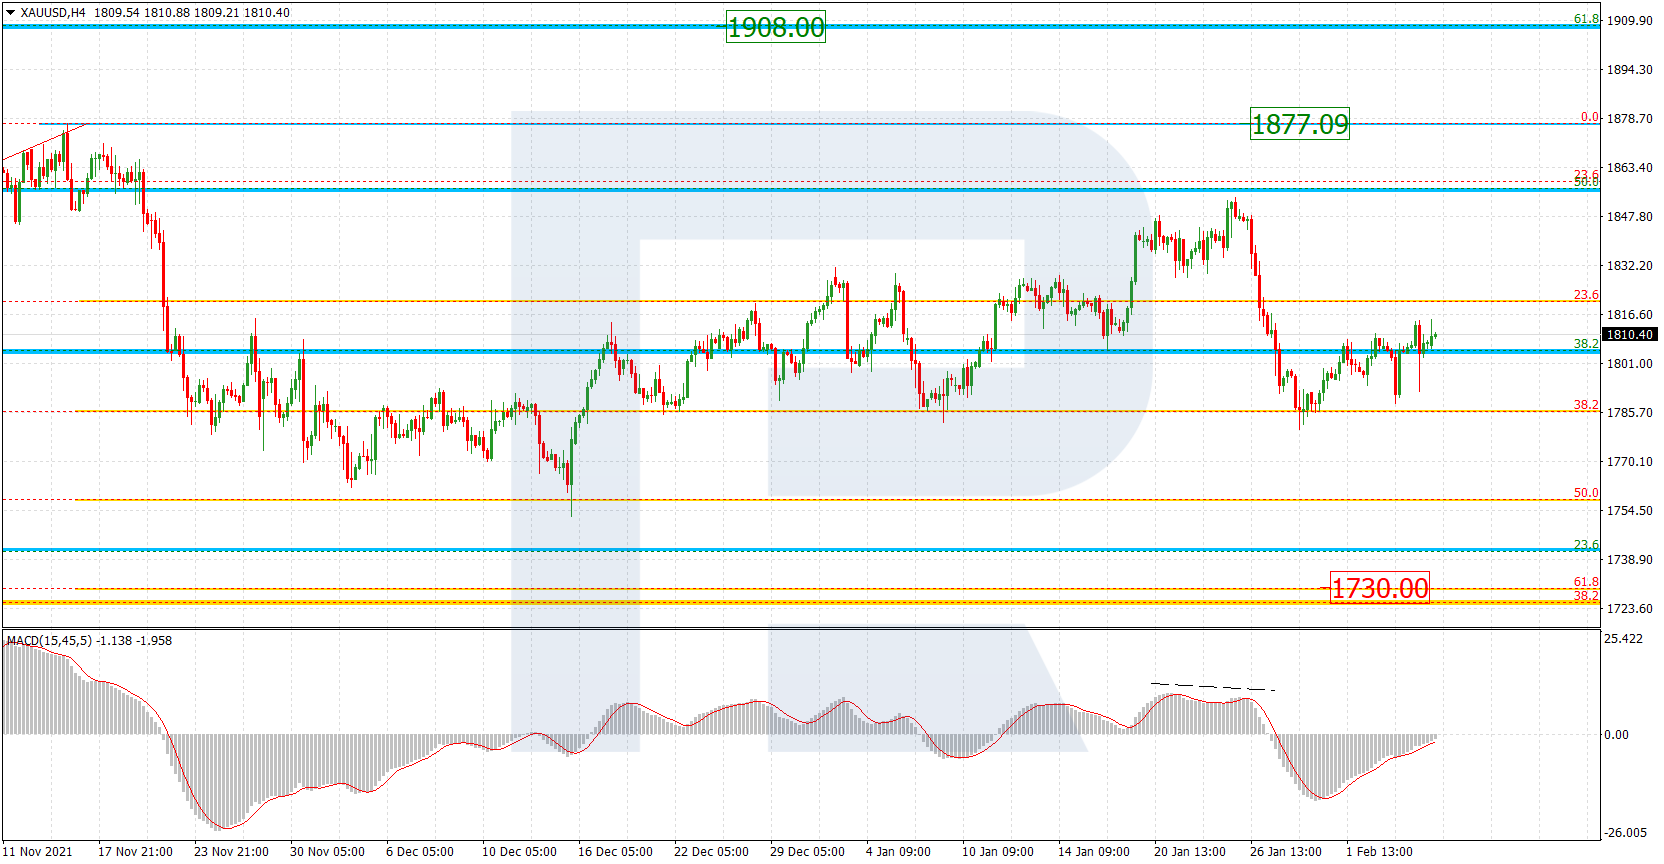
As we can see in the H4 chart, the asset is correcting upwards after plummeting before. Divergence on MACD, which made the pair form the first descending wave earlier, may force the second one. The closest downside target may be 61.8% fibo at 1730.00. However, an alternative scenario implies that the current ascending correction may transform into a proper rising wave to reach the high at 1877.09, a breakout of which may lead to a further uptrend towards the long-term 61.8% fibo at 1908.00.

GOLD_H4
Risk Warning: the result of previous trading operations do not guarantee the same results in the future

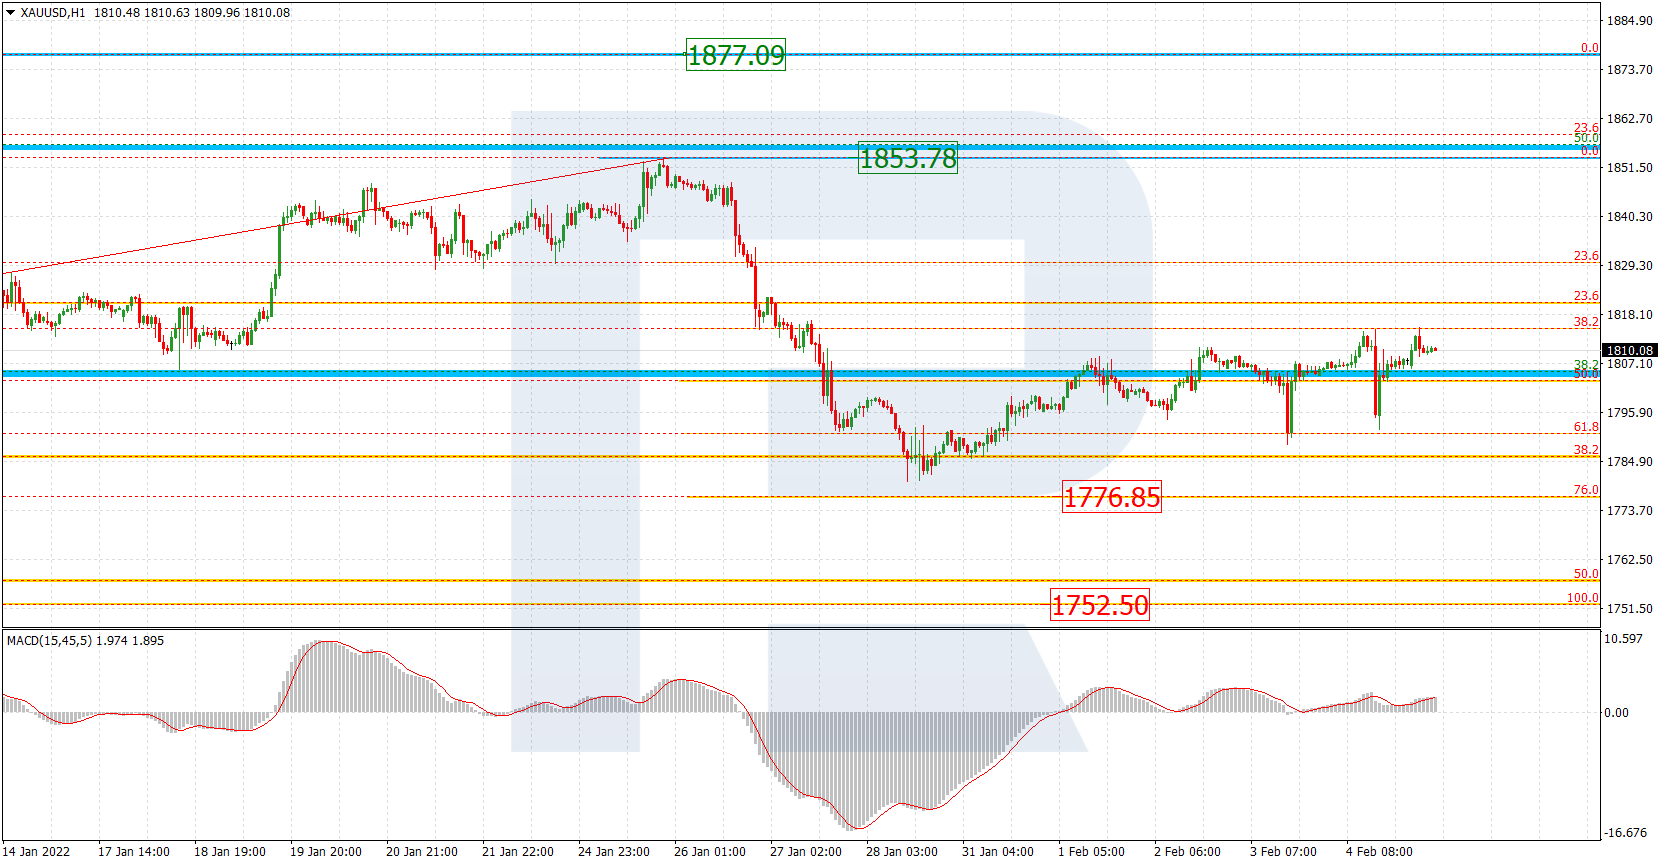
The H1 chart shows a more detailed structure of the current ascending correction within the downtrend. After breaking 61.8% fibo, the pair started a pullback, which has already returned to 38.2% fibo. After the pullback is over, the asset is expected to resume falling towards 76.0% fibo at 1776.85 and then the low at 1752.50. The local resistance is at 1853.78.

GOLD_H1
Risk Warning: the result of previous trading operations do not guarantee the same results in the future

USDCHF, “US Dollar vs Swiss Franc”

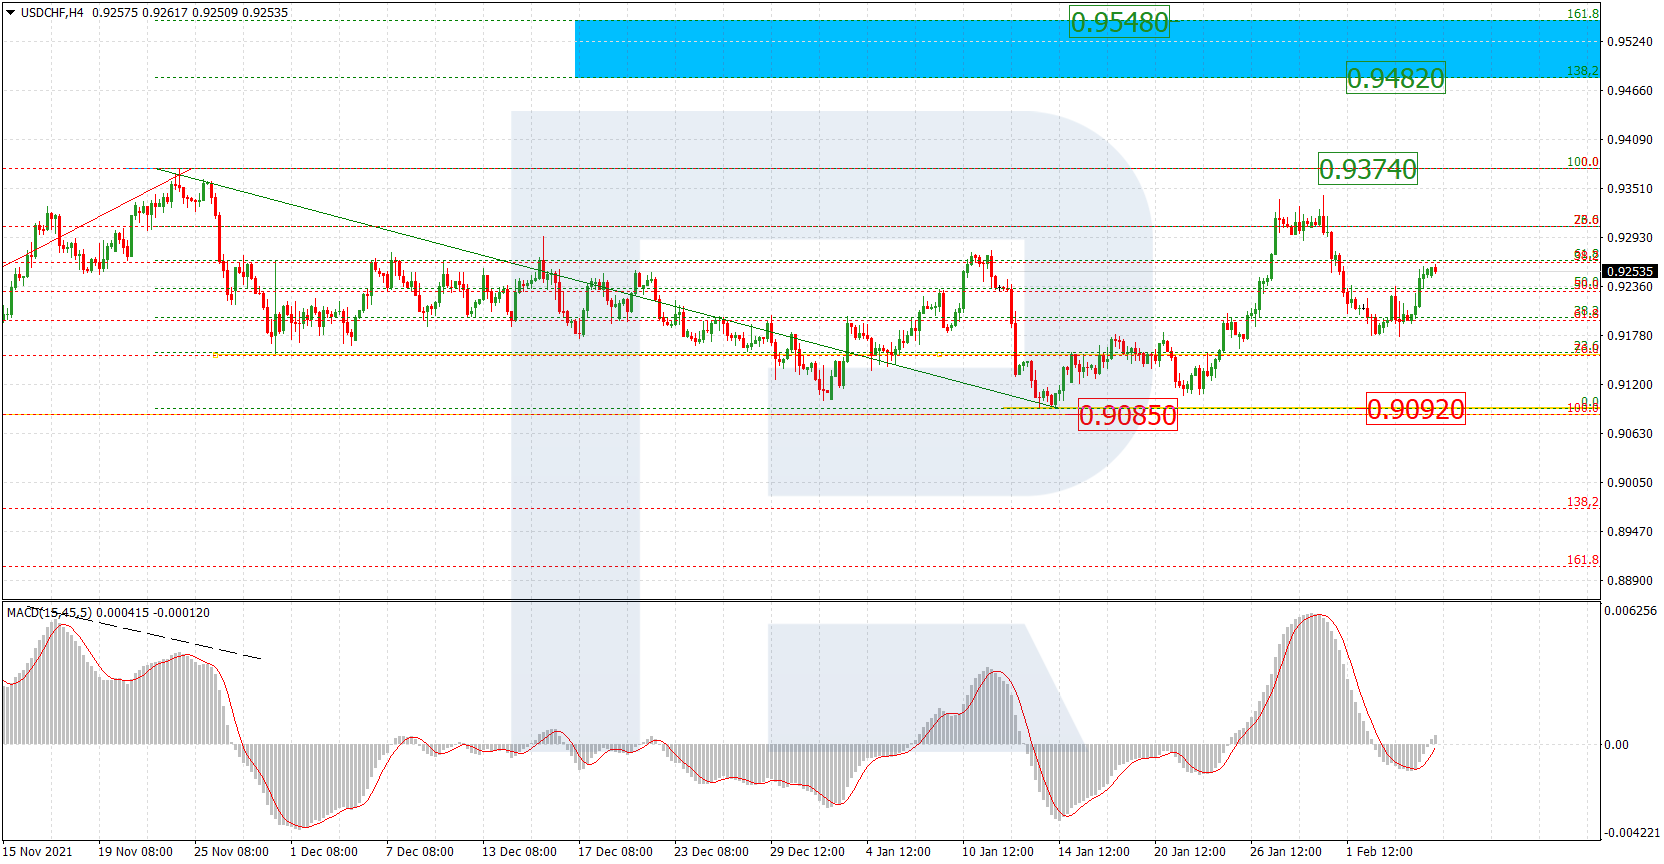
As we can see in the H4 chart, USDCHF is forming another rising impulse within the mid-term uptrend; the previous impulse reached 76.0% fibo but then the pair was made to return to 38.2% fibo. If the price breaks the high at 0.9374, the instrument may continue growing towards the post-correctional extension area between 138.2% and 161.8% fibo at 0.9482 and 0.9548 respectively. The support is at 0.9092.

USDCHF_H4
Risk Warning: the result of previous trading operations do not guarantee the same results in the future

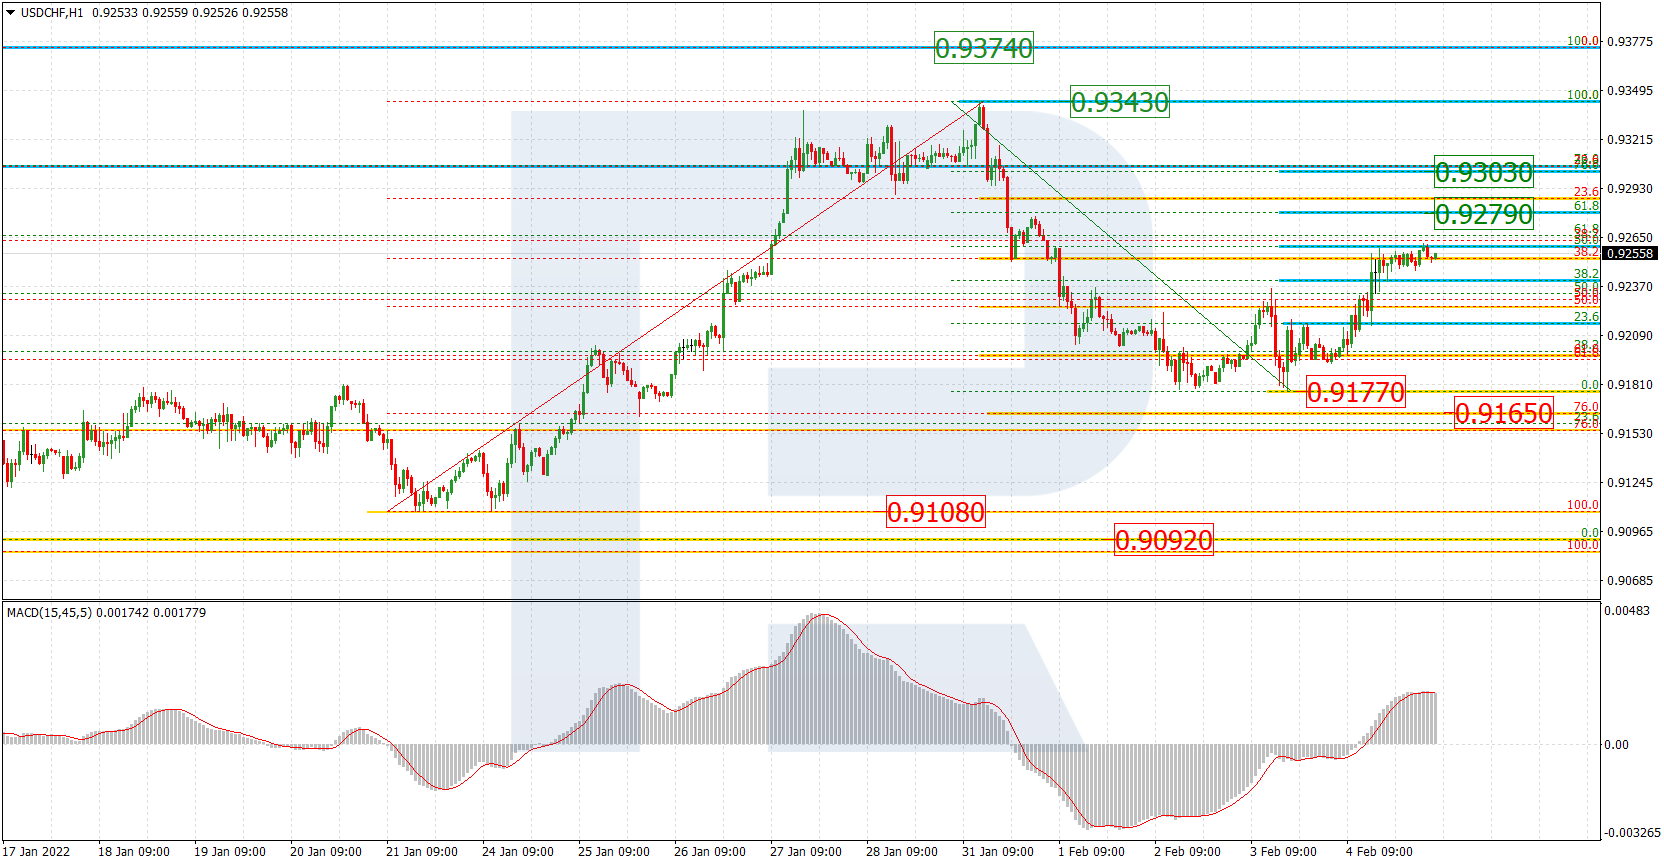
The H1 chart shows that after reaching 61.8% fibo, the descending wave was followed by a new ascending structure, which has already reached 50.0% fibo and may later continue towards 61.8% and 76.0% fibo at 0.9279 and 0.9303 respectively. If USDCHF breaks the local high at 0.9343, it may continue growing to reach the key one at 0.9374. An alternative scenario implies that the asset may yet continue falling towards 76.0% fibo and the low at 0.9165 and 0.9108, but it’s quite unlikely.

USDCHF_H1

Article By RoboForex.com

Attention!
Forecasts presented in this section only reflect the author’s private opinion and should not be considered as guidance for trading. RoboForex LP bears no responsibility for trading results based on trading recommendations described in these analytical reviews.

Ichimoku Cloud Analysis 07.02.2022 (USDCHF, AUDUSD, USDJPY)

Article By RoboForex.com

USDCHF, “US Dollar vs Swiss Franc”

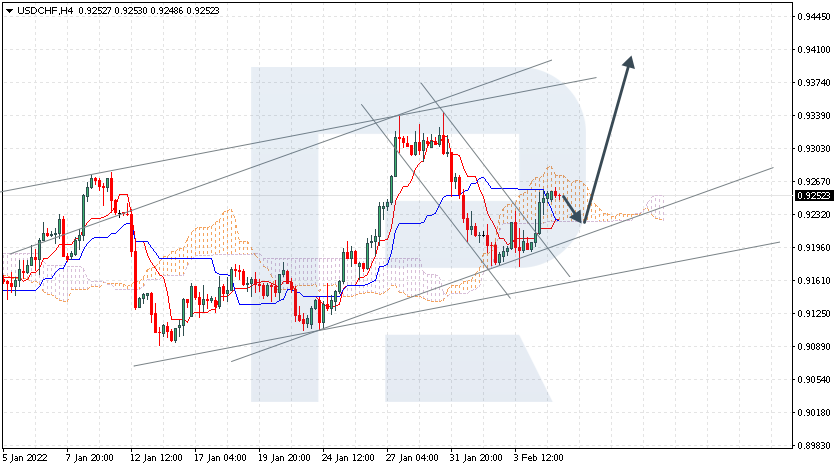
USDCHF is trading at 0.9252; the instrument is moving inside Ichimoku Cloud, thus indicating a sideways tendency. The markets could indicate that the price may test the cloud’s downside border at 0.9230 and then resume moving upwards to reach 0.9410. Another signal in favour of a further uptrend will be a rebound from the bullish channel’s downside border. However, the bullish scenario may no longer be valid if the price breaks the cloud’s downside border and fixes below 0.9175. In this case, the pair may continue falling towards 0.9080. To confirm further growth, the asset must break the cloud’s upside border and fix above 0.9305.

USDCHF
Risk Warning: the result of previous trading operations do not guarantee the same results in the future

AUDUSD, “Australian Dollar vs US Dollar”

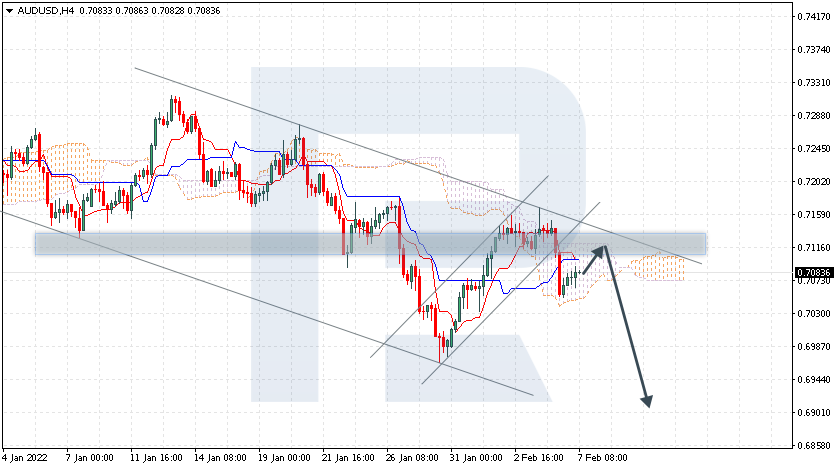
AUDUSD is trading at 0.7083; the instrument is moving inside Ichimoku Cloud, thus indicating a sideways tendency. The markets could indicate that the price may test the cloud’s upside border at 0.7115 and then resume moving downwards to reach 0.6905. Another signal in favour of a further downtrend will be a rebound from the resistance level. However, the bearish scenario may no longer be valid if the price breaks the cloud’s upside border and fixes above 0.7165. In this case, the pair may continue growing towards 0.7255. To confirm further decline, the asset must break the cloud’s downside border and fix below 0.7020.

AUDUSD
Risk Warning: the result of previous trading operations do not guarantee the same results in the future

USDJPY, “US Dollar vs Japanese Yen”

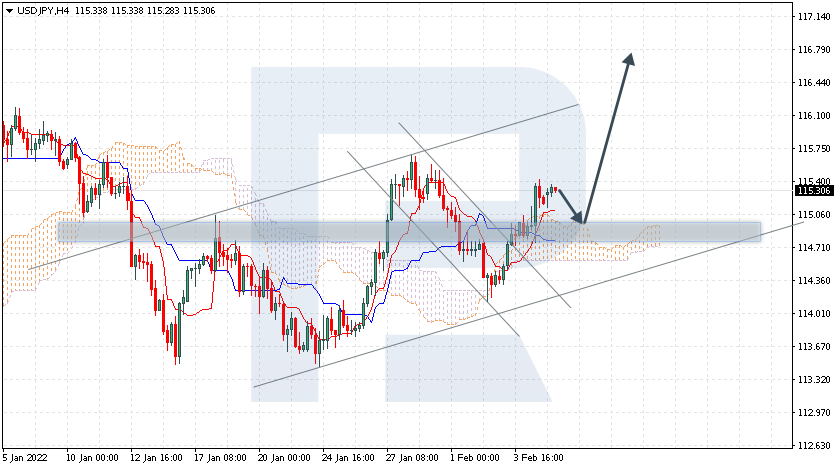
USDJPY is trading at 115.30; the instrument is moving above Ichimoku Cloud, thus indicating an ascending tendency. The markets could indicate that the price may test the cloud’s upside border at 115.05 and then resume moving upwards to reach 116.80. Another signal in favour of a further uptrend will be a rebound from the support level. However, the bullish scenario may no longer be valid if the price breaks the cloud’s downside border and fixes below 114.25. In this case, the pair may continue falling towards 113.15.

USDJPY

Article By RoboForex.com

Attention!
Forecasts presented in this section only reflect the author’s private opinion and should not be considered as guidance for trading. RoboForex LP bears no responsibility for trading results based on trading recommendations described in these analytical reviews.

The Analytical Overview of the Main Currency Pairs on 2022.02.07

by JustForex

The EUR/USD currency pair

Technical indicators of the currency pair:
  • Prev Open: 1.1434
  • Prev Close: 1.1450
  • % chg. over the last day: +0.14%

Klaas Knot, president of the Dutch Central Bank and a member of the European Central Bank’s Governing Council, said on Sunday that he expects the ECB to raise interest rates in the fourth quarter of this year. He supports cutting the Eurozone central bank’s asset purchase program as quickly as possible. In this case, the ECB must first complete its asset purchase programs, which must be reduced by 20 billion euros ($22.89 billion) per month by the fourth quarter.

Trading recommendations
  • Support levels: 1.1414, 1.1329, 1.1275
  • Resistance levels: 1.1481, 1.1534, 1.1617

From the technical point of view, the EUR/USD on the hour time frame is bullish. With the ECB starting to think about a rate hike this year, the euro reacted immediately with a rise. Under such market conditions, buy trades should be looked for after a small pullback because the price has deviated strongly from the average values. Sell trades are better to look for on intraday time frames, but only with short targets.

Alternative scenario: if the price breaks out through the 1.1275 support level and fixes below, the mid-term uptrend is likely to be broken.

EUR/USD
News feed for 2022.02.07:
  • – German Industrial Production (m/m) at 09:00 (GMT+2);
  • – ECB President Lagarde’s Speech at 17:45 (GMT+2).

The GBP/USD currency pair

Technical indicators of the currency pair:
  • Prev Open: 1.3595
  • Prev Close: 1.3526
  • % chg. over the last day: -0.51%

The Bank of England has already implemented two rate hikes of 0.25% and is set to make a third rate hike in March. Thus, the British pound will have fundamental support now as the national exchange rate strengthens in the medium term as interest rates rise. However, it should not be forgotten that the Fed has been preparing to raise the interest rates from March and may do it more aggressively, so the British pound will not have a big advantage over the dollar.

Trading recommendations
  • Support levels: 1.3524, 1.3457, 1.3434
  • Resistance levels: 1.3583, 1.3619, 1.3639, 1.3662

On the hourly time frame, the trend on GBP/USD is bullish. But the price has now locally corrected to the moving average, with the MACD indicator turning negative. Under such market conditions, buy trades should be looked at from the support level 1.3475. There are no optimal entry points for sell deals now.

Alternative scenario: if the price breaks out through the 1.3475 support level and consolidates below, the bullish scenario will be broken.

GBP/USD
There is no news feed for today.

The USD/JPY currency pair

Technical indicators of the currency pair:
  • Prev Open: 114.97
  • Prev Close: 115.18
  • % chg. over the last day: +0.18%

The monetary policy of the Bank of Japan is now aimed at making the JPY cheaper because of the maximum stimulus, while the Fed is tightening monetary policy. The Japanese yen can get a boost only in 2 cases. The first is if the Bank of Japan tightens its monetary policy. The second one is that investors will buy the yen as a safe-haven asset in case of various panic moods in the financial markets like it happened earlier this year.

Trading recommendations
  • Support levels: 115.15, 114.96, 114.59
  • Resistance levels: 115.73, 116.08

The global trend on the USD/JPY currency pair is bullish. The price has once again started to show a growth dynamic. Under such market conditions, it is best to look for buy deals on the lower time frames from the support level of 114.96. Sell potions can be looked for at the nearest resistance levels, but only with short targets and with additional confirmation.

Alternative scenario: if the price fixes below 114.59, the uptrend will likely be broken.

USD/JPY
There is no news feed for today.

The USD/CAD currency pair

Technical indicators of the currency pair:
  • Prev Open: 1.2673
  • Prev Close: 1.2763
  • % chg. over the last day: +1.00%

The Canadian dollar is a commodity currency, so it depends not only on the monetary policy of the Bank of Canada but also on oil prices and the dollar index. Oil prices added another 2% on Friday, but at the same time, the dollar index strengthened, and the Canadian labor market statistical data turned out to be disappointing, which provoked the increase in USD/CAD quotes. Now the fundamental picture is that both the dollar index and the oil prices will rise. That is why it is not worth waiting for the USD/CAD to show a medium-term trend at the moment.

Trading recommendations
  • Support levels: 1.2729, 1.2670, 1.2649, 1.2586, 1.2506
  • Resistance levels: 1.2792

From a technical point of view, the USD/CAD currency pair is bullish. The price has been trading flat for more than three days, but on Friday, there was an upward impulse. Under such market conditions, it is better to look for buy trades on the lower time frames from the support levels of 1.2729. There are no optimal entry points to sell deals now.

Alternative scenario: if the price breaks through the 1.2649 support level and fixes below, the downtrend is likely to resume.

USD/CAD
There is no news feed for today.

by JustForex


This article reflects a personal opinion and should not be interpreted as an investment advice, and/or offer, and/or a persistent request for carrying out financial transactions, and/or a guarantee, and/or a forecast of future events.

Positive statistics on the US labor market negatively affected stock indices

by JustForex

US stock indices traded on Friday without a single trend. At the close of the stock exchange on Friday, Dow Jones (US30) decreased by 0.06% (+1.15% for the week), S&P500 (US500) increased by 0.52% (+1.55% for the week), NASDAQ Technology Index (US100) added 1.58%, becoming the highest gainer of the week (+2.07%) among the US indices. All three major indices closed the week in positive territory. Investors evaluated the latest labor market data and corporate reports. Labor market data showed an increase of 467,000 US nonfarm payrolls last month (125,000 – 150,000 forecast). An unexpectedly sharp increase in jobs occurred despite the spread of the new Omicron strain. But the unemployment rate increased from 3.9% to 4.0%. Such data put pressure on the market as it increased investors’ fears that the Fed might become more aggressive.

Analysts believe that the reduction in shipping costs (Baltic Dry Index), stabilization in the commodity markets, and an increase in US retail inventories indicate that inflationary pressures in the US will soon reduce. Typically, the lag between indices is up to six months. Therefore, analysts began to lean toward the option that the Fed will not hike the rates sharply by 0.5% in March and will not make five rate hikes in 2022. The probability of such a scenario is currently 34%. So far, most analysts believe the Fed will raise rates by 0.25% in March and make two more hikes by the end of 2022. This means that there is a high probability of growth of stock indices until spring as the markets initially included a more aggressive scenario in the price. But from spring to late summer, a correction in the stock markets is very likely.

Nearly 4.4 million electric cars were sold worldwide last year, up 121% from 2020. And analysts believe that this is only the beginning of the electrification of cars.

Snap’s stock price jumped 58.8% on Friday, the best daily gain in the company’s history. The company reported its first-ever quarterly profit in October and December. At the same time, revenue increased by 42%.

The online visual bookmarking service Pinterest cut net income last quarter but increased revenue. The company’s stock jumped 11.2% on the report.

According to Wall Street analysts, the worst is over for Robinhood stock. Analysts believe Robinhood stock has found the bottom, and it’s time to buy.

European stock indices closed Friday in the red zone. German DAX (DE30) decreased by 1.75% (-2.63% for the week), French CAC 40 (FR40) fell by 0.77% (-1.25% for the week), Spanish IBEX 35 (ES35) lost 1.15% (-1.21% for the week), British FTSE 100 (UK100) fell by 0.17% on Friday, but ended the week with +0.67% gain and was the only index that closed in the plus last week. After last week’s ECB meeting on Thursday, Deutsche Bank closed its short EUR trades and advised clients to go long on EUR/USD. Klaas Knot, president of the Dutch Central Bank and a member of the European Central Bank’s Governing Council, said on Sunday that he expects the ECB to raise interest rates in the fourth quarter of this year. He supports cutting the Eurozone central bank’s asset purchase program as quickly as possible. In this case, the ECB must first complete its asset purchase programs, which must be reduced by 20 billion euros ($22.89 billion) per month by the fourth quarter. Industrial production in Germany fell by 0.3% in December. Supply chain problems continue to hurt the German industry.

The energy market began February with high oil prices. On Friday, oil prices added another 2%. The increase in oil prices was caused by factors such as supply shortages and the geopolitical situation in Eastern Europe and the Middle East. Considering that OPEC+ is following its production plan, traders should not expect a decrease in oil prices soon. Some analysts forecast the price of $100 per barrel in the coming months.

Asian markets were mostly trading in positive territory on Friday. Japan Nikkei 225 (JP225) gained 0.73% (+2.81% for the week), Australian S&P/ASX 200 (AU200) added 0.60% (+1.89% for the week), Hang Seng of Hong Kong (HK50) jumped by 3.24% (+0.95% for the week). But on Monday, major Asian indices opened with the decrease. The spread of the Omicron strain in the region has a negative impact on investor sentiment. Bars and restaurants are still banned in large parts of Japan. This week, investors’ attention will be focused on central bank meetings in India, Indonesia, and Thailand. In addition, the reports of some of the largest companies in the region, including Japanese automakers, will be published.

At the commodities market, futures on cocoa (+8.98%), soybeans (+5.88%), WTI oil (+5.87%), heating oil (+5.18%), copper (+4.55%), lumber (+4.39%), Brent oil (+2.77%) and coffee (+2.63%) showed the biggest gains by the end of the week. Orange juice futures (-8.81%), palladium (-3.78%), wheat (-2.67%) and corn (-2.24%) showed the biggest drop.

Main market quotes:

S&P 500 (F) (US500) 4,500.53 +23.09 (+0.52%)

Dow Jones (US30) 35,089.74 -21.42 (-0.061%)

DAX (DE40) 15,099.56 -268.91 (-1.75%)

FTSE 100 (UK100) 7,516.40 -12.44 (-0.17%)

USD Index 95.48 +0.10 (+0.10%)

Important events for today:
  • – Australia Retail Sales (m/m) at 02:30 (GMT+2);
  • – Switzerland Unemployment Rate (m/m) at 08:45 (GMT+2);
  • – German Industrial Production (m/m) at 09:00 (GMT+2);
  • – ECB President Lagarde’s Speech at 17:45 (GMT+2).

by JustForex


This article reflects a personal opinion and should not be interpreted as an investment advice, and/or offer, and/or a persistent request for carrying out financial transactions, and/or a guarantee, and/or a forecast of future events.

EUR/USD Took a Break

By Dmitriy Gurkovskiy, Chief Analyst at RoboForex

The major currency pair skyrocketed last week. However, the pair has already slowed down a little bit and right now is balancing at 1.1432.

Last Friday, financial markets got additional signals in favour of a rate hike by the US Federal Reserve System in the nearest future.

The Unemployment Rate in the US showed 4% in January after being 3.9% the month before. This might be an adjustment for seasonal fluctuation because the decline was not critical. The Non-Farm Payrolls report showed 467K after being 510K in December and against the expected reading of 110K.

The Average Hourly Earnings added 0.7% m/m, which turned out to be better than expected.

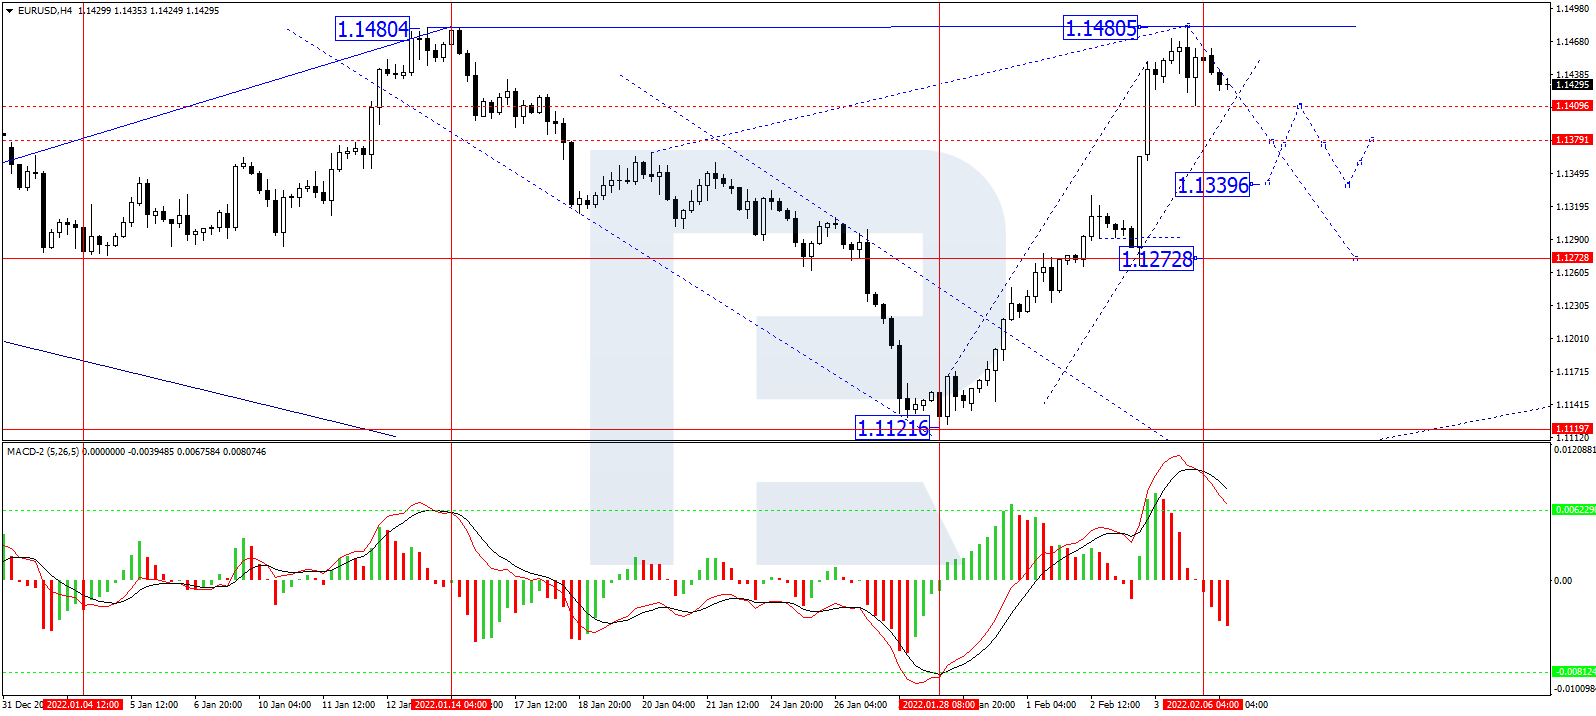
In the H4 chart, having finished another ascending wave at 1.1480 along with the descending impulse towards 1.1410, EUR/USD has completed the correction to reach 1.1460; right now, it is falling to break 1.1410 and reach the short-term target at 1.1355. After that, the instrument may correct to test 1.1410 from below and then trade downwards with the first target at 1.1342. From the technical point of view, this scenario is confirmed by MACD Oscillator: its signal line is moving towards 0. After this level is broken, the correction in the price chart may continue.

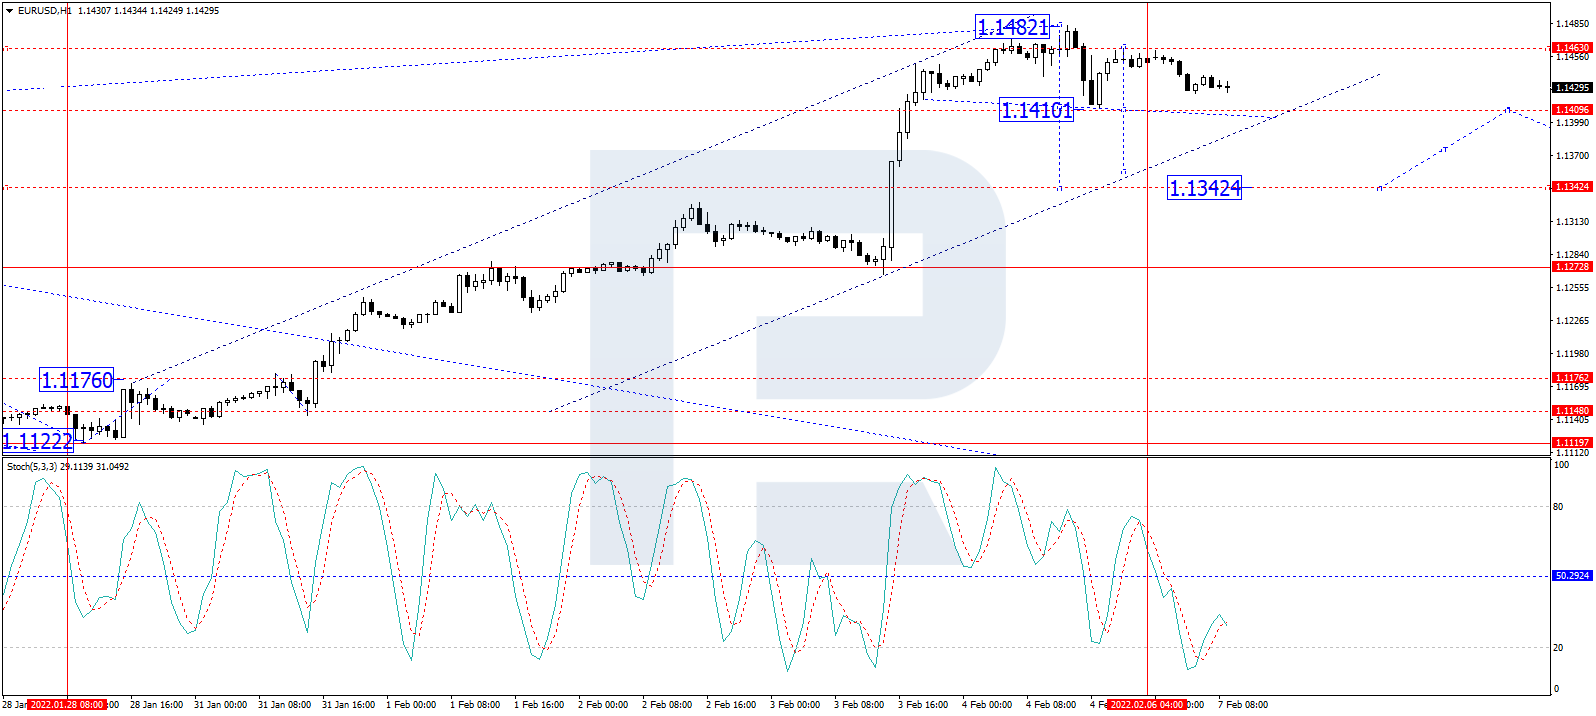
As we can see in the H1 chart, after rebounding from 1.1463, EUR/USD is forming the second descending structure to break 1.1410 and may later continue trading downwards with the target at 1.1355. From the technical point of view, this idea is confirmed by the Stochastic Oscillator: its signal line is moving above 20 and may continue growling to reach 50. Later, the line may rebound from 50 and resume falling to reach 20.

Disclaimer

Any forecasts contained herein are based on the author’s particular opinion. This analysis may not be treated as trading advice. RoboForex bears no responsibility for trading results based on trading recommendations and reviews contained herein.