By InvestMacro | COT | Data Tables | COT Leaders | Downloads | COT Newsletter
Here are the latest charts and statistics for the Commitment of Traders (COT) data published by the Commodities Futures Trading Commission (CFTC).
The latest COT data is updated through Tuesday March 29th and shows a quick view of how large traders (for-profit speculators and commercial entities) were positioned in the futures markets. All currency positions are in direct relation to the US dollar where, for example, a bet for the euro is a bet that the euro will rise versus the dollar while a bet against the euro will be a bet that the euro will decline versus the dollar.
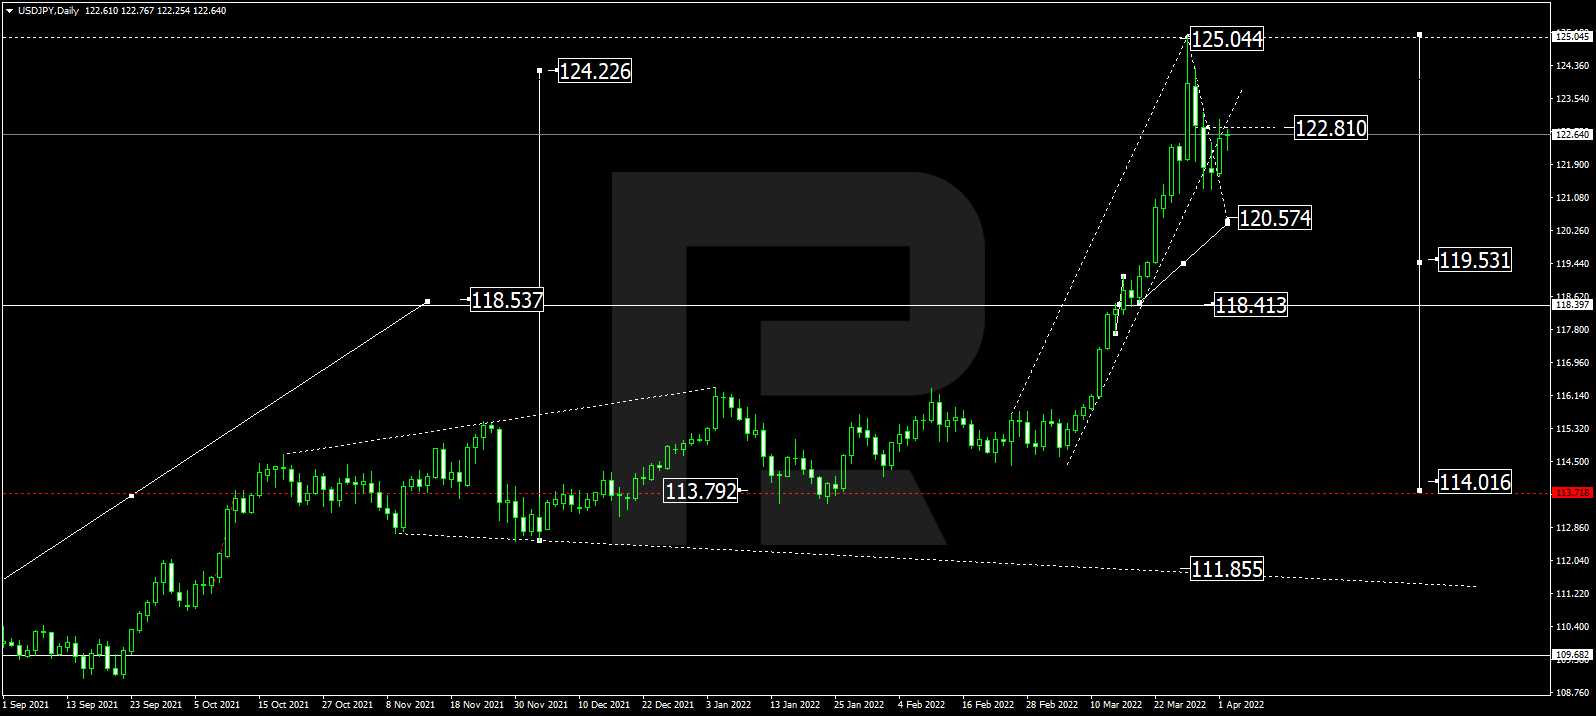
Highlighting the COT currency data is the increase of bearish bets in the Japanese yen currency futures contracts. Japanese yen speculators raised their bearish bets for a third straight week this week and for the fourth time in the past five weeks. Over this five-week time-frame, yen bets have now dropped by a total of -38,944 contracts, going from -63,187 net positions on February 22nd to -102,131 net positions this week. This weakness in speculator sentiment has pushed the current Yen positioning to the most bearish level in the past twenty weeks, dating back to November 9th when net positions over over -105,000 contracts.
Since the new year, yen speculator positions have averaged -70,432 weekly contracts, underscoring the sentiment weakness and compared to the 2021 weekly positions average of -44,182 contracts (positions averaged +17,100 weekly contracts in 2020). Japanese yen prices have also been extremely weak versus the other major currencies. Currently, the yen has recorded losses against all of the majors year-to-date and many majors currencies are trading at the highest levels since 2015 versus the yen.
Overall, the currencies with higher speculator bets this week were the US Dollar Index (1,306 contracts), Australian dollar (1,583 contracts), Brazil real (1,052 contracts), Canadian dollar (3,405 contracts) and the Mexican peso (9,804 contracts).
The currencies with declining bets this week were the Japanese yen (-23,649 contracts), Euro (-2,469 contracts), Swiss franc (-3,155 contracts), British pound sterling (-2,826 contracts), New Zealand dollar (-3,387 contracts), Russian ruble (-263 contracts) and Bitcoin (-271 contracts).
| Mar-29-2022 | OI | OI-Index | Spec-Net | Spec-Index | Com-Net | COM-Index | Smalls-Net | Smalls-Index |
|---|
| USD Index | 53,967 | 76 | 30,941 | 79 | -35,106 | 16 | 4,165 | 62 |
| EUR | 662,415 | 67 | 21,374 | 42 | -47,348 | 62 | 25,974 | 17 |
| GBP | 224,365 | 54 | -40,070 | 45 | 52,009 | 60 | -11,939 | 31 |
| JPY | 239,698 | 82 | -102,131 | 3 | 124,850 | 98 | -22,719 | 7 |
| CHF | 44,327 | 20 | -11,579 | 50 | 23,228 | 57 | -11,649 | 29 |
| CAD | 147,421 | 28 | -1,535 | 46 | -15,518 | 48 | 17,053 | 64 |
| AUD | 143,007 | 39 | -49,606 | 39 | 40,894 | 49 | 8,712 | 74 |
| NZD | 34,881 | 15 | -867 | 70 | -3 | 30 | 870 | 62 |
| MXN | 157,779 | 30 | -8,247 | 24 | 3,286 | 74 | 4,961 | 64 |
| RUB | 20,930 | 4 | 7,543 | 31 | -7,150 | 69 | -393 | 24 |
| BRL | 78,894 | 79 | 42,616 | 92 | -45,623 | 7 | 3,007 | 100 |
| Bitcoin | 12,024 | 66 | -271 | 89 | -411 | 0 | 682 | 28 |
US Dollar Index Futures:
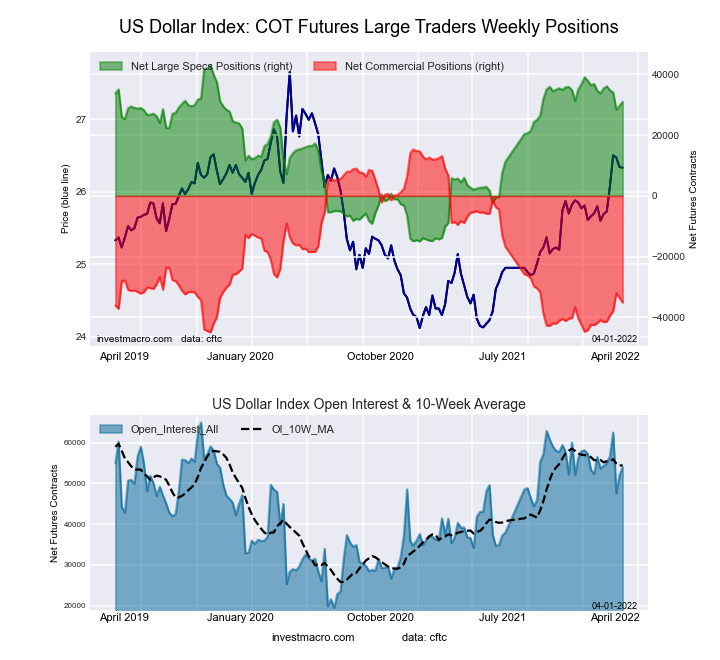 The US Dollar Index large speculator standing this week recorded a net position of 30,941 contracts in the data reported through Tuesday. This was a weekly rise of 1,306 contracts from the previous week which had a total of 29,635 net contracts.
This week’s current strength score (the trader positioning range over the past three years, measured from 0 to 100) shows the speculators are currently Bullish with a score of 79.2 percent. The commercials are Bearish-Extreme with a score of 16.3 percent and the small traders (not shown in chart) are Bullish with a score of 62.1 percent.
| US DOLLAR INDEX Statistics | SPECULATORS | COMMERCIALS | SMALL TRADERS |
| – Percent of Open Interest Longs: | 83.3 | 2.8 | 10.5 |
| – Percent of Open Interest Shorts: | 26.0 | 67.8 | 2.8 |
| – Net Position: | 30,941 | -35,106 | 4,165 |
| – Gross Longs: | 44,970 | 1,493 | 5,684 |
| – Gross Shorts: | 14,029 | 36,599 | 1,519 |
| – Long to Short Ratio: | 3.2 to 1 | 0.0 to 1 | 3.7 to 1 |
| NET POSITION TREND: | | | |
| – Strength Index Score (3 Year Range Pct): | 79.2 | 16.3 | 62.1 |
| – Strength Index Reading (3 Year Range): | Bullish | Bearish-Extreme | Bullish |
| NET POSITION MOVEMENT INDEX: | | | |
| – 6-Week Change in Strength Index: | -7.7 | 10.7 | -21.9 |
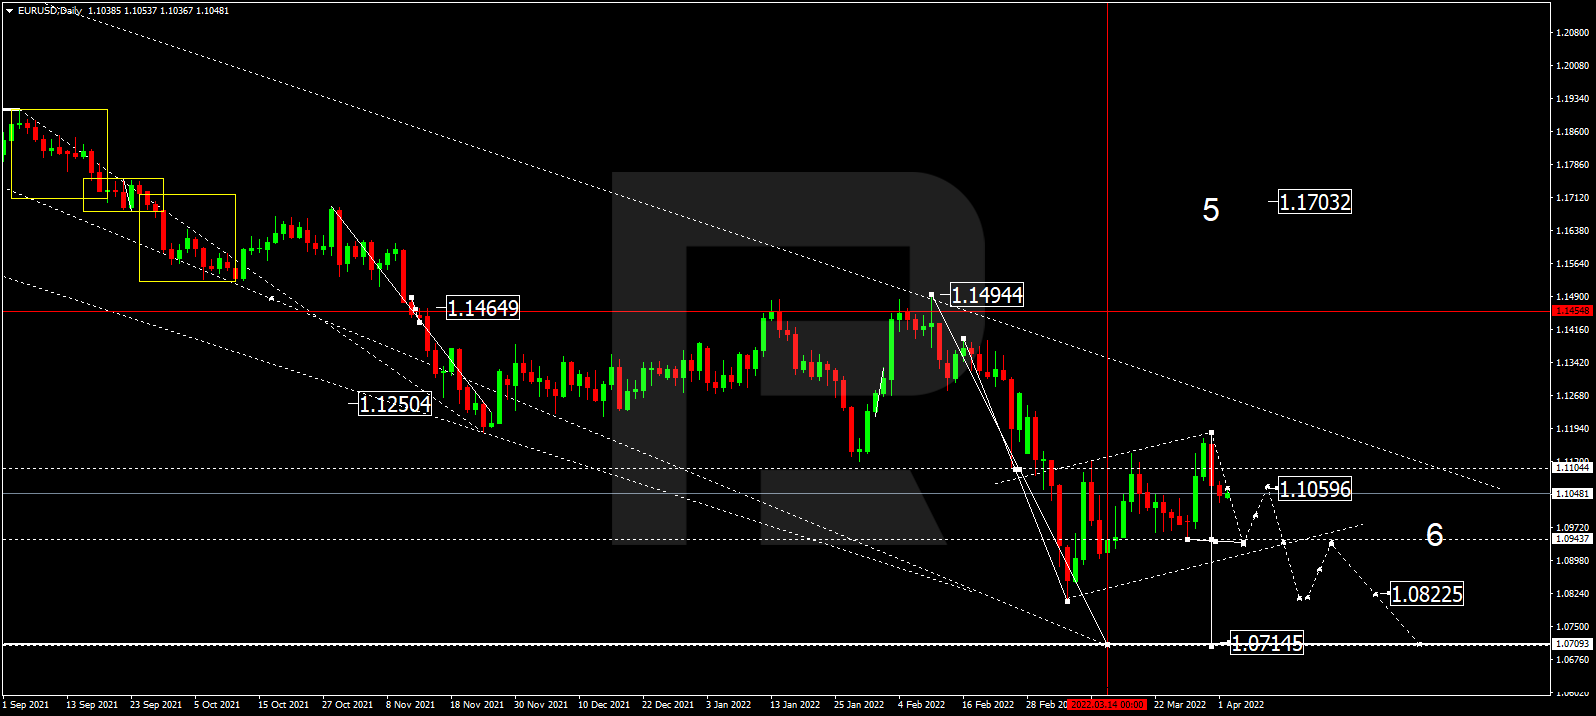
Euro Currency Futures:
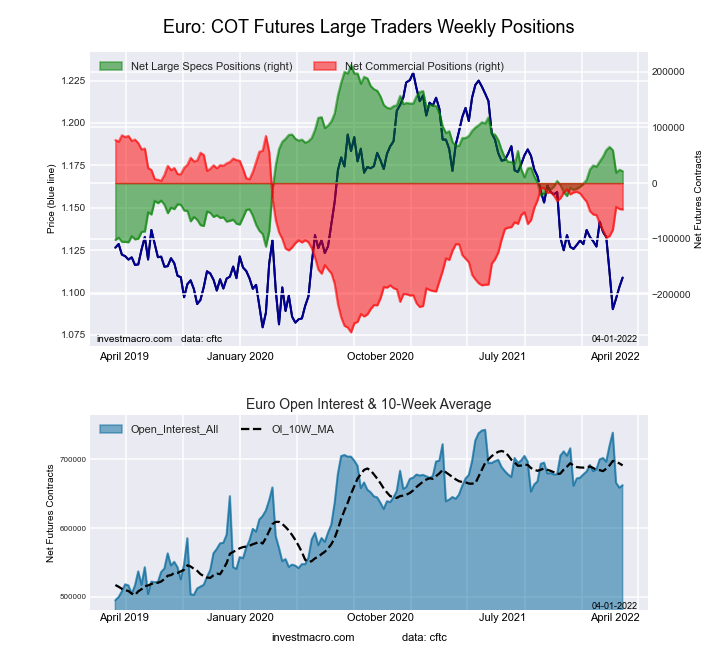 The Euro Currency large speculator standing this week recorded a net position of 21,374 contracts in the data reported through Tuesday. This was a weekly fall of -2,469 contracts from the previous week which had a total of 23,843 net contracts.
This week’s current strength score (the trader positioning range over the past three years, measured from 0 to 100) shows the speculators are currently Bearish with a score of 41.6 percent. The commercials are Bullish with a score of 62.3 percent and the small traders (not shown in chart) are Bearish-Extreme with a score of 17.4 percent.
| EURO Currency Statistics | SPECULATORS | COMMERCIALS | SMALL TRADERS |
| – Percent of Open Interest Longs: | 30.2 | 55.0 | 12.1 |
| – Percent of Open Interest Shorts: | 27.0 | 62.1 | 8.2 |
| – Net Position: | 21,374 | -47,348 | 25,974 |
| – Gross Longs: | 200,043 | 364,163 | 80,321 |
| – Gross Shorts: | 178,669 | 411,511 | 54,347 |
| – Long to Short Ratio: | 1.1 to 1 | 0.9 to 1 | 1.5 to 1 |
| NET POSITION TREND: | | | |
| – Strength Index Score (3 Year Range Pct): | 41.6 | 62.3 | 17.4 |
| – Strength Index Reading (3 Year Range): | Bearish | Bullish | Bearish-Extreme |
| NET POSITION MOVEMENT INDEX: | | | |
| – 6-Week Change in Strength Index: | -8.0 | 10.7 | -19.0 |
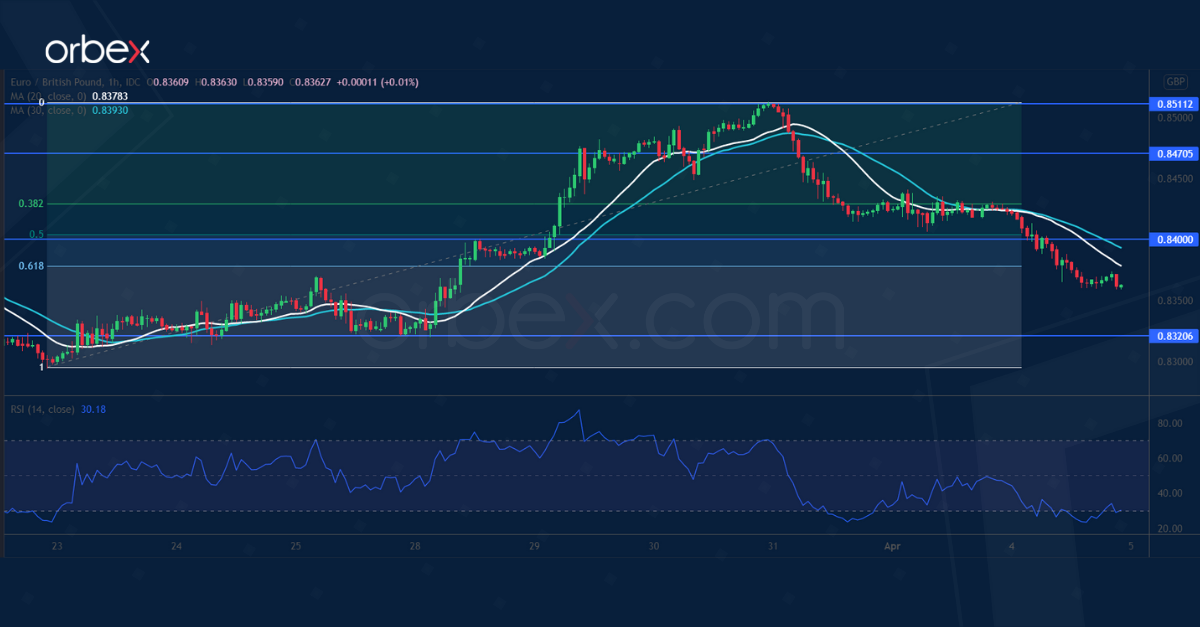
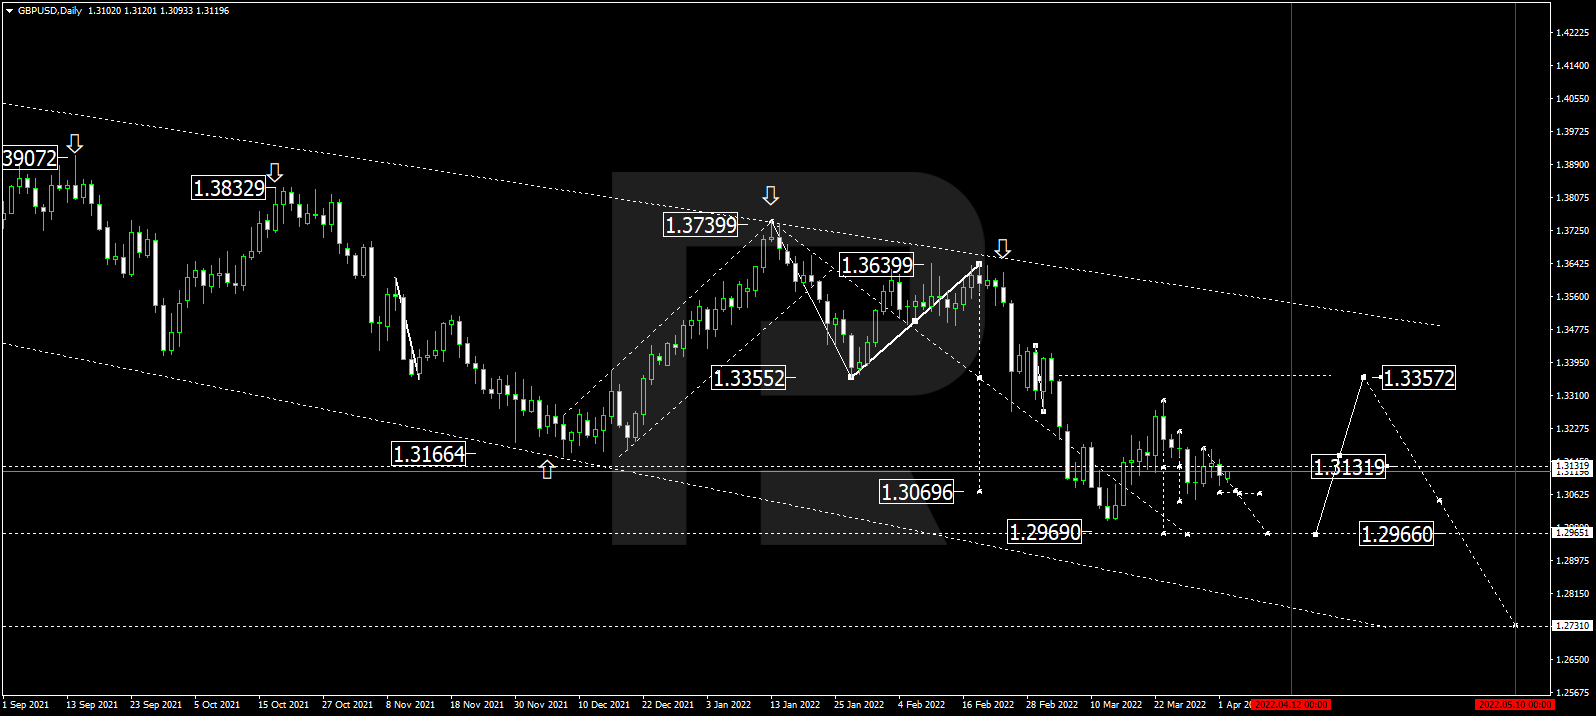
British Pound Sterling Futures:
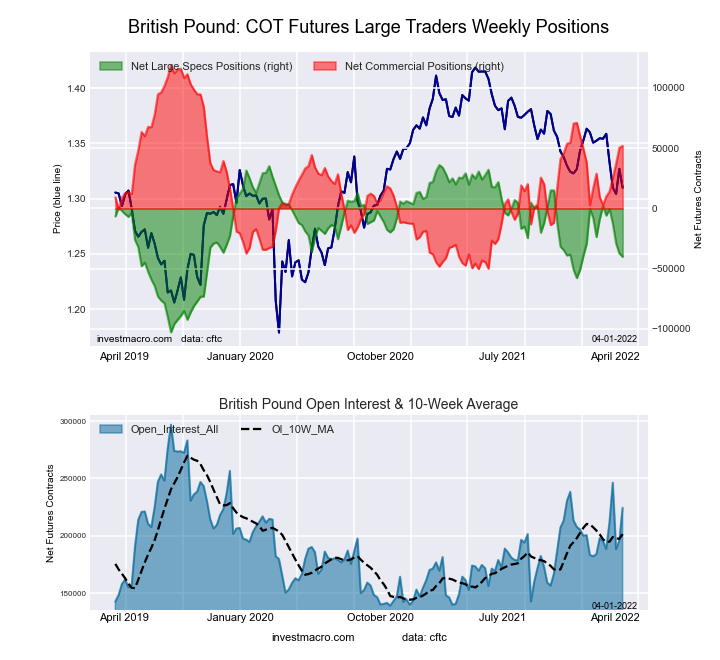 The British Pound Sterling large speculator standing this week recorded a net position of -40,070 contracts in the data reported through Tuesday. This was a weekly decrease of -2,826 contracts from the previous week which had a total of -37,244 net contracts.
This week’s current strength score (the trader positioning range over the past three years, measured from 0 to 100) shows the speculators are currently Bearish with a score of 45.1 percent. The commercials are Bullish with a score of 60.4 percent and the small traders (not shown in chart) are Bearish with a score of 30.9 percent.
| BRITISH POUND Statistics | SPECULATORS | COMMERCIALS | SMALL TRADERS |
| – Percent of Open Interest Longs: | 13.6 | 73.3 | 9.9 |
| – Percent of Open Interest Shorts: | 31.5 | 50.1 | 15.2 |
| – Net Position: | -40,070 | 52,009 | -11,939 |
| – Gross Longs: | 30,624 | 164,519 | 22,187 |
| – Gross Shorts: | 70,694 | 112,510 | 34,126 |
| – Long to Short Ratio: | 0.4 to 1 | 1.5 to 1 | 0.7 to 1 |
| NET POSITION TREND: | | | |
| – Strength Index Score (3 Year Range Pct): | 45.1 | 60.4 | 30.9 |
| – Strength Index Reading (3 Year Range): | Bearish | Bullish | Bearish |
| NET POSITION MOVEMENT INDEX: | | | |
| – 6-Week Change in Strength Index: | -30.5 | 29.1 | -14.2 |
Japanese Yen Futures:
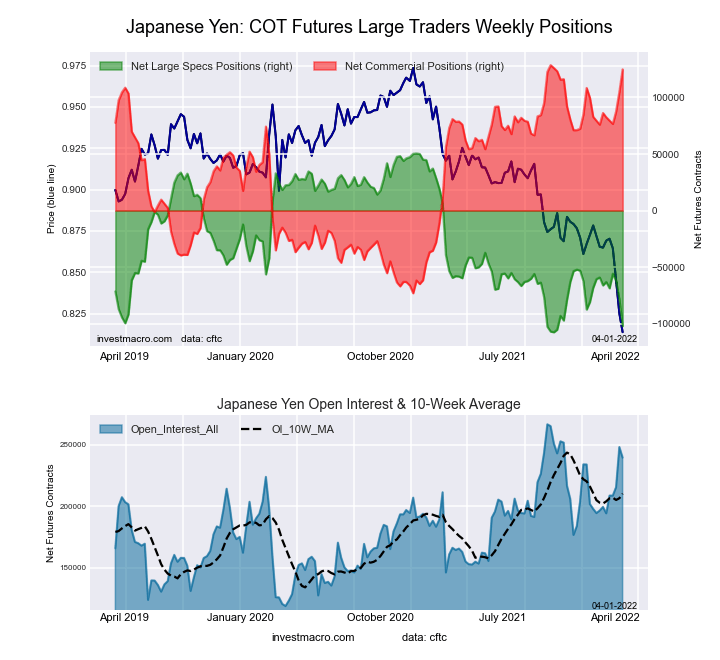 The Japanese Yen large speculator standing this week recorded a net position of -102,131 contracts in the data reported through Tuesday. This was a weekly decrease of -23,649 contracts from the previous week which had a total of -78,482 net contracts.
This week’s current strength score (the trader positioning range over the past three years, measured from 0 to 100) shows the speculators are currently Bearish-Extreme with a score of 3.5 percent. The commercials are Bullish-Extreme with a score of 98.2 percent and the small traders (not shown in chart) are Bearish-Extreme with a score of 7.3 percent.
| JAPANESE YEN Statistics | SPECULATORS | COMMERCIALS | SMALL TRADERS |
| – Percent of Open Interest Longs: | 6.4 | 83.9 | 8.5 |
| – Percent of Open Interest Shorts: | 49.0 | 31.8 | 18.0 |
| – Net Position: | -102,131 | 124,850 | -22,719 |
| – Gross Longs: | 15,274 | 201,190 | 20,392 |
| – Gross Shorts: | 117,405 | 76,340 | 43,111 |
| – Long to Short Ratio: | 0.1 to 1 | 2.6 to 1 | 0.5 to 1 |
| NET POSITION TREND: | | | |
| – Strength Index Score (3 Year Range Pct): | 3.5 | 98.2 | 7.3 |
| – Strength Index Reading (3 Year Range): | Bearish-Extreme | Bullish-Extreme | Bearish-Extreme |
| NET POSITION MOVEMENT INDEX: | | | |
| – 6-Week Change in Strength Index: | -22.7 | 19.1 | -5.3 |
Swiss Franc Futures:
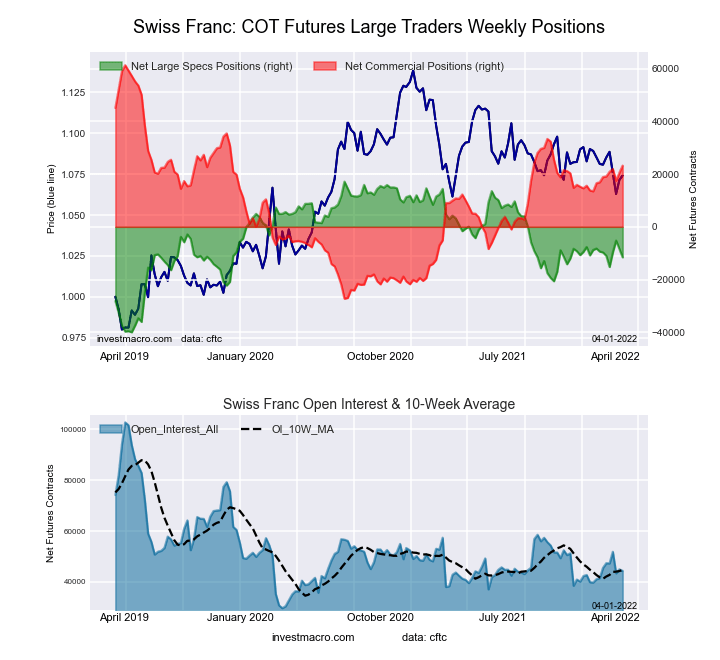 The Swiss Franc large speculator standing this week recorded a net position of -11,579 contracts in the data reported through Tuesday. This was a weekly lowering of -3,155 contracts from the previous week which had a total of -8,424 net contracts.
This week’s current strength score (the trader positioning range over the past three years, measured from 0 to 100) shows the speculators are currently Bearish with a score of 49.7 percent. The commercials are Bullish with a score of 57.0 percent and the small traders (not shown in chart) are Bearish with a score of 29.1 percent.
| SWISS FRANC Statistics | SPECULATORS | COMMERCIALS | SMALL TRADERS |
| – Percent of Open Interest Longs: | 7.4 | 73.2 | 19.2 |
| – Percent of Open Interest Shorts: | 33.5 | 20.8 | 45.5 |
| – Net Position: | -11,579 | 23,228 | -11,649 |
| – Gross Longs: | 3,292 | 32,430 | 8,522 |
| – Gross Shorts: | 14,871 | 9,202 | 20,171 |
| – Long to Short Ratio: | 0.2 to 1 | 3.5 to 1 | 0.4 to 1 |
| NET POSITION TREND: | | | |
| – Strength Index Score (3 Year Range Pct): | 49.7 | 57.0 | 29.1 |
| – Strength Index Reading (3 Year Range): | Bearish | Bullish | Bearish |
| NET POSITION MOVEMENT INDEX: | | | |
| – 6-Week Change in Strength Index: | -3.3 | 4.9 | -7.3 |
Canadian Dollar Futures:
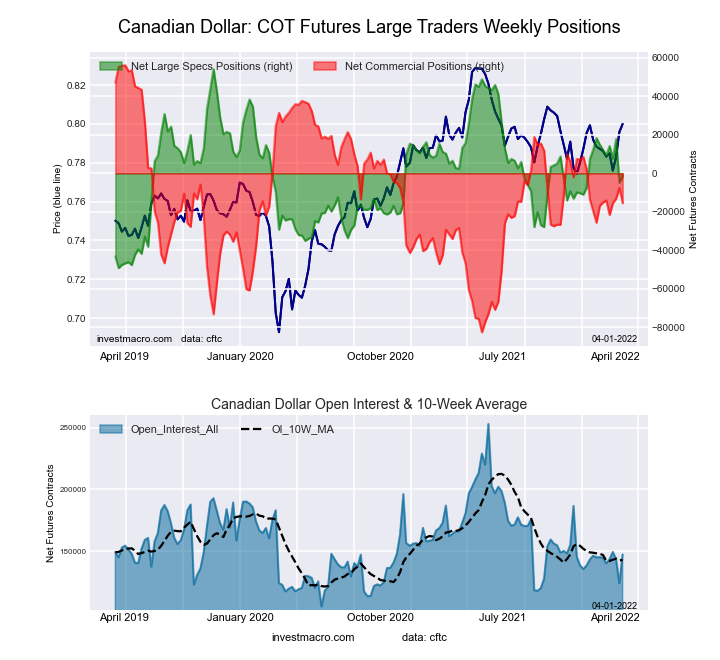 The Canadian Dollar large speculator standing this week recorded a net position of -1,535 contracts in the data reported through Tuesday. This was a weekly advance of 3,405 contracts from the previous week which had a total of -4,940 net contracts.
This week’s current strength score (the trader positioning range over the past three years, measured from 0 to 100) shows the speculators are currently Bearish with a score of 46.2 percent. The commercials are Bearish with a score of 48.3 percent and the small traders (not shown in chart) are Bullish with a score of 63.7 percent.
| CANADIAN DOLLAR Statistics | SPECULATORS | COMMERCIALS | SMALL TRADERS |
| – Percent of Open Interest Longs: | 22.0 | 52.1 | 24.9 |
| – Percent of Open Interest Shorts: | 23.0 | 62.6 | 13.4 |
| – Net Position: | -1,535 | -15,518 | 17,053 |
| – Gross Longs: | 32,429 | 76,738 | 36,771 |
| – Gross Shorts: | 33,964 | 92,256 | 19,718 |
| – Long to Short Ratio: | 1.0 to 1 | 0.8 to 1 | 1.9 to 1 |
| NET POSITION TREND: | | | |
| – Strength Index Score (3 Year Range Pct): | 46.2 | 48.3 | 63.7 |
| – Strength Index Reading (3 Year Range): | Bearish | Bearish | Bullish |
| NET POSITION MOVEMENT INDEX: | | | |
| – 6-Week Change in Strength Index: | -13.3 | -0.3 | 28.1 |
Australian Dollar Futures:
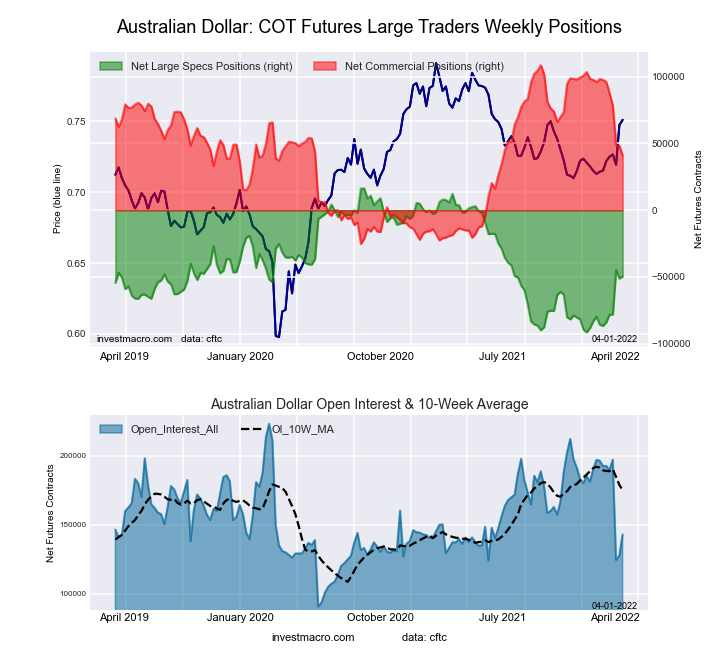 The Australian Dollar large speculator standing this week recorded a net position of -49,606 contracts in the data reported through Tuesday. This was a weekly gain of 1,583 contracts from the previous week which had a total of -51,189 net contracts.
This week’s current strength score (the trader positioning range over the past three years, measured from 0 to 100) shows the speculators are currently Bearish with a score of 38.8 percent. The commercials are Bearish with a score of 49.4 percent and the small traders (not shown in chart) are Bullish with a score of 73.7 percent.
| AUSTRALIAN DOLLAR Statistics | SPECULATORS | COMMERCIALS | SMALL TRADERS |
| – Percent of Open Interest Longs: | 23.7 | 56.6 | 18.7 |
| – Percent of Open Interest Shorts: | 58.4 | 28.0 | 12.7 |
| – Net Position: | -49,606 | 40,894 | 8,712 |
| – Gross Longs: | 33,960 | 80,885 | 26,806 |
| – Gross Shorts: | 83,566 | 39,991 | 18,094 |
| – Long to Short Ratio: | 0.4 to 1 | 2.0 to 1 | 1.5 to 1 |
| NET POSITION TREND: | | | |
| – Strength Index Score (3 Year Range Pct): | 38.8 | 49.4 | 73.7 |
| – Strength Index Reading (3 Year Range): | Bearish | Bearish | Bullish |
| NET POSITION MOVEMENT INDEX: | | | |
| – 6-Week Change in Strength Index: | 34.4 | -42.4 | 48.0 |
New Zealand Dollar Futures:
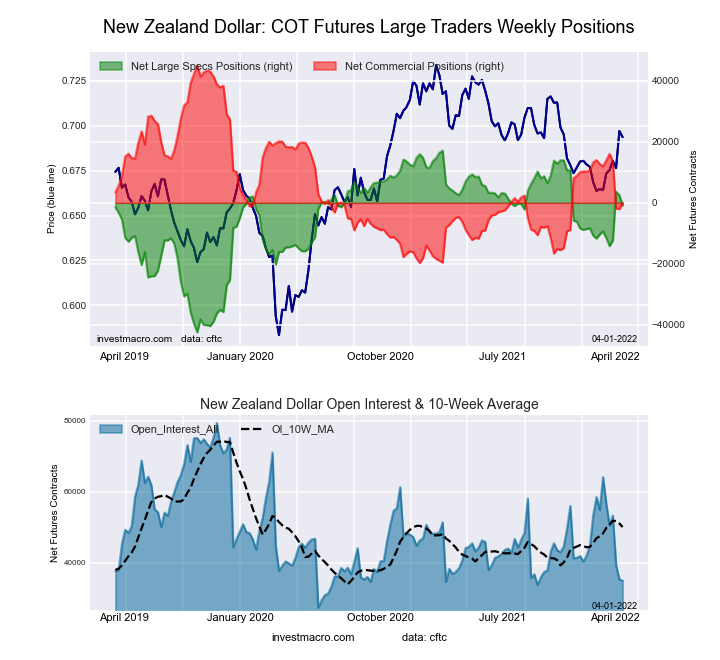 The New Zealand Dollar large speculator standing this week recorded a net position of -867 contracts in the data reported through Tuesday. This was a weekly reduction of -3,387 contracts from the previous week which had a total of 2,520 net contracts.
This week’s current strength score (the trader positioning range over the past three years, measured from 0 to 100) shows the speculators are currently Bullish with a score of 69.8 percent. The commercials are Bearish with a score of 30.4 percent and the small traders (not shown in chart) are Bullish with a score of 61.8 percent.
| NEW ZEALAND DOLLAR Statistics | SPECULATORS | COMMERCIALS | SMALL TRADERS |
| – Percent of Open Interest Longs: | 44.4 | 44.5 | 10.5 |
| – Percent of Open Interest Shorts: | 46.9 | 44.5 | 8.0 |
| – Net Position: | -867 | -3 | 870 |
| – Gross Longs: | 15,504 | 15,507 | 3,666 |
| – Gross Shorts: | 16,371 | 15,510 | 2,796 |
| – Long to Short Ratio: | 0.9 to 1 | 1.0 to 1 | 1.3 to 1 |
| NET POSITION TREND: | | | |
| – Strength Index Score (3 Year Range Pct): | 69.8 | 30.4 | 61.8 |
| – Strength Index Reading (3 Year Range): | Bullish | Bearish | Bullish |
| NET POSITION MOVEMENT INDEX: | | | |
| – 6-Week Change in Strength Index: | 14.2 | -18.5 | 40.7 |
Mexican Peso Futures:
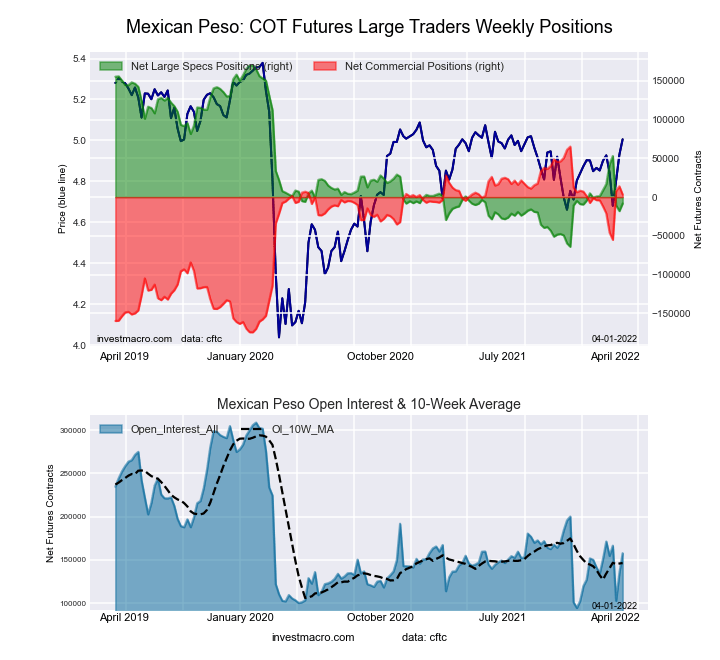 The Mexican Peso large speculator standing this week recorded a net position of -8,247 contracts in the data reported through Tuesday. This was a weekly gain of 9,804 contracts from the previous week which had a total of -18,051 net contracts.
This week’s current strength score (the trader positioning range over the past three years, measured from 0 to 100) shows the speculators are currently Bearish with a score of 23.8 percent. The commercials are Bullish with a score of 74.2 percent and the small traders (not shown in chart) are Bullish with a score of 64.1 percent.
| MEXICAN PESO Statistics | SPECULATORS | COMMERCIALS | SMALL TRADERS |
| – Percent of Open Interest Longs: | 47.6 | 46.9 | 4.8 |
| – Percent of Open Interest Shorts: | 52.8 | 44.8 | 1.7 |
| – Net Position: | -8,247 | 3,286 | 4,961 |
| – Gross Longs: | 75,081 | 73,952 | 7,577 |
| – Gross Shorts: | 83,328 | 70,666 | 2,616 |
| – Long to Short Ratio: | 0.9 to 1 | 1.0 to 1 | 2.9 to 1 |
| NET POSITION TREND: | | | |
| – Strength Index Score (3 Year Range Pct): | 23.8 | 74.2 | 64.1 |
| – Strength Index Reading (3 Year Range): | Bearish | Bullish | Bullish |
| NET POSITION MOVEMENT INDEX: | | | |
| – 6-Week Change in Strength Index: | -7.3 | 6.4 | 8.0 |
Brazilian Real Futures:
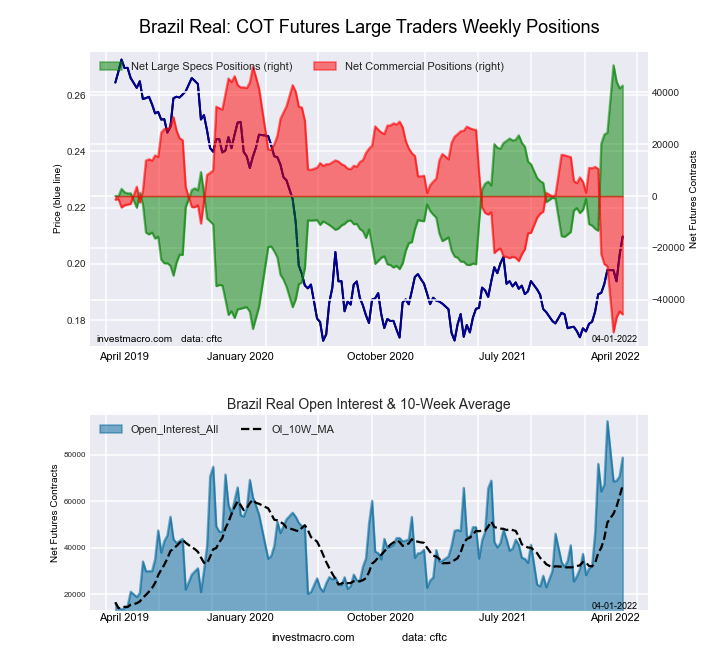 The Brazilian Real large speculator standing this week recorded a net position of 42,616 contracts in the data reported through Tuesday. This was a weekly advance of 1,052 contracts from the previous week which had a total of 41,564 net contracts.
This week’s current strength score (the trader positioning range over the past three years, measured from 0 to 100) shows the speculators are currently Bullish-Extreme with a score of 92.3 percent. The commercials are Bearish-Extreme with a score of 6.8 percent and the small traders (not shown in chart) are Bullish-Extreme with a score of 100.0 percent.
| BRAZIL REAL Statistics | SPECULATORS | COMMERCIALS | SMALL TRADERS |
| – Percent of Open Interest Longs: | 67.3 | 26.2 | 6.1 |
| – Percent of Open Interest Shorts: | 13.2 | 84.0 | 2.3 |
| – Net Position: | 42,616 | -45,623 | 3,007 |
| – Gross Longs: | 53,065 | 20,649 | 4,805 |
| – Gross Shorts: | 10,449 | 66,272 | 1,798 |
| – Long to Short Ratio: | 5.1 to 1 | 0.3 to 1 | 2.7 to 1 |
| NET POSITION TREND: | | | |
| – Strength Index Score (3 Year Range Pct): | 92.3 | 6.8 | 100.0 |
| – Strength Index Reading (3 Year Range): | Bullish-Extreme | Bearish-Extreme | Bullish-Extreme |
| NET POSITION MOVEMENT INDEX: | | | |
| – 6-Week Change in Strength Index: | 18.5 | -18.9 | 6.4 |
Russian Ruble Futures:
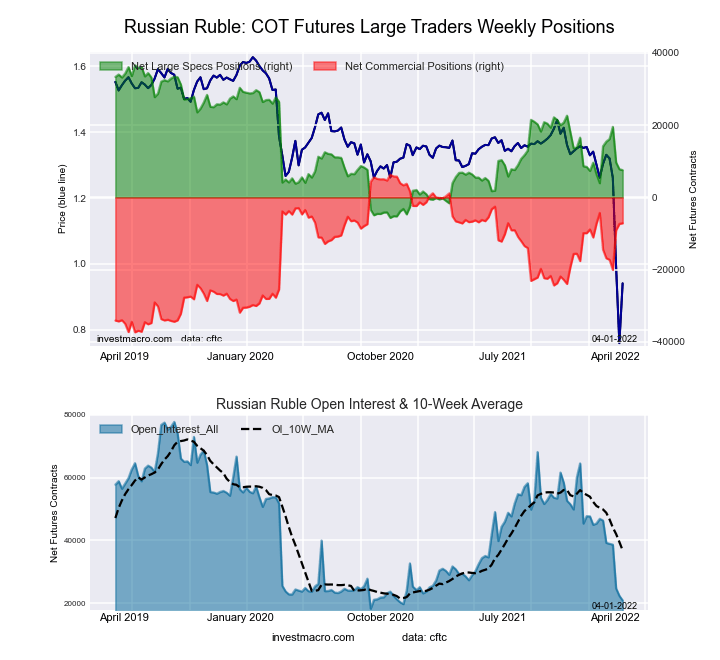 The Russian Ruble large speculator standing this week recorded a net position of 7,543 contracts in the data reported through Tuesday. This was a weekly fall of -263 contracts from the previous week which had a total of 7,806 net contracts.
This week’s current strength score (the trader positioning range over the past three years, measured from 0 to 100) shows the speculators are currently Bearish with a score of 31.2 percent. The commercials are Bullish with a score of 69.1 percent and the small traders (not shown in chart) are Bearish with a score of 23.9 percent.
| RUSSIAN RUBLE Statistics | SPECULATORS | COMMERCIALS | SMALL TRADERS |
| – Percent of Open Interest Longs: | 36.6 | 60.6 | 2.8 |
| – Percent of Open Interest Shorts: | 0.5 | 94.7 | 4.7 |
| – Net Position: | 7,543 | -7,150 | -393 |
| – Gross Longs: | 7,658 | 12,679 | 593 |
| – Gross Shorts: | 115 | 19,829 | 986 |
| – Long to Short Ratio: | 66.6 to 1 | 0.6 to 1 | 0.6 to 1 |
| NET POSITION TREND: | | | |
| – Strength Index Score (3 Year Range Pct): | 31.2 | 69.1 | 23.9 |
| – Strength Index Reading (3 Year Range): | Bearish | Bullish | Bearish |
| NET POSITION MOVEMENT INDEX: | | | |
| – 6-Week Change in Strength Index: | -15.6 | 16.7 | -18.8 |
Bitcoin Futures:
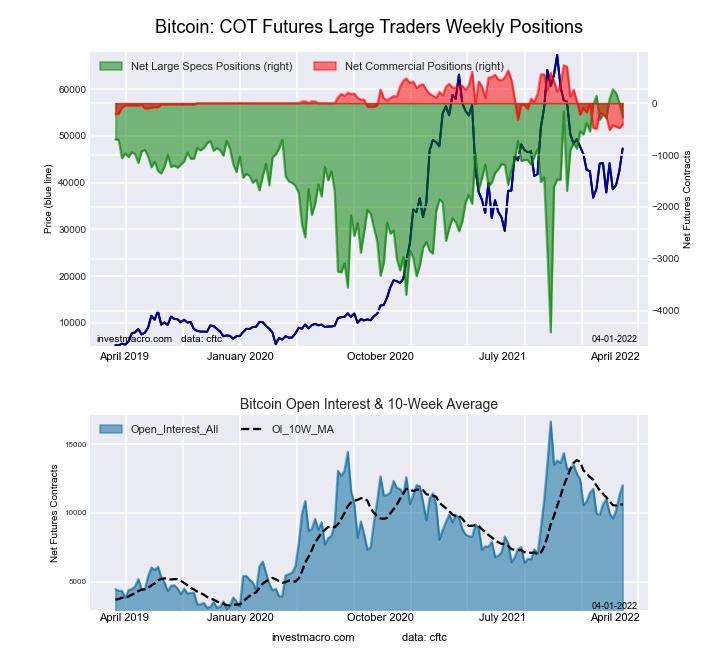 The Bitcoin large speculator standing this week recorded a net position of -271 contracts in the data reported through Tuesday. This was a weekly lowering of -271 contracts from the previous week which had a total of 0 net contracts.
This week’s current strength score (the trader positioning range over the past three years, measured from 0 to 100) shows the speculators are currently Bullish-Extreme with a score of 88.5 percent. The commercials are Bearish-Extreme with a score of 8.5 percent and the small traders (not shown in chart) are Bearish with a score of 28.4 percent.
| BITCOIN Statistics | SPECULATORS | COMMERCIALS | SMALL TRADERS |
| – Percent of Open Interest Longs: | 80.9 | 3.2 | 10.8 |
| – Percent of Open Interest Shorts: | 83.1 | 6.6 | 5.2 |
| – Net Position: | -271 | -411 | 682 |
| – Gross Longs: | 9,722 | 383 | 1,302 |
| – Gross Shorts: | 9,993 | 794 | 620 |
| – Long to Short Ratio: | 1.0 to 1 | 0.5 to 1 | 2.1 to 1 |
| NET POSITION TREND: | | | |
| – Strength Index Score (3 Year Range Pct): | 88.5 | 8.5 | 28.4 |
| – Strength Index Reading (3 Year Range): | Bullish-Extreme | Bearish-Extreme | Bearish |
| NET POSITION MOVEMENT INDEX: | | | |
| – 6-Week Change in Strength Index: | -1.2 | -15.9 | 5.8 |
Article By InvestMacro – Receive our weekly COT Reports by Email
*COT Report: The COT data, released weekly to the public each Friday, is updated through the most recent Tuesday (data is 3 days old) and shows a quick view of how large speculators or non-commercials (for-profit traders) were positioned in the futures markets.
The CFTC categorizes trader positions according to commercial hedgers (traders who use futures contracts for hedging as part of the business), non-commercials (large traders who speculate to realize trading profits) and nonreportable traders (usually small traders/speculators) as well as their open interest (contracts open in the market at time of reporting).See CFTC criteria here.


