Archive for Forex and Currency News – Page 150

The Analytical Overview of the Main Currency Pairs on 2022.04.14

by JustForex

The EUR/USD currency pair

Technical indicators of the currency pair:
  • Prev Open: 1.0826
  • Prev Close: 1.0891
  • % chg. over the last day: +0.60%

The European Central Bank (ECB) will hold its monetary policy meeting today, and pressure is building on policymakers to start tightening monetary policy as inflation continue to rise in Europe. In Germany, inflation increased by 7.3% year on year, and in Spain, the annual CPI reached 9.8%. Analysts are confident that the ECB will not change anything. However, there may be surprises in the form of immediate termination of the quantitative easing program amid such a spike in inflation.

Trading recommendations
  • Support levels: 1.0847, 1.0633
  • Resistance levels: 1.0946, 1.0958, 1.1027, 1.1075, 1.1135, 1.1196, 1.1291

From the technical point of view, the trend on the EUR/USD currency pair in the hourly time frame is bearish. Against the dollar index decline background, the price began to show growth. The MACD indicator has become positive. Under such market conditions, it is possible to look for buy trades on intraday timeframes from the support level of 1.0847, but only with short targets and confirmation. Sell trades should be considered from the resistance level of 1.0945, but only after the additional confirmation.

Alternative scenario: if the price breaks out through the 1.1075 resistance level and fixes above, the uptrend will likely resume.

EUR/USD
News feed for 2022.04.14:
  • – Eurozone Deposit Facility Rate at 14:45 (GMT+3);
  • – Eurozone ECB Interest Rate Decision at 14:45 (GMT+3);
  • – Eurozone ECB Press Conference at 15:30 (GMT+3);
  • – US Retail Sales (m/m) at 15:30 (GMT+3);
  • – US Initial Jobless Claims (w/w) at 15:30 (GMT+3);
  • – US Michigan Consumer Sentiment (m/m) at 17:00 (GMT+3);
  • – US FOMC Member Mester Speaks at 22:50 (GMT+3).

The GBP/USD currency pair

Technical indicators of the currency pair:
  • Prev Open: 1.2999
  • Prev Close: 1.3115
  • % chg. over the last day: +0.89%

The surge in inflation in the UK has increased the likelihood of new rate hikes by the Bank of England. Financial participants believe that the Bank of England will almost certainly raise interest rates to 1% at its next meeting on May 5 and then bring them to 2%-2.25% by the end of 2022. The British pound rose sharply amid such aggressive sentiment yesterday.

Trading recommendations
  • Support levels: 1.3053 1.3023
  • Resistance levels: 1.3144, 1.3181, 1.3244, 1.3274

On the hourly time frame, the GBP/USD currency pair trend is still bearish. Yesterday the price showed strong bullish initiative and consolidated above the moving average lines. It is only necessary to break through the priority change level to change the trend. The MACD indicator became positive. Under such market conditions, sell trades should be looked for from the resistance level of 1.3144, but with confirmation. For buy deals, traders may consider the level of 1.3053 after the pullback.

Alternative scenario: if the price breaks down through the 1.3181 resistance level and fixes above, the mid-term uptrend will likely be resumed.

GBP/USD
There is no news feed for today.

The USD/JPY currency pair

Technical indicators of the currency pair:
  • Prev Open: 125.32
  • Prev Close: 125.64
  • % chg. over the last day: +0.26%

Bank of Japan Governor Haruhiko Kuroda said on Wednesday that the central bank would continue its ultra-soft monetary policy to support the economy under the pressure of rising import costs. The fundamental picture for the Japanese Yen remains unchanged. The monetary policy of the Bank of Japan is now “ultra-soft” and aims to decrease the national currency rate (USD/JPY growth). The US Fed will tighten monetary policy more aggressively. The medium-term forecast remains unchanged – analysts see a continuation of the uptrend, as the monetary policies of the central banks in the United States and Japan are now opposed.

Trading recommendations
  • Support levels: 124.66, 124.24, 122.97, 122.63, 121.81
  • Resistance levels: 125.82

The medium-term trend on the USD/JPY currency pair is bullish. The MACD indicator has become inactive, and buyer pressure is decreasing. But the price has deviated very much from the moving averages. Under such market conditions, it is best to look for buy deals, expecting the continuation of the uptrend, but after the price makes a pullback to the average lines. First of all, it is worth considering the support level of 124.66 or 124.24, but with additional confirmation. A resistance level of 125.82 may be considered for sell deals.

Alternative scenario: If the price fixes below 122.97, the uptrend will likely be broken.

USD/JPY
There is no news feed for today.

The USD/CAD currency pair

Technical indicators of the currency pair:
  • Prev Open: 1.2642
  • Prev Close: 1.2562
  • % chg. over the last day: -0.64%

Like many countries worldwide, Canada is struggling with high inflation – the latest consumer price report showed that prices are rising at the fastest pace in 30 years. Together with a strong labor market, such indicators left the central bank with no choice but to raise interest rates. Moreover, the Bank of Canada immediately raised the interest rate from 0.5% to 1%. At a press conference, the Bank of Canada Governor said they were ready to act as decisively as necessary to achieve the inflation target and return to the neutral range of 2% and 3%. An increase in the national currency rate is accompanied by an increase in interest rates in the medium term. But as the US Federal Reserve also raises interest rates, the fundamental picture for the USD/CAD currency pair does not have a single dynamic.

Trading recommendations
  • Support levels: 1.2538, 1.2467
  • Resistance levels: 1.2610, 1.2644, 1.2713, 1.2754, 1.2851

The USD/CAD currency pair is bullish in terms of technical analysis. The MACD indicator has become negative, and there are signs of sellers’ strength. Trade is worth it only with short targets because, fundamentally, there are no prerequisites for the medium-term trend on the USD/CAD currency pair. Under such market conditions, it is better to look for buy trades on the lower timeframes from the support level of 1.2538, but it is better with additional confirmation. For sell deals, it is better to consider the resistance level of 1.2610, but it is better with confirmation.

Alternative scenario: if the price breaks through and consolidates below 1.2467, the downtrend will likely be resumed.

USD/CAD
There is no news feed for today.

by JustForex


This article reflects a personal opinion and should not be interpreted as an investment advice, and/or offer, and/or a persistent request for carrying out financial transactions, and/or a guarantee, and/or a forecast of future events.

Mid-Week Technical Outlook: Dollar Bulls Dominate The Scene

By Lukman Otunuga Senior Research Analyst, ForexTime

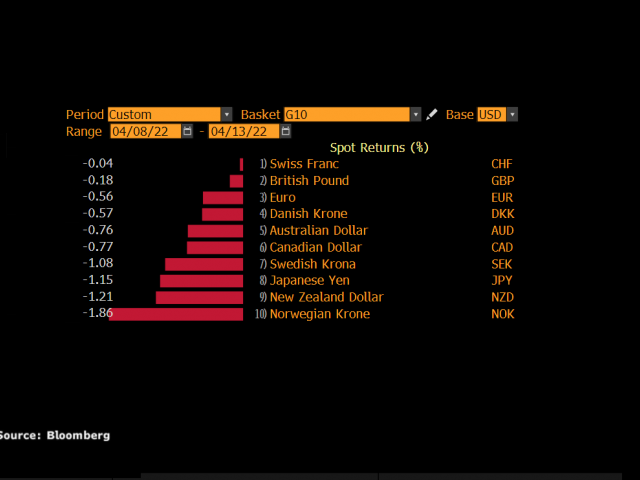
It looks like everyone wants a juicy piece of the world’s most liquid currency. The greenback has appreciated against every single G10 currency since the start of the week.

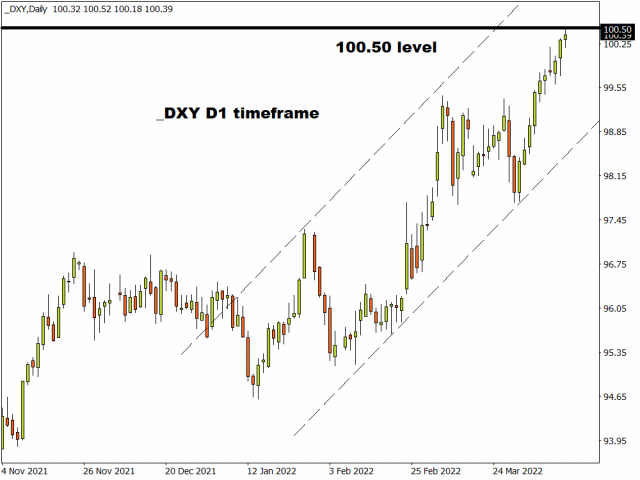
Dollar bulls were injected with fresh inspiration yesterday thanks to hawkish comments from Federal Reserve Governor Lael Brainard. Appetite towards the greenback was sweetened further by geopolitical risks which sent investors rushing towards safe-haven destinations. With the dollar index (DXY) hitting a fresh 2-year high at 100.50, the path of least resistance certainly points north.

Interestingly, bulls were unable to draw strength from the latest US inflation report which showed prices rising at their fastest pace in more than 40 years. Although CPI jumped 8.5% in March, the core CPI that excludes food and energy prices climbed 6.5%. The weaker than expected core print gave investors hope that inflation could be peaking. Nevertheless, dollar strength is likely to remain an ongoing theme this week.

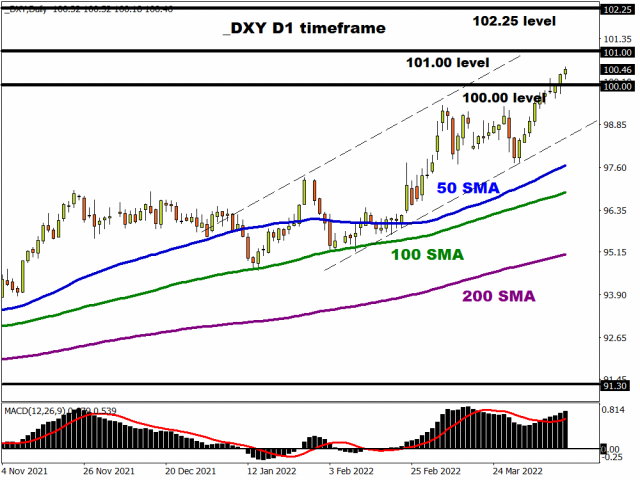
Looking back at the technical picture, the DXY remains firmly bullish on the daily charts, and as highlighted earlier in the week, a strong close above 100 could open the doors toward 101.00 and 102.25.

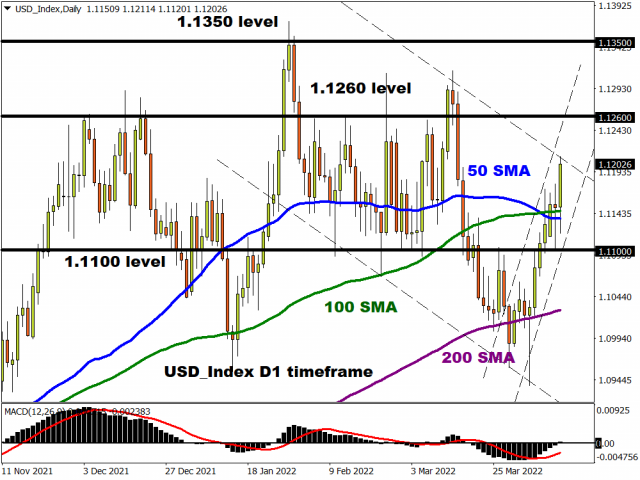
There is a similar theme on the equally-weighted USD Index as bulls shift their weight. Prices are approaching the resistance 1.1260. A solid breakout above this point could open the doors towards 1.1350.

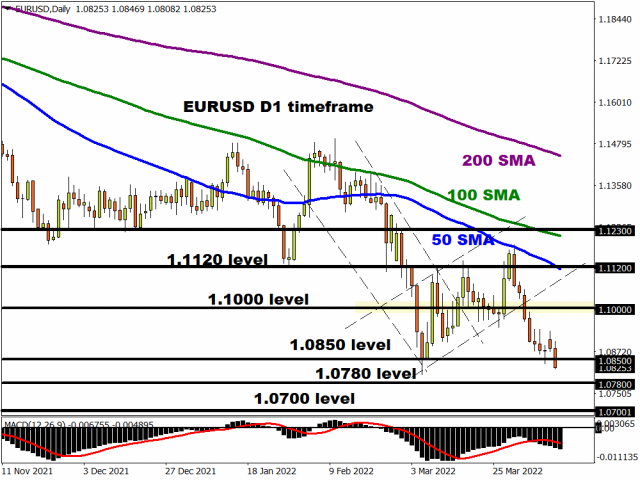
EURUSD breaches 1.0850

In our trade of the week, we discussed the possibility of a breakdown happening in the EURUSD. Fast forward to today, prices are trading below the 1.0850 support level. The currency pair remains bearish on the daily charts with the next key levels of interest at 1.0780 and 1.0700. Although the current trend points to further downside, it may be wise to keep a close eye on the European Central Bank announcement on Thursday afternoon.

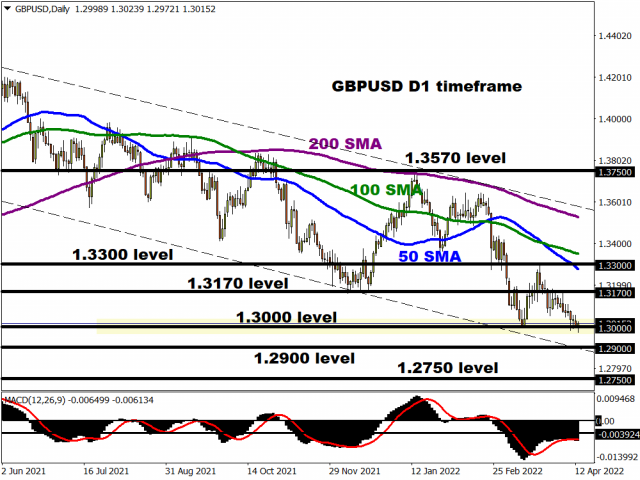
GBPUSD wobbles above 1.3000

A breakdown could be on the horizon for the GBPUSD. The currency pair is struggling to keep above the 1.3000 support level while the lagging indicators favour bears. There have been consistently lower lows and lower highs while the MACD trades below zero. A strong daily close below 1.3000 could trigger a decline towards 1.2900 and 1.2750, respectively.

Should 1.3000 prove to be reliable support, a rebound back towards 1.3170 could be on the cards.

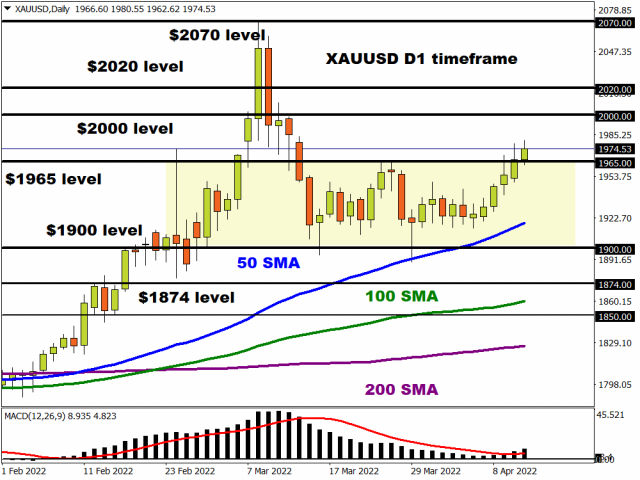
Is Gold in the process of a breakout?

After being trapped within a range for an extended period, gold could be experiencing a breakout.

Prices are trading above the $1965 resistance as of writing but bulls need a solid daily close above this level encourages further upside. While lagging indicators like the 50, 100, and 200 day-SMA point to higher gold prices, fundamentals could impact the current trajectory. A solid close above $1965 could trigger an incline towards $2000 and $2020. If prices slip back under $1965, the precious metal may test $1940 and $1900, respectively.

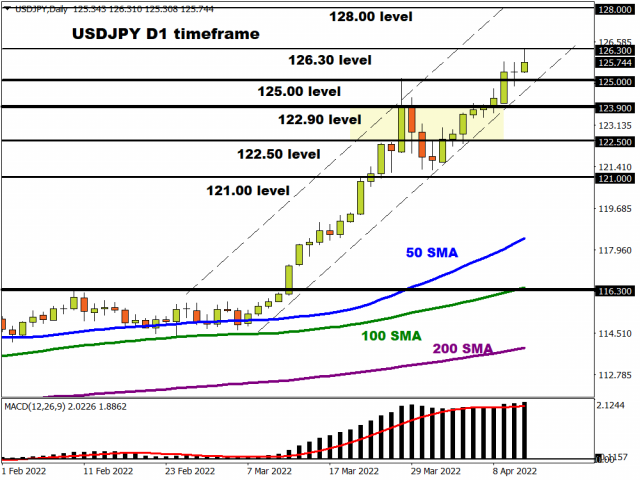
USDJPY up up and away…

The USDJPY has jumped to its highest level in two decades. Prices broke through the 2015 high of 125.86 to hit the 126.30 level. Prices are heavily bullish with a daily close above 126.00 potentially opening the doors towards 126.70 and 128.00. Although the trend is bullish, there could be a technical throwback before prices push higher. It may be worth keeping an eye on how prices behave around 125.00.

AUDUSD under pressure…

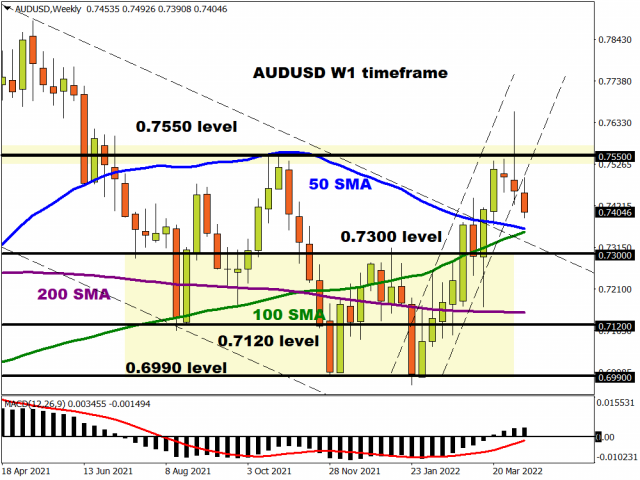
After failing to close above the 0.7550 resistance last week, the AUDUSD has been under pressure. It looks like the downside is gaining momentum on the weekly charts with 0.7300 acting as a major level of interest.

Disclaimer: The content in this article comprises personal opinions and should not be construed as containing personal and/or other investment advice and/or an offer of and/or solicitation for any transactions in financial instruments and/or a guarantee and/or prediction of future performance. ForexTime (FXTM), its affiliates, agents, directors, officers or employees do not guarantee the accuracy, validity, timeliness or completeness, of any information or data made available and assume no liability as to any loss arising from any investment based on the same.


Forex-Time-LogoArticle by ForexTime

ForexTime Ltd (FXTM) is an award winning international online forex broker regulated by CySEC 185/12 www.forextime.com

Murrey Math Lines 13.04.2022 (USDJPY, USDCAD)

Article By RoboForex.com

USDJPY, “US Dollar vs. Japanese Yen”

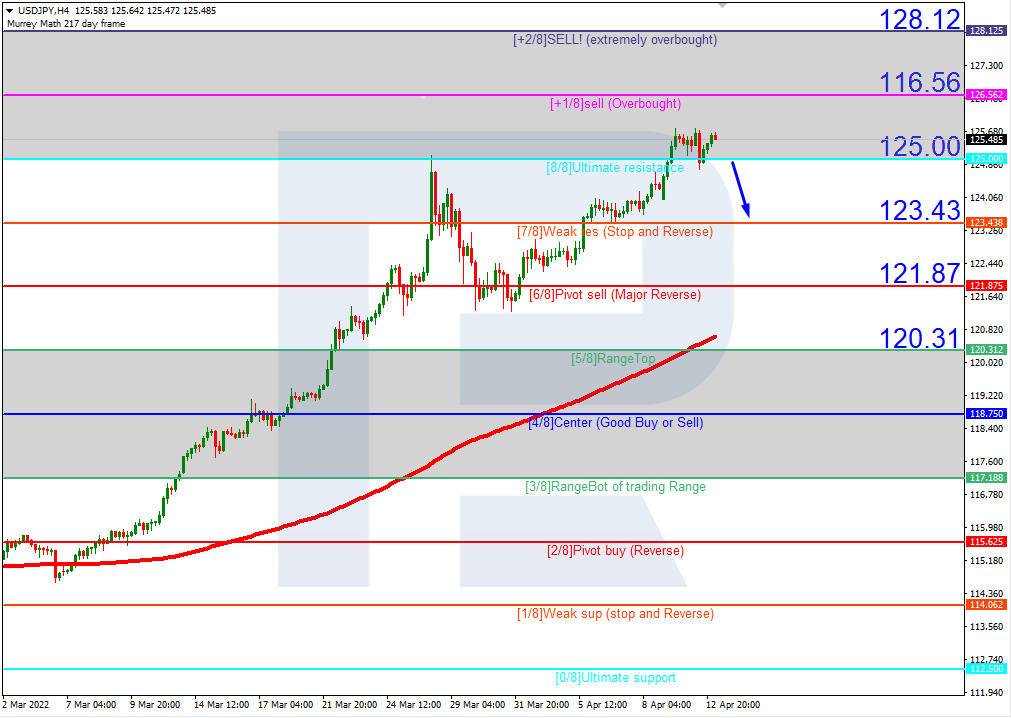
In the H4 chart, USDJPY is trading within the “overbought area”. In this case, the price is expected to test 8/8, break it, and then continue falling to reach the support at 7/8. However, this scenario may no longer be valid if the price breaks the resistance at +1/8 to the upside. After that, the instrument may grow towards +2/8.

USDJPYH4
Risk Warning: the result of previous trading operations do not guarantee the same results in the future

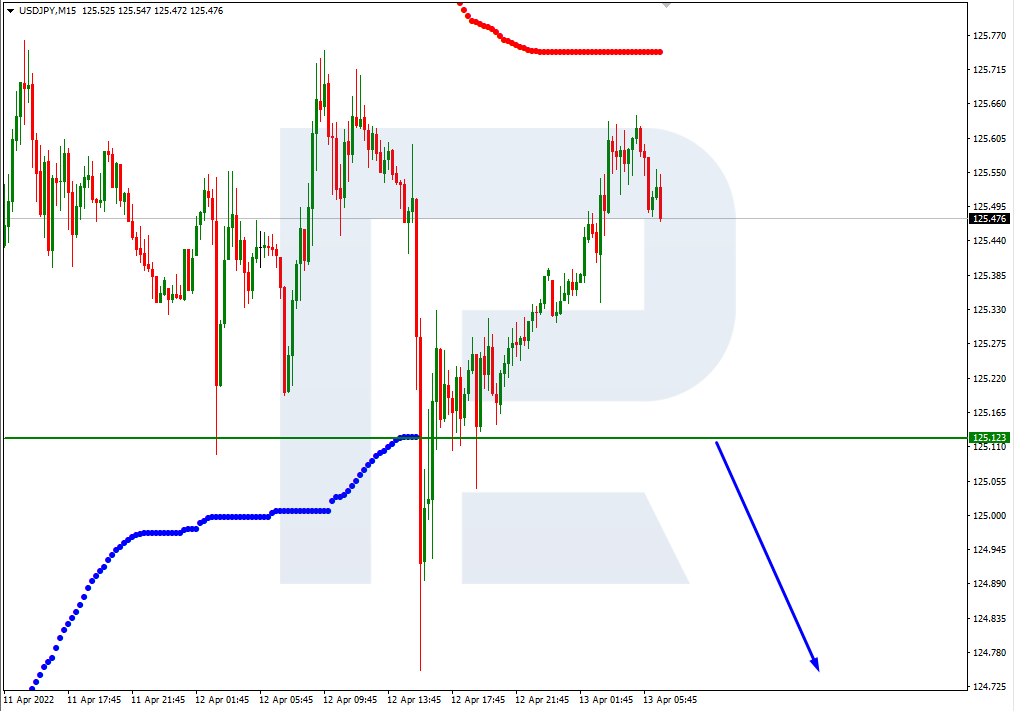
In the M15 chart, the pair may break the downside line of the VoltyChannel indicator and, as a result, continue trading downwards.

USDJPY_M15
Risk Warning: the result of previous trading operations do not guarantee the same results in the future

USDCAD, “US Dollar vs Canadian Dollar”

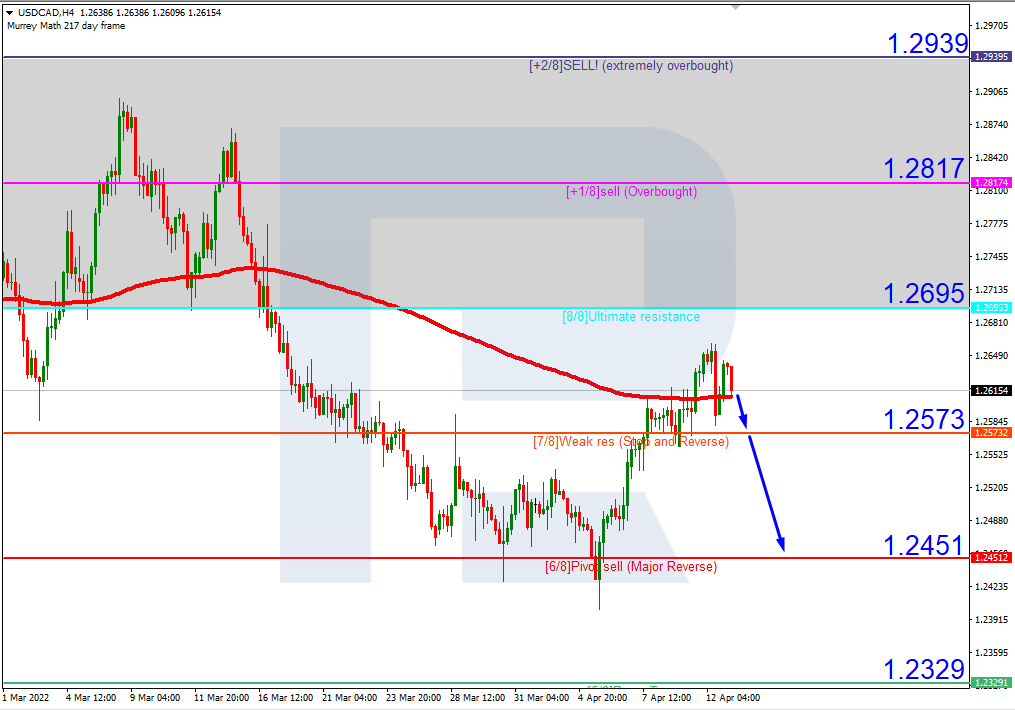
As we can see in the H4 chart, USDCAD is moving close to the “overbought area” at the 200-day Moving Average, so it’s difficult to determine any particular tendency right now. The chart shows that the asset was moving inside this area not long time ago; however, then it broke 8/8 and reached the support at 6/8. At the moment, there is a possibility that this scenario may repeat but from the current levels. Still, to confirm this idea, the [price must break 7/8 first. On the other hand, this scenario may no longer be valid if the pair breaks the resistance at 8/8 to the upside. After that, the instrument may reverse and move upwards to reach +1/8.

USDCAD_H4
Risk Warning: the result of previous trading operations do not guarantee the same results in the future

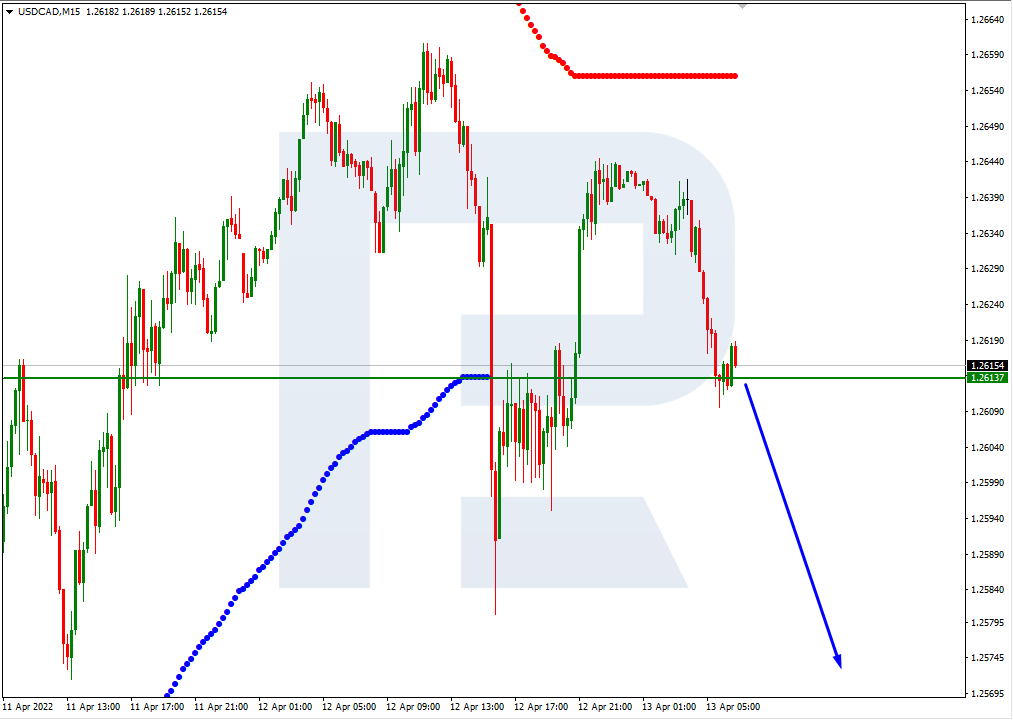
In the M15 chart, the pair may break the downside line of the VoltyChannel indicator and, as a result, continue its decline.

USDCAD_M15

Article By RoboForex.com

Attention!
Forecasts presented in this section only reflect the author’s private opinion and should not be considered as guidance for trading. RoboForex LP bears no responsibility for trading results based on trading recommendations described in these analytical reviews.

The Kiwi improved. Overview for 13.04.2022

Article By RoboForex.com

NZDUSD rose after the RBNZ’s decisions but couldn’t keep up.

The New Zealand Dollar rose pretty much against the USD in the morning but couldn’t keep the positive momentum later. The current quote for the instrument is 0.6788.

During its April meeting, the Reserve Bank of New Zealand raised the benchmark interest rate by 50 basis points, up to 1.5% to fight inflation. Average market expectations implied a 25-point hike, up to 1.25%.

In the comments that followed, the regulator said that it was going to continue strengthening its monetary policy – it would take the path of least resistance and implement more significant rate hikes now instead of later.

By raising the rate by 50 basis points, the RBNZ will have a more flexible monetary policy amid global uncertainty. This strategy is quite interesting although very unusual for the present situation.

The regulator is planning to focus on keeping high inflation under control and prevent it from becoming a long-term trend.

The NZD improved quite well right after the regulator’s decisions, but not for long. The Kiwi lost its positive momentum and is now under the USD’s pressure again.

Article By RoboForex.com

Attention!
Forecasts presented in this section only reflect the author’s private opinion and should not be considered as guidance for trading. RoboForex LP bears no responsibility for trading results based on trading recommendations described in these analytical reviews.

The Analytical Overview of the Main Currency Pairs on 2022.04.13

by JustForex

The EUR/USD currency pair

Technical indicators of the currency pair:
  • Prev Open: 1.0882
  • Prev Close: 1.0825
  • % chg. over the last day: -0.52%

In December 1981, the interest rate on bonds was 13%, and today it is only 0.33%. This means that the real federal funds rate is -8.2%. The US Fed must be aggressive in its monetary policy. FOMC spokesman Brainard said yesterday that the Fed is considering a balance sheet reduction starting in June.

Trading recommendations
  • Support levels: 1.0823, 1.0633
  • Resistance levels: 1.0865, 1.0946, 1.0958, 1.1027, 1.1075, 1.1135, 1.1196, 1.1291

From the technical point of view, the trend on the EUR/USD currency pair in the hourly time frame is bearish. The price has adopted a more flat structure. The MACD indicator is in the negative zone, but signs of divergence are increasing. Under such market conditions, it is possible to look for buy trades on intraday timeframes from the support level of 1.0823, but only with short targets and confirmation. Sell trades should be considered from the resistance level of 1.0865 or 1.0945, but only after the additional confirmation.

Alternative scenario: if the price breaks out through the 1.1075 resistance level and fixes above, the uptrend will likely resume.

EUR/USD
News feed for 2022.04.13:
  • – Eurozone Industrial Production (m/m) at 12:00 (GMT+3);
  • – US Producer Price Index (m/m) at 15:30 (GMT+3).

The GBP/USD currency pair

Technical indicators of the currency pair:
  • Prev Open: 1.3030
  • Prev Close: 1.3000
  • % chg. over the last day: -0.23%

The annual UK consumer price index rose to 7.0%, and inflation rose by +0.8% over the last month. The core inflation index, excluding food and energy prices, also jumped from 5.2% to 5.7% year on year. Such a jump in consumer prices undoubtedly requires actions by the Bank of England.

Trading recommendations
  • Support levels: 1.2976, 1.2863
  • Resistance levels: 1.3060, 1.3107, 1.3144, 1.3181, 1.3244, 1.3274

On the hourly time frame, the GBP/USD currency pair trend is bearish. The price has taken a more flat structure. The MACD indicator has become inactive. Under such market conditions, sell trades should be looked for from the resistance level of 1.3060, but with confirmation. For buy deals, traders may consider the level of 1.2976 if the price shows bullish initiative.

Alternative scenario: if the price breaks down through the 1.3181 resistance level and fixes above, the mid-term uptrend will likely be resumed.

GBP/USD
News feed for 2022.04.13:
  • – UK Consumer Price Index (m/m) at 09:00 (GMT+3);
  • – UK Producer Price Index (m/m) at 09:00 (GMT+3).

The USD/JPY currency pair

Technical indicators of the currency pair:
  • Prev Open: 125.35
  • Prev Close: 125.39
  • % chg. over the last day: +0.03%

The fundamental picture for the Japanese yen remains unchanged. The Bank of Japan keeps government bond yields near zero, while US government bonds are rising. The monetary policy of the Bank of Japan is now “ultra-soft” and aims to decrease the national currency rate (USD/JPY growth). The US Fed will tighten monetary policy more aggressively. The dollar index rose to its highest level in almost two years. The medium-term forecast remains unchanged – analysts see a continuation of the uptrend, as the monetary policies of the central banks in the United States and Japan are now opposed.

Trading recommendations
  • Support levels: 124.66, 124.24, 122.97, 122.63, 121.81
  • Resistance levels: 125.82

The medium-term trend on the USD/JPY currency pair is bullish. The MACD indicator has become inactive, and buyer pressure is decreasing. But the price has deviated very much from the moving averages. Under such market conditions, it is best to look for buy deals, expecting the continuation of the uptrend, but after the price makes a pullback to the average lines. First of all, it is worth considering the support level of 124.66 or 124.24, but with additional confirmation. A resistance level of 125.82 may be considered for sell deals, but only after the seller’s initiative and only with short targets.

Alternative scenario: If the price fixes below 121.81, the uptrend will likely be broken.

USD/JPY
News feed for 2022.04.13:
  • – Japan BOJ Gov Kuroda’s Speech at 09:15 (GMT+3).

The USD/CAD currency pair

Technical indicators of the currency pair:
  • Prev Open: 1.2627
  • Prev Close: 1.2641
  • % chg. over the last day: +0.11%

Central Bank of Canada’s interest rate meeting will take place today. Analysts expect to see the steepest rate hike in 22 years as policymakers worldwide begin to step up efforts to curb rising price pressures. The Canadian dollar is a commodity currency and is also highly dependent on changes in oil prices and the dollar index. Oil prices rose back above $100 a barrel on Tuesday as Shanghai’s efforts to ease some Covid-19 quarantine measures eased concerns about the impact on global demand.

Trading recommendations
  • Support levels: 1.2560, 1.2476, 1.2430
  • Resistance levels: 1.2631, 1.2713, 1.2754, 1.2851

In terms of technical analysis, the USD/CAD currency pair is bullish. The MACD indicator has become inactive. There are the first signs of sellers’ strength. Trade is worth it only with short targets because, fundamentally, there are no prerequisites for the medium-term trend on the USD/CAD currency pair. Under such market conditions, it is better to look for buy trades on the lower timeframes from the support level of 1.2560, but it is better with additional confirmation. For sell deals, it is better to consider the resistance level of 1.2631, but it is better with confirmation.

Alternative scenario: if the price breaks through and consolidates below 1.2430, the downtrend will likely be resumed.

USD/CAD
News feed for 2022.04.13:
  • – Canada BoC Interest Rate Decision at 17:00 (GMT+3);
  • – Canada BoC Monetary Policy Report at 17:00 (GMT+3);
  • – US Crude Oil Reserves (w/w) at 17:30 (GMT+3);
  • – Canada BoC Press Conference at 18:00 (GMT+3).

by JustForex


This article reflects a personal opinion and should not be interpreted as an investment advice, and/or offer, and/or a persistent request for carrying out financial transactions, and/or a guarantee, and/or a forecast of future events.
Rising global inflation forces central banks to revise the monetary policy in a tighter direction

by JustForex

The US consumer price index rose to 8.5% y/y, beating economists’ forecasts of 8.4%, but investors’ attention was focused on the core CPI, which excludes food and energy prices. The core CPI increased by 0.3% in March, slower than the 0.5% forecast by economists. Amid a jump in inflation, the dollar index rose sharply yesterday, causing major indices to fall. At the end of the day, the Dow Jones Index (US30) decreased by 0.6% yesterday, the S&P 500 Index (US500) lost 0.34%, and the NASDAQ Technology Index (US100) fell by 0.30%.

Inflation data led to a decline in US yields on Tuesday, but they recovered slightly late in the day and early in trading on Wednesday.

The US earning season for the first quarter of 2022 has begun. JPMorgan, BlackRock, Infosys, Fastenal, First Republic Bank, Tesco, and Delta Airlines will report today.

European stock markets closed in the red zone yesterday. German DAX (DE30) decreased by 0.48% yesterday, French CAC 40 (FR 40) lost 0.28%, Spanish IBEX 35 (ES35) fell by 0.08%, British FTSE 100 (UK100) lost 0.55%. In March, the UK consumer price inflation jumped to 7.0% y/y, the highest level since March 1992. The core inflation index, excluding food and energy prices, also jumped from 5.2% to 5.7% y/y. Russia’s invasion of Ukraine on February 24 led to higher energy prices, and last month the UK Office of Fiscal Responsibility predicted that the consumer price index would reach 8.7% in the last quarter of 2022. Such a jump in consumer prices undoubtedly requires actions by the Bank of England. Financial participants believe that the Bank of England will almost certainly raise interest rates to 1% at its next meeting on May 5 and then bring them up to 2%-2.25% by the end of 2022. The European Central Bank will hold a meeting on Thursday, and pressure on policymakers to tighten monetary policy has intensified as consumer price inflation in Europe continues to rise. In Germany, inflation increased to 7.3% y/y, and the annual CPI jumped to 9.8% in Spain.

Russian President Vladimir Putin said that the peace talks “once again deadlocked for us.” Hopes for peace are fading as Russia builds up its army in Southeast Ukraine. US President Joe Biden has said for the first time that Moscow’s invasion of Ukraine is tantamount to genocide, and the United States is reportedly set to announce an additional $750 million in military aid, a sign that the war will continue. Today, the Pentagon will host leaders of eight major US weapons manufacturers to discuss the industry’s ability to meet Ukraine’s weapons needs if the war with Russia continues for years.

Oil prices rose above $100 a barrel on Tuesday as Shanghai’s efforts to ease some quarantine measures over Covid-19 eased concerns about the impact on global demand. The rise in oil prices came ahead of new weekly US oil reserves data, which are expected to show a second-week increase in inventories.

Stock indices of the Asia-Pacific region showed mixed movements yesterday. Japan’s Nikkei 225 (JP225) lost 1.81%, Australia’s S&P/ASX 200 (AU200) decreased by 0.42%, while Hong Kong’s Hang Seng (HK50) gained 0.52%.

The central bank of New Zealand has announced the steepest interest rate hike in two decades to curb inflation. RBNZ raised the rate immediately by 0.5%. Chinese exports continued to grow in the first quarter of 2022, but the war in Ukraine and the latest COVID-19 outbreak in the country may slow exports in the next quarter. Over the past two years, China’s strong trade performance could slow in 2022 as other countries loosened restrictive measures related to COVID-19. The surge in energy prices and supply disruptions caused by the war in Ukraine continues to put pressure on exporters. On Wednesday, Bank of Japan Governor Haruhiko Kuroda said that the central bank would continue its ultra-soft monetary policy to support the economy under pressure from rising import costs.

Main market quotes:

S&P 500 (F) (US500) 4,397.45 -15.08 (-0.34%)

Dow Jones (US30) 34,220.36 -87.72 (-0.26%)

DAX (DE40) 14,124.95 -67.83 (-0.48%)

FTSE 100 (UK100) 7,576.66 -41.65 (-0.55%)

USD Index 100.31 +0.38 (+0.38%)

Important events for today:
  • – New Zealand RBNZ Interest Rate Decision at 05:00 (GMT+3);
  • – New Zealand RBNZ Rate Statement at 05:00 (GMT+3);
  • – UK Consumer Price Index (m/m) at 09:00 (GMT+3);
  • – UK Producer Price Index (m/m) at 09:00 (GMT+3);
  • – Japan BOJ Gov Kuroda’s Speech at 09:15 (GMT+3);
  • – Eurozone Industrial Production (m/m) at 12:00 (GMT+3);
  • – US Producer Price Index (m/m) at 15:30 (GMT+3);
  • – Canada BoC Interest Rate Decision at 17:00 (GMT+3);
  • – Canada BoC Monetary Policy Report at 17:00 (GMT+3);
  • – US Crude Oil Reserves (w/w) at 17:30 (GMT+3);
  • – Canada BoC Press Conference at 18:00 (GMT+3).

by JustForex


This article reflects a personal opinion and should not be interpreted as an investment advice, and/or offer, and/or a persistent request for carrying out financial transactions, and/or a guarantee, and/or a forecast of future events.
Ichimoku Cloud Analysis 12.04.2022 (NZDUSD, GBPUSD, USDCAD)

Article By RoboForex.com

NZDUSD, “New Zealand Dollar vs US Dollar”

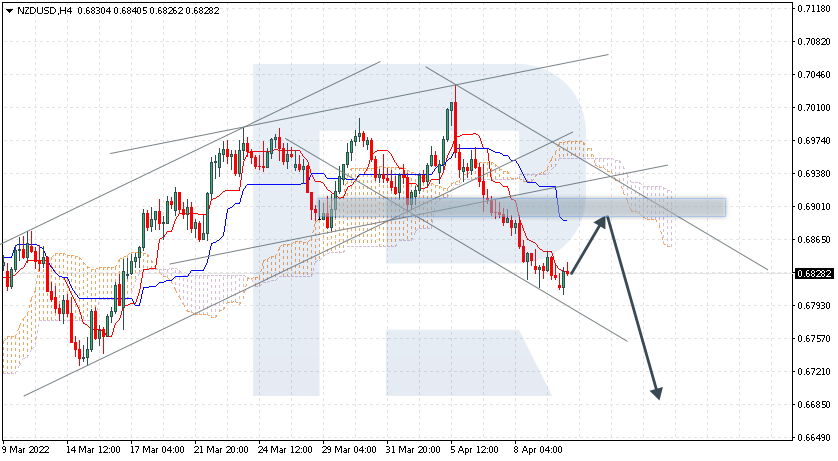
NZDUSD is rebounding from Tenkan-Sen at 0.6828; the instrument is moving below Ichimoku Cloud, thus indicating a descending tendency. The markets could indicate that the price may test Tenkan-Sen and Kijun-Sen at 0.6880 and then resume moving downwards to reach 0.6685. Another signal in favour of a further downtrend will be a rebound from the resistance level. However, the bearish scenario may no longer be valid if the price breaks the cloud’s upside border and fixes above 0.6955. In this case, the pair may continue growing towards 0.7045.

NZDUSD
Risk Warning: the result of previous trading operations do not guarantee the same results in the future

GBPUSD, “Great Britain Pound vs US Dollar”

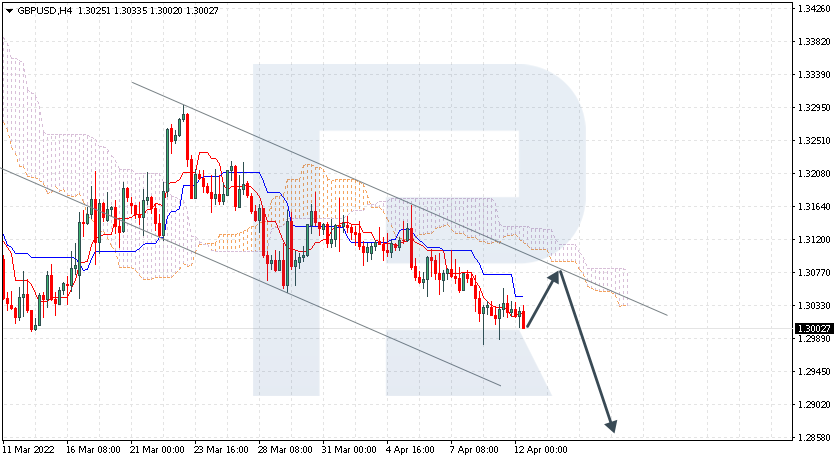
GBPUSD is still testing the support level at 1.3002 (bears failed to break this significant area in March 2022); the instrument is moving below Ichimoku Cloud, thus indicating a descending tendency. The markets could indicate that the price may test Tenkan-Sen and Kijun-Sen at 1.3075 and then resume moving downwards to reach 1.2860. Another signal in favour of a further downtrend will be a rebound from the descending channel’s upside border. However, the bearish scenario may no longer be valid if the price breaks the cloud’s upside border and fixes above 1.3125. In this case, the pair may continue growing towards 1.3215.

GBPUSD
Risk Warning: the result of previous trading operations do not guarantee the same results in the future

USDCAD, “US Dollar vs Canadian Dollar”

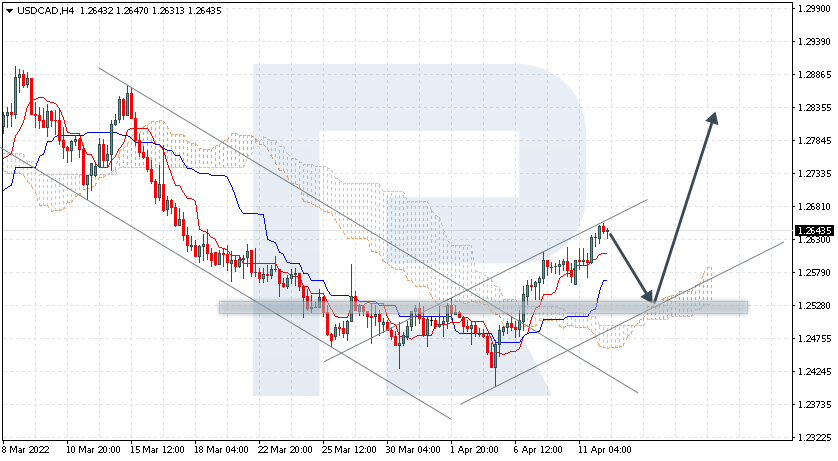
USDCAD continues rising within the bullish channel at 1.2643; the instrument is moving above Ichimoku Cloud, thus indicating an ascending tendency. The markets could indicate that the price may test the cloud’s upside border at 1.2530 and then resume moving upwards to reach 1.2835. Another signal in favour of a further uptrend will be a rebound from the rising channel’s downside border. However, the bullish scenario may no longer be valid if the price breaks the cloud’s downside border and fixes below 1.2430. In this case, the pair may continue falling towards 1.2340.

USDCAD

Article By RoboForex.com

Attention!
Forecasts presented in this section only reflect the author’s private opinion and should not be considered as guidance for trading. RoboForex LP bears no responsibility for trading results based on trading recommendations described in these analytical reviews.

Murrey Math Lines 12.04.2022 (AUDUSD, NZDUSD)

Article By RoboForex.com

AUDUSD, “Australian Dollar vs US Dollar”

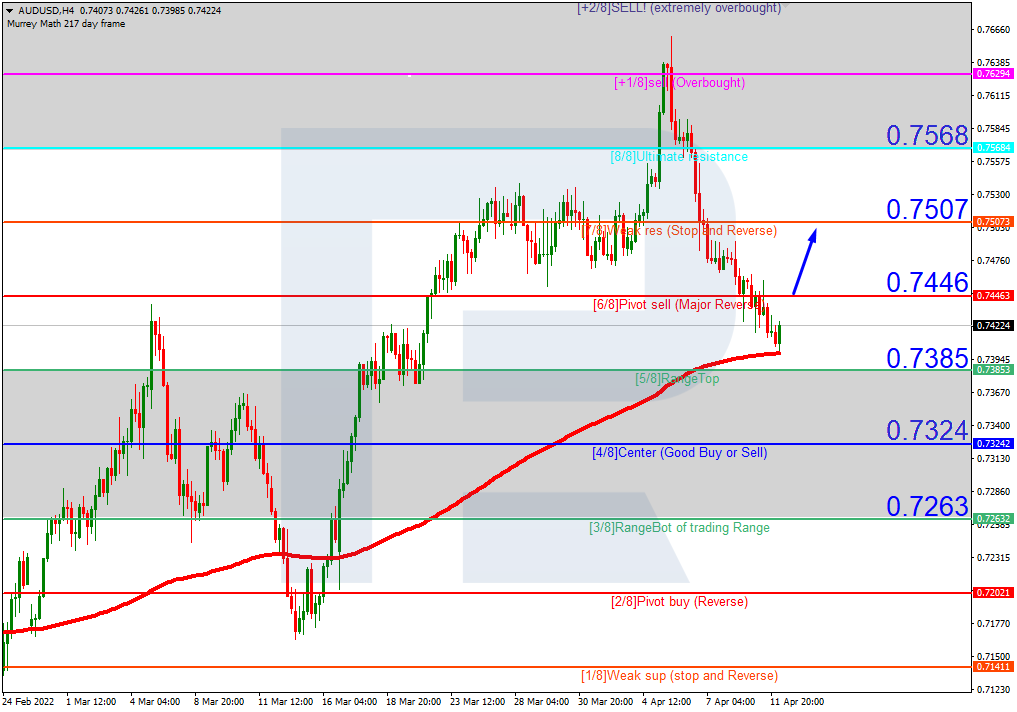
As we can see in the H4 chart, AUDUSD is trading above the 200-day Moving Average to indicate an ascending tendency. In this case, the price is expected to test 6/8, break it, and then continue growing to reach the resistance at 7/8. However, this scenario may no longer be valid if the price breaks the support at 5/8 to the downside. After that, the instrument may reverse and fall towards 4/8.

AUDUSDH4
Risk Warning: the result of previous trading operations do not guarantee the same results in the future

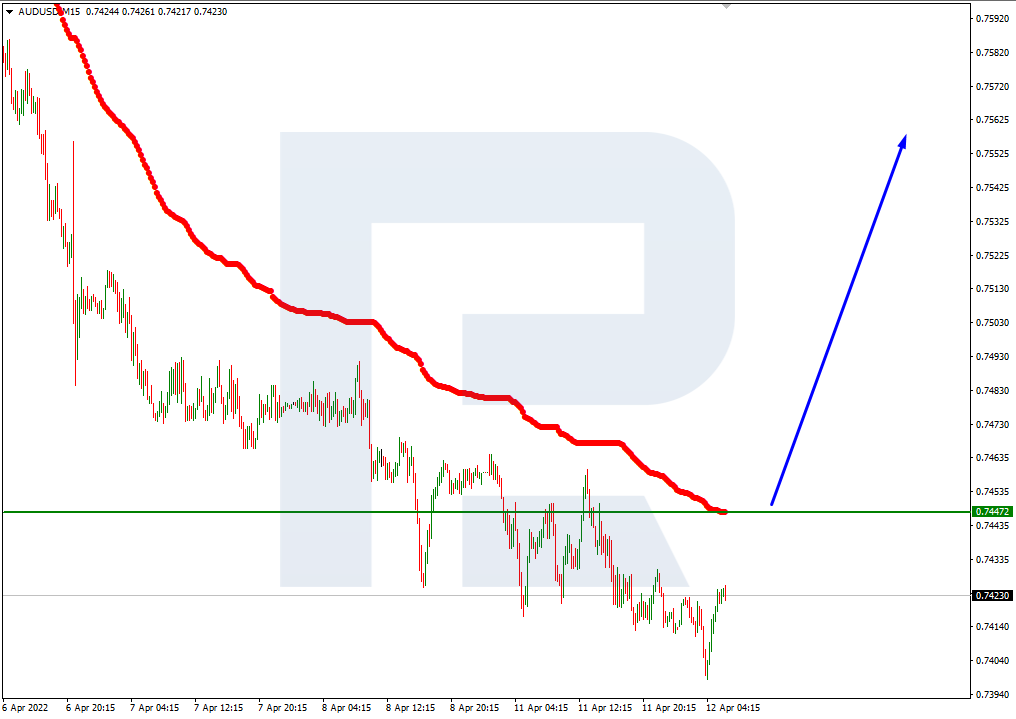
In the M15 chart, the pair may break the upside line of the VoltyChannel indicator and, as a result, continue trading upwards.

AUDUSD_M15
Risk Warning: the result of previous trading operations do not guarantee the same results in the future

NZDUSD, “New Zealand Dollar vs US Dollar”

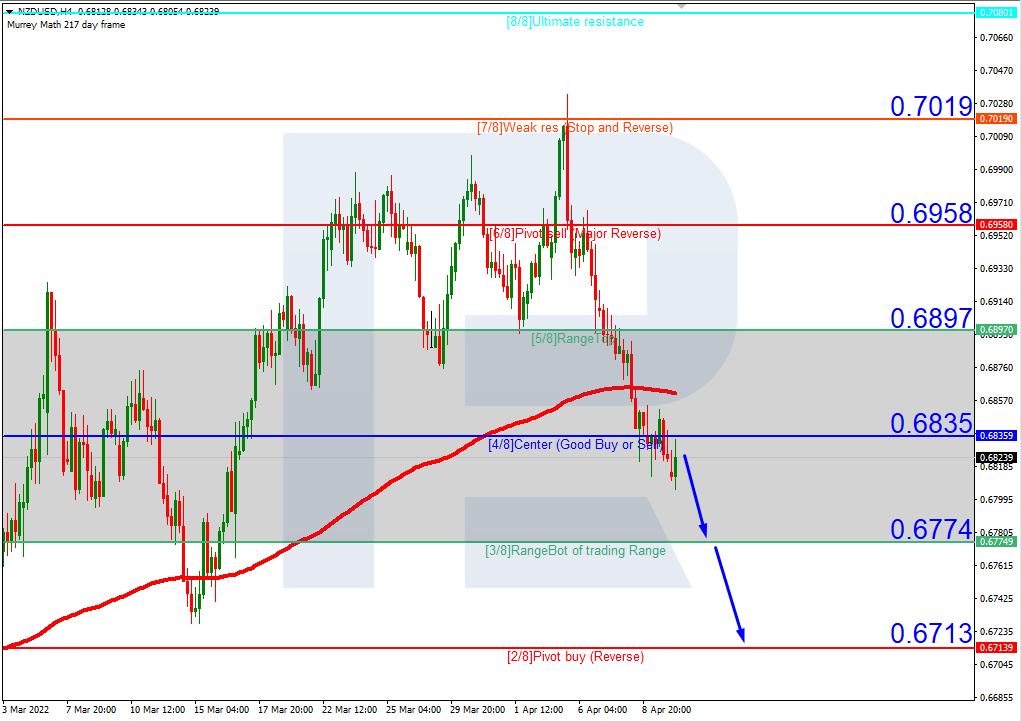
In the H4 chart, NZDUSD is trading below the 200-day Moving Average, thus indicating a possible descending tendency. In this case, the price is expected to rebound from 4/8 and then resume moving downwards to reach the support at 2/8. However, this scenario may no longer be valid if the price breaks the resistance at 4/8 to the upside. After that, the instrument may grow towards 5/8.

NZDUSD_H4
Risk Warning: the result of previous trading operations do not guarantee the same results in the future

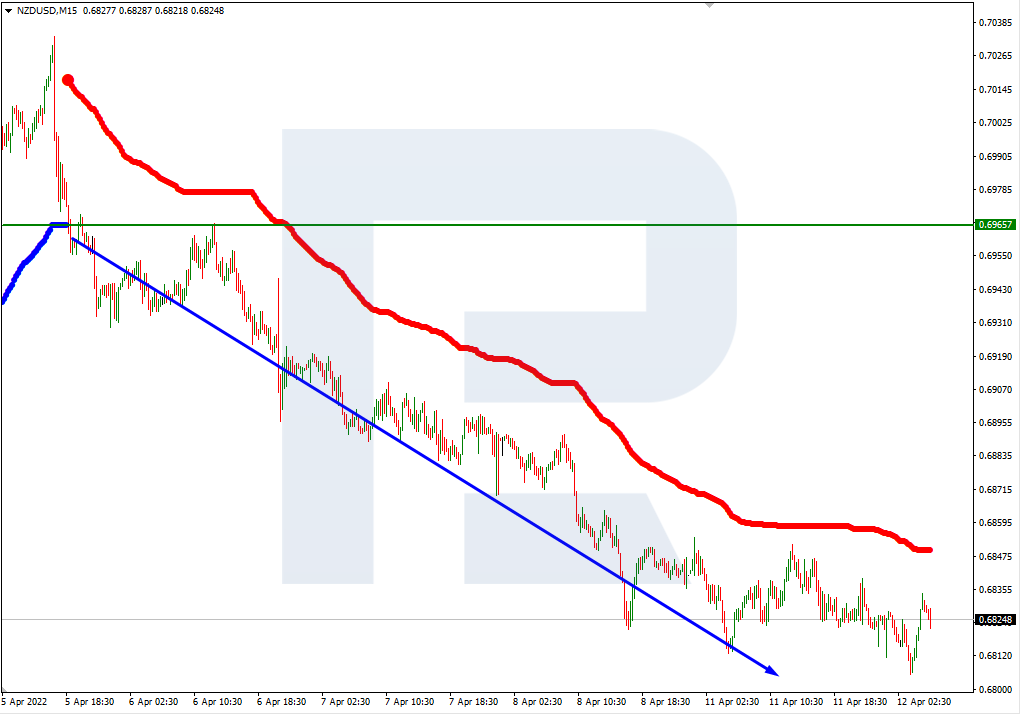
As we can see in the M15 chart, the pair has broken the downside line of the VoltyChannel indicator and, as a result, may continue its decline.

NZDUSD_M15

Article By RoboForex.com

Attention!
Forecasts presented in this section only reflect the author’s private opinion and should not be considered as guidance for trading. RoboForex LP bears no responsibility for trading results based on trading recommendations described in these analytical reviews.

The Analytical Overview of the Main Currency Pairs on 2022.04.12

by JustForex

The EUR/USD currency pair

Technical indicators of the currency pair:
  • Prev Open: 1.0920
  • Prev Close: 1.0883
  • % chg. over the last day: -0.33%

Inflation reports will be released today in the US and Germany. Analysts forecast another 1.2% increase in US inflation. Germany’s inflation rate in March 2022 was 7.3% year on year. Last month, the value was 5.1%. Thus, German inflation in March 2022 reached its highest level since the German reunification. ZEW institute forecasts are also important indicators of the European economy, and analysts expect a significant slowdown.

Trading recommendations
  • Support levels: 1.0857, 1.0823, 1.0633
  • Resistance levels: 1.0946, 1.0958, 1.1027, 1.1075, 1.1135, 1.1196, 1.1291

From the technical point of view, the trend on the EUR/USD currency pair in the hourly time frame is bearish. The price has adopted a more flat structure. The MACD indicator is inactive, but the first signs of buyers have appeared. Under such market conditions, it is possible to look for buy trades on intraday timeframes from the support level of 1.0857, but only with short targets and confirmation. Sell trades should be considered from the resistance level of 1.0946 or 1.0958, but only after the additional confirmation.

Alternative scenario: if the price breaks out through the 1.1075 resistance level and fixes above, the uptrend will likely resume.

EUR/USD
News feed for 2022.04.12:
  • – German Consumer Price Index (m/m) at 09:00 (GMT+3);
  • – German ZEW Economic Sentiment (m/m) at 12:00 (GMT+3);
  • – Eurozone ZEW Economic Sentiment (m/m) at 12:00 (GMT+3);
  • – US Consumer Price Index (m/m) at 15:30 (GMT+3);
  • – US FOMC Member Brainard Speaks at 19:10 (GMT+3).

The GBP/USD currency pair

Technical indicators of the currency pair:
  • Prev Open: 1.3029
  • Prev Close: 1.3023
  • % chg. over the last day: -0.04%

Rising inflation in the US will increase expectations of an aggressive tightening by the Federal Reserve. Against this background, the dollar index may continue to rise, which will harm the British pound due to declining UK economic indicators.

Trading recommendations
  • Support levels: 1.2976, 1.2863
  • Resistance levels: 1.3053, 1.3107, 1.3144, 1.3181, 1.3244, 1.3274

On the hourly time frame, the GBP/USD currency pair trend has changed to bearish. Buyers failed to hold the priority change level. The price has consolidated below the moving averages. The MACD indicator has become inactive. Under such market conditions, sell trades should be looked for from the resistance level of 1.3053, but with confirmation. For buy deals, traders may consider the level of 1.2976 if the price shows bullish initiative.

Alternative scenario: if the price breaks down through the 1.3181 resistance level and fixes above, the mid-term uptrend will likely be resumed.

GBP/USD
News feed for 2022.04.12:
  • – UK Claimant Count Change (m/m) at 09:00 (GMT+3);
  • – UK Unemployment Rate (m/m) at 09:00 (GMT+3).

The USD/JPY currency pair

Technical indicators of the currency pair:
  • Prev Open: 124.01
  • Prev Close: 125.38
  • % chg. over the last day: +1.10%

The fundamental picture for the Japanese yen remains unchanged. The Bank of Japan keeps government bond yields near zero, while US government bonds are rising. The monetary policy of the Bank of Japan is now “ultra-soft” and aims to decrease the national currency rate (USD/JPY growth). The US Fed will tighten monetary policy more aggressively. The dollar index rose to its highest level in almost two years. The medium-term forecast remains unchanged – analysts see a continuation of the uptrend, as the monetary policies of the central banks in the United States and Japan are now opposed.

Trading recommendations
  • Support levels: 124.66, 124.24, 122.97, 122.63, 121.81
  • Resistance levels: 125.28, 125.82

The medium-term trend on the USD/JPY currency pair is bullish. The MACD indicator is positive again. The buyers’ pressure is increasing. But the price has deviated very much from the moving averages. Under such market conditions, it is best to look for buy deals, expecting the continuation of the uptrend, but after the price makes a pullback to the average lines. First of all, it is worth considering the support level of 124.66 or 124.24, but with additional confirmation. A resistance level of 125.82 may be considered for sell deals, but only after the seller’s initiative and only with short targets.

Alternative scenario: If the price fixes below 121.81, the uptrend will likely be broken.

USD/JPY
News feed for 2022.04.12:
  • – Japan Producer Price Index (m/m) at 02:50 (GMT+3).

The USD/CAD currency pair

Technical indicators of the currency pair:
  • Prev Open: 1.2562
  • Prev Close: 1.2632
  • % chg. over the last day: +0.79%

The Canadian dollar is a commodity currency and is highly dependent on the movement of oil prices and the dollar index. OPEC has told the EU that it is impossible to compensate for the potential loss of Russian oil supplies. Current and future sanctions against Russia could cause serious shocks to oil supplies in history, and it will be impossible to compensate for these volumes. This situation will contribute to rising commodity prices. On the other hand, the Bank of Canada plans to tighten its monetary policy, so in the medium-term, the USD/CAD currency pair will show broad volatility without a single dynamic.

Trading recommendations
  • Support levels: 1.2590, 1.2476, 1.2430
  • Resistance levels: 1.2654, 1.2713, 1.2754, 1.2851

In terms of technical analysis, the USD/CAD currency pair has changed to bullish, as the price has consolidated above moving averages. The MACD indicator is in the positive zone, but there are the first signs of weakness of the buyers. Trade is worth it only with short targets because, fundamentally, there are no prerequisites for the medium-term trend on the USD/CAD currency pair. Under such market conditions, it is better to look for buy trades on the lower timeframes from the support level of 1.2590, but it is better with additional confirmation. For sell deals, it is better to consider the resistance level of 1.2654, but it is better with confirmation.

Alternative scenario: if the price breaks through and consolidates below 1.2430, the downtrend will likely be resumed.

USD/CAD
There is no news feed for today.

by JustForex


This article reflects a personal opinion and should not be interpreted as an investment advice, and/or offer, and/or a persistent request for carrying out financial transactions, and/or a guarantee, and/or a forecast of future events.
Trade Of The Week: Breakdown On The Horizon For EURUSD?

By Lukman Otunuga Senior Research Analyst, ForexTime

Watch this space as the EURUSD could turn volatile over the next few days!

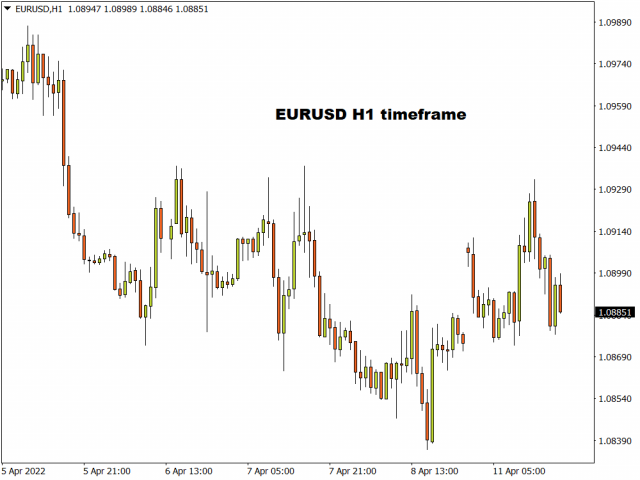
The currency pair seems to be gearing up for a major move with prices hovering above the key 1.0850 support level as of writing. While a solid breakdown below this level could signal further downside, such may require a strong fundamental catalyst. This may come in the form of the US inflation report on Tuesday or the European Central Bank (ECB) meeting on Thursday.

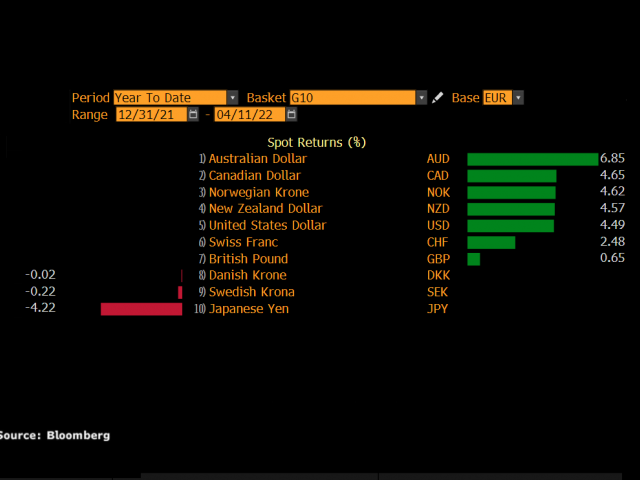
Before we take a deep dive into what to expect from the latest US CPI report and ECB, it is worth keeping in mind that the EURUSD has dropped over 4% year-to-date. The combination of geopolitical risks, surging energy prices and growth concerns continue to weigh on the Euro despite the ECB joining the hawkish bandwagon. Since the start of 2022, the euro has weakened against every single G10 currency excluding the Japanese Yen and Swedish Krona.

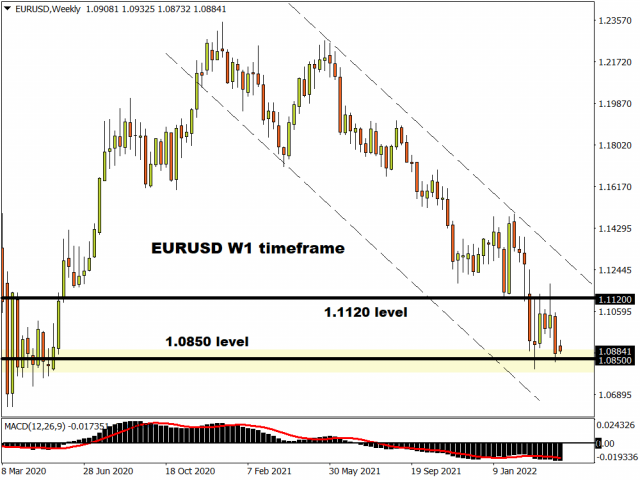
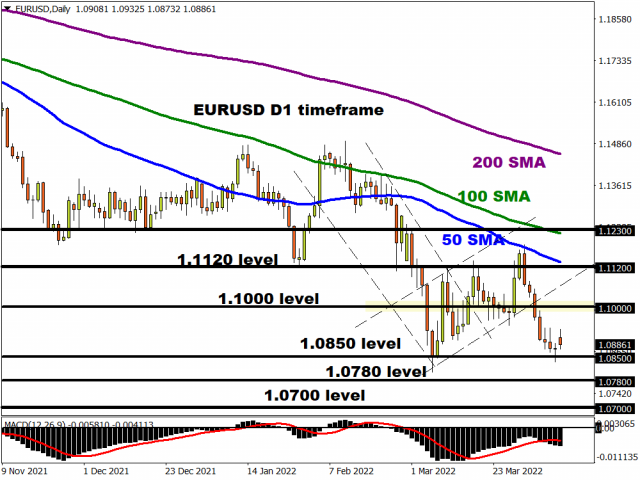
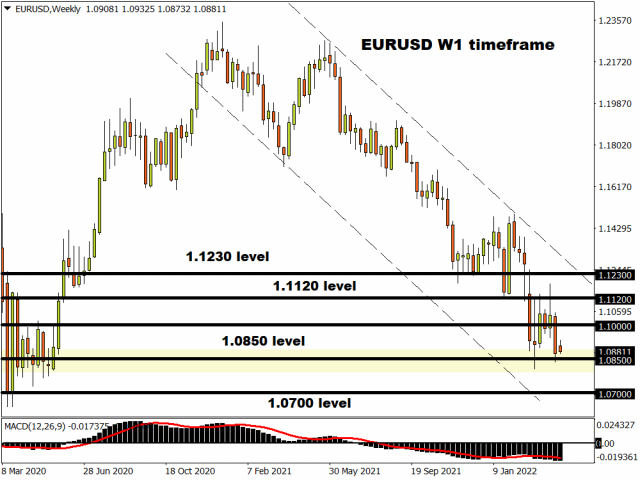
Taking a quick look at the technicals, things are looking noisy on the daily charts with resistance around 1.1120 and support at 1.0850. However, the trend remains firmly bearish on the weekly timeframe. Interestingly, the last time the currency pair secured a weekly close below 1.0850 was back in May 2020 – almost two years ago.

All eyes on the US CPI report…

US inflation is expected to have hit another 40-year high in March.

Consumer prices are forecast to have risen by 8.4% year-over-year, compared to the 7.9% in February. If expectations become reality, this will be the fastest pace since 1981! This could encourage Investors to pile bets on the Federal Reserve adopting a more aggressive pace of rate increases over the next few months – raising speculation around a 50-basis point hike in May (as opposed to the customary 25-basis point moves). Buying sentiment towards the dollar could also receive a boost, which may result in the EURUSD trading lower.

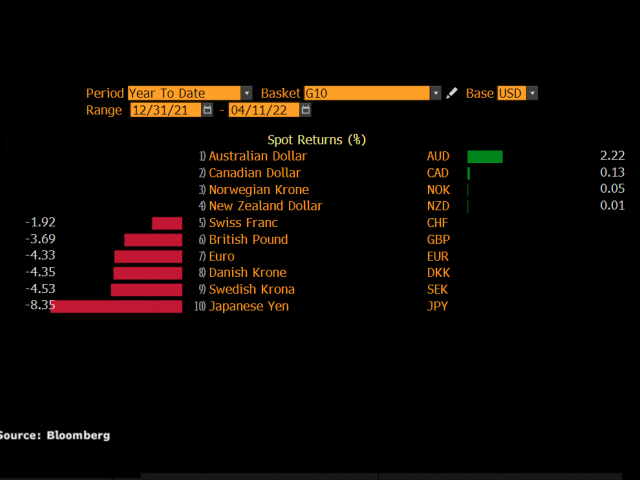
Speaking of the dollar, it has appreciated against most G10 currencies since the start of 2022.

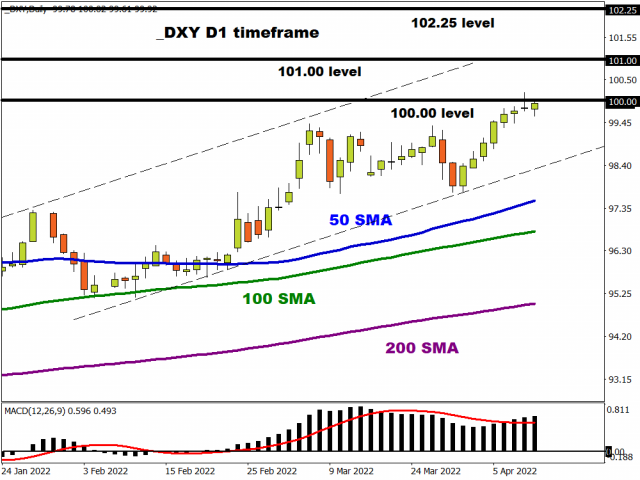
The benchmark dollar index (DXY) is up over 4.4% year-to-date with prices trading marginally below 100.00 as of writing. A solid daily close above 100.00 could open a path towards 101.00 and 102.25.

What to expect from the ECB?

The European Central Bank is widely expected to leave interest rates unchanged when it meets on Thursday. However, it may be unwise to label this as a non-event.

At its last meeting in March, the central bank stated it would accelerate the winding down of its bond-buying stimulus, with the possibility of the scheme ending in Q3 depending on economic data. Minutes from the March meeting were also hawkish, but members of the governing council had split opinions over how to tackle soaring inflation.

Euro area annual inflation surged to an all-time high of 7.5% in March, compared to the 5.9% in February. The recent surge in inflation was the product of geopolitical risks pushing fuel and natural gas prices to record high levels. With inflation now more than 3 times above the ECB target level of 2%, the central bank may be pressured to act. However, the fresh economic uncertainty caused by the war in Ukraine has placed the ECB in a tricky position.

Investors will be paying very close attention to ECB President Christine Lagarde’s speech which could offer fresh clues on the ending of the Asset Purchase Programme (APP) and rate hike timeline. If she strikes a hawkish tone, this could support Euro bulls. However, if the ECB disappoints hawks by adopting a cautious stance, expressing concerns over the economy, and offering nothing new on rate hike timelines, the Euro could weaken.

EURUSD poised to break below 1.0850?

Taking a look at the technical picture, the EURUSD remains in a wide range on the daily charts with support at 1.0850 and resistance around 1.1120. With prices trading well below the 200, 100, and 50-day Simple Moving Average, bears remain in a position of power.

Should prices secure a weekly daily close below 1.0850, this could open the doors towards 1.0780 and 1.0700. Alternatively, a move back above 1.1000 could inspire an incline towards 1.1120. Beyond this point, bulls may challenge 1.1230.

Disclaimer: The content in this article comprises personal opinions and should not be construed as containing personal and/or other investment advice and/or an offer of and/or solicitation for any transactions in financial instruments and/or a guarantee and/or prediction of future performance. ForexTime (FXTM), its affiliates, agents, directors, officers or employees do not guarantee the accuracy, validity, timeliness or completeness, of any information or data made available and assume no liability as to any loss arising from any investment based on the same.


Forex-Time-LogoArticle by ForexTime
ForexTime Ltd (FXTM) is an award winning international online forex broker regulated by CySEC 185/12 www.forextime.com