
It was a rough day for European and US equity markets as concerns about rising energy prices and supply shortages left investors on edge.
Ongoing geopolitical tensions and renewed inflation fears also sapped risk appetite, sending the S&P500 tumbling over 1%. In the currency markets, the dollar weakened against most G10 currencies along with the Euro. Oil benchmarks have appreciated over 5% today amid fears that Russia would interrupt energy supplies while gold gained over 1% – currently trading above $1945 as of writing. This has certainly been an eventful week for global markets with things potentially heating up on Thursday as US President Joe Biden attends an emergency Nato summit on Thursday. Whatever the outcome, it may set the tone and mood for the rest of this month.
With explosive levels of volatility on the cards, this could present fresh opportunities across the FX space. Today, we will use pivots points, moving averages and other technical analysis tools to uncover potential setups on various currency pairs.
A pivot point is a technical analysis indicator used to determine the overall trend of the market over different timeframes. Pivot points have predictive qualities, so it is considered a leading indicator to traders. The FXTM pivot point indicator can be downloaded HERE.
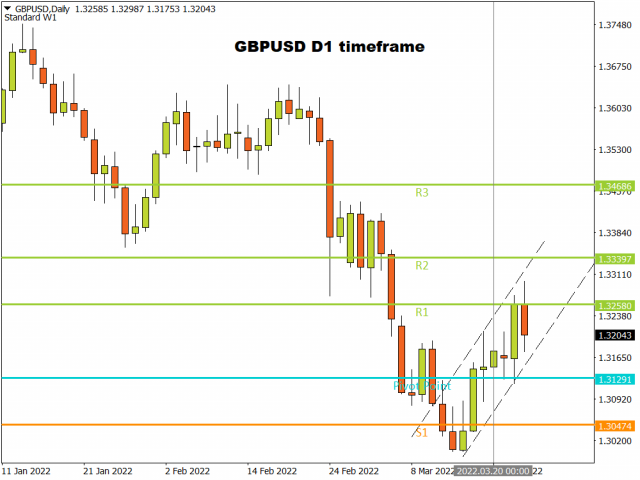
GBPUSD above weekly pivot
Free Reports:
 Get our Weekly Commitment of Traders Reports - See where the biggest traders (Hedge Funds and Commercial Hedgers) are positioned in the futures markets on a weekly basis.
 Sign Up for Our Stock Market Newsletter – Get updated on News, Charts & Rankings of Public Companies when you join our Stocks Newsletter
The GBPUSD has turned bullish on the daily charts. Prices are trading above the weekly pivot level and have already hit the weekly S1 level. A strong daily close above the weekly S1 could encourage an incline towards the weekly S2 based at 1.33397. Should 1.32580 prove to be a tough nut to crack, a decline back to 1.31291 could become reality.
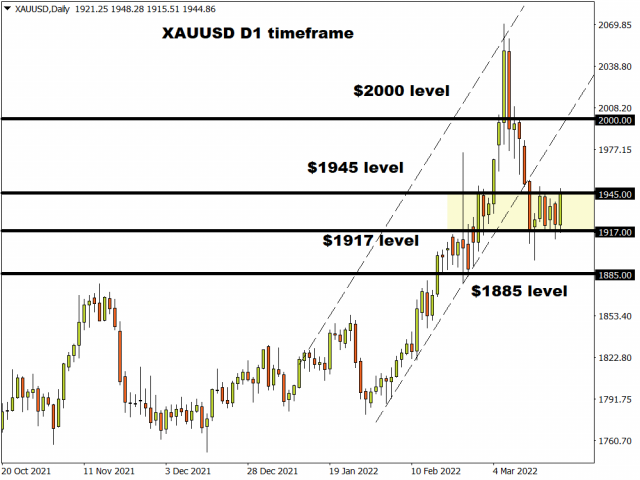
Gold breakout on the horizon
Gold remains trapped within a range with support at $1917 and resistance at $1945. It looks like the precious metal is gearing for a breakout above $1945 with the next key level of interest at $2000. Alternatively, a decline back below $1917 may open the doors towards $1885.
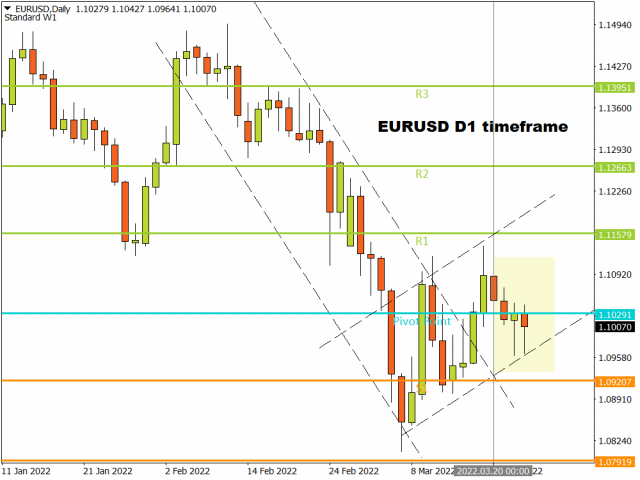
EURUSD choppy on D1 chart
It is shaping up to be a choppy week for the EURUSD. Prices are trading below the weekly pivot level of 1.10291 but there has not been much movement. Sustained weakness below this level could encourage a decline towards 1.09207 which is the weekly S1. Should prices push above the weekly pivot point, the next key level of 1.11579 could be a possibility.
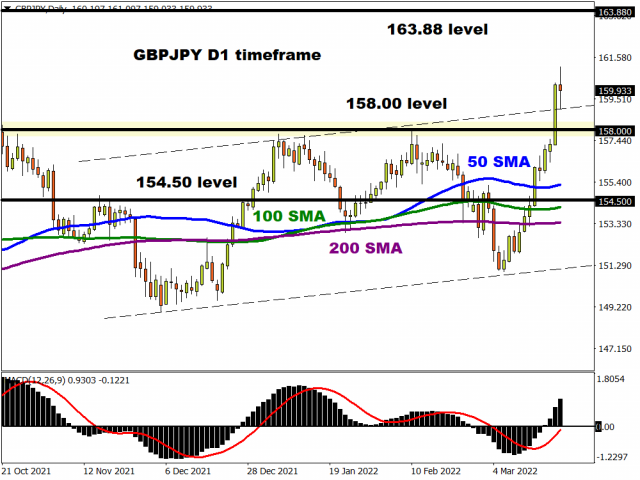
GBPJPY breakout targets 163.88
Bulls are certainly in the building when looking at the GBPJPY. There have been consistently higher highs and higher lows while prices are trading above the 50, 100 and 200 Simple Moving Average. The upside momentum looks healthy with the breakout above 158.00 paving a path towards levels not seen since mid-2016 at 163.88. Should bulls lose control of the steering wheel and prices decline back towards 158.00, this could trigger a deeper selloff to 156.00 and 154.50, respectively.
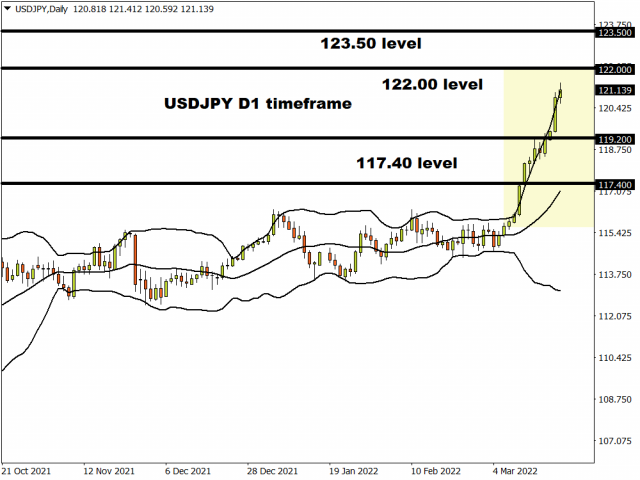
USDJPY hugging outer Bollinger band
A Bollinger Band is a momentum indicator that helps traders define trends and determine if an asset is oversold or overbought.
The USDJPY is heavily bullish on the daily charts with prices hugging the outer Bollinger band. This is a bullish sign and suggests further upside with 122.00 acting as the first level of interest. Prices are either likely to break above this point to target 123.50 or experience a throwback with 119.20 acting as support. Should this level prove to be unreliable support, this could open the doors back towards 117.40.
Disclaimer: The content in this article comprises personal opinions and should not be construed as containing personal and/or other investment advice and/or an offer of and/or solicitation for any transactions in financial instruments and/or a guarantee and/or prediction of future performance. ForexTime (FXTM), its affiliates, agents, directors, officers or employees do not guarantee the accuracy, validity, timeliness or completeness, of any information or data made available and assume no liability as to any loss arising from any investment based on the same.
![]() Article by ForexTime
Article by ForexTime
ForexTime Ltd (FXTM) is an award winning international online forex broker regulated by CySEC 185/12 www.forextime.com

- The US introduces new import tariffs for 60 countries. Brent crude surpasses $100 per barrel Jul 24, 2026
- USD/JPY Breaks Records: Nothing Slows the Yen’s Decline Jul 24, 2026
- Oil prices reached a 6‑week high. The AUD strengthened on the back of a strong labor‑market report Jul 23, 2026
- EUR/USD Recovers as Dollar Weakens Jul 23, 2026
- Bitcoin rose to $66,000. The New Zealand dollar continues to strengthen Jul 22, 2026
- Inflationary pressure is easing in Canada. In New Zealand, on the contrary, inflation is rising Jul 21, 2026
- GBP/USD Falls After Cabinet Changes Jul 21, 2026
- Geopolitical and macroeconomic conditions continue to pressure market sentiment Jul 20, 2026
- USD/JPY Poised to Continue Gains as Expensive Oil and Lack of Support Weigh on Yen Jul 20, 2026
- COT Metals Charts: Weekly Speculator Bets led by Copper & Steel Jul 18, 2026