Archive for Financial News – Page 53

Euro Rallies Against Dollar After Powell’s Cautious Jackson Hole Speech

By RoboForex Analytical Department

The euro strengthened against the US dollar on Friday following a speech by Federal Reserve Chair Jerome Powell at the Jackson Hole Economic Symposium, closing the week on a positive note. While Powell acknowledged the potential for an interest rate cut as soon as September, he refrained from making any explicit commitments.

The EUR/USD pair rose to 1.1728, reaching its highest level since 28 July.

Market expectations for a rate cut at the Fed’s September meeting (16–17) now stand at 85%. For the remainder of the year, market pricing points to a more dovish outlook, with an average of 54 basis points of easing anticipated, up from 48 basis points previously.

Investor attention is now shifting to labour market data. Powell noted that the market is in an unusual balance, with both demand for and supply of workers slowing. The trajectory of employment will be a key determinant for the Fed’s future policy decisions.

An additional factor weighing on the dollar is the growing scrutiny surrounding the Fed’s independence. Last week, US President Donald Trump called for the resignation of Federal Reserve Governor Lisa Cook and suggested she could be dismissed. This has further fuelled concerns about political pressure being exerted on the central bank.

Technical Analysis: EUR/USD

H4 Chart:

On the H4 chart, the market has formed a consolidation range around the 1.1566 level. Following an upward breakout, the corrective wave appears to have completed at the 1.1742 high. The primary focus is now on the potential initiation of a new bearish wave targeting the 1.1550 level. This scenario is technically supported by the MACD indicator, whose signal line remains below zero and is pointing decisively lower.

H1 Chart:

On the H1 chart, the market completed an ascending wave to the 1.1742 level and subsequently formed a consolidation range below it. The price has now broken downwards out of this range. The immediate outlook suggests a high probability of a further decline towards the 1.1664 support level. Following this, a corrective bounce towards 1.1694 is possible. The broader structure is then expected to resume its downward trajectory, targeting 1.1590, with the ultimate bearish objective for the wave structure seen at 1.1550. This view is corroborated by the Stochastic oscillator, whose signal line is currently below the 50 midline and is trending sharply lower towards the 20 level.

Conclusion

While fundamental drivers from the Fed provided a lift, the technical picture suggests the euro’s rally may be limited in the near term.


Disclaimer

Any forecasts contained herein are based on the author’s particular opinion. This analysis may not be treated as trading advice. RoboForex bears no responsibility for trading results based on trading recommendations and reviews contained herein.

COT Metals Charts: Speculator Bets led by Gains in Silver

By InvestMacro

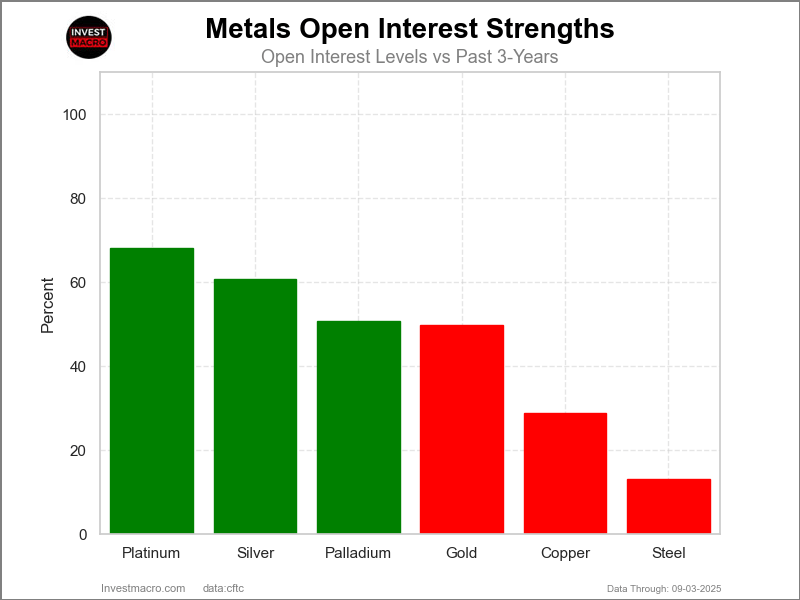
Metals Open Interest COT Chart
Here are the latest charts and statistics for the Commitment of Traders (COT) data published by the Commodities Futures Trading Commission (CFTC).

The latest COT data is updated through Tuesday August 19th and shows a quick view of how large traders (for-profit speculators and commercial entities) were positioned in the futures markets.

Weekly Speculator Changes led by Silver

Metals Net Positions COT Chart
The COT metals markets speculator bets were overall lower this week as just two out of the six metals markets we cover had higher positioning while the other four markets had lower speculator contracts.

Leading the gains for the metals was Silver (2,281 contracts) and with Steel (60 contracts) also showing a positive week.

The markets with declines in speculator bets for the week were Gold (-16,895 contracts), Platinum (-2,738 contracts), Copper (-2,179 contracts) and with Palladium (-238 contracts) also registering lower bets on the week.

Silver leads the Weekly Price Performance for Metals Markets

The major metal markets price changes for the week were led by Silver, which advanced by just about 2.5%. Copper was the next highest mover with a gain of 1.24%, followed by Gold, which was higher by 1%, and Palladium, which increased by 0.76% over the last five days.

Copper saw a small slide of -0.54%, while Steel was the biggest loser on the week with a -4.48% decline.


Metals Data:

Metals Table COT Chart
Legend: Weekly Speculators Change | Speculators Current Net Position | Speculators Strength Score compared to last 3-Years (0-100 range)


Strength Scores led by Palladium & Silver

Metals Strength Scores COT Chart
COT Strength Scores (a normalized measure of Speculator positions over a 3-Year range, from 0 to 100 where above 80 is Extreme-Bullish and below 20 is Extreme-Bearish) showed that Palladium (76 percent) and Silver (74 percent) lead the metals markets this week. Gold (61 percent) comes in as the next highest in the weekly strength scores.

Strength Statistics:
Gold (61.0 percent) vs Gold previous week (67.4 percent)
Silver (74.2 percent) vs Silver previous week (71.4 percent)
Copper (57.5 percent) vs Copper previous week (59.5 percent)
Platinum (51.5 percent) vs Platinum previous week (58.0 percent)
Palladium (76.4 percent) vs Palladium previous week (78.2 percent)
Steel (60.0 percent) vs Palladium previous week (59.6 percent)


Palladium & Gold top the 6-Week Strength Trends

Metals Trends COT Chart
COT Strength Score Trends (or move index, calculates the 6-week changes in strength scores) showed that Palladium (8 percent) and Gold (4 percent) lead the past six weeks trends for metals.

Silver (-15 percent), Platinum (-14 percent) and Copper (-13 percent) lead the downside trend scores currently.

Move Statistics:
Gold (3.7 percent) vs Gold previous week (10.4 percent)
Silver (-15.0 percent) vs Silver previous week (-23.9 percent)
Copper (-12.6 percent) vs Copper previous week (-5.1 percent)
Platinum (-13.5 percent) vs Platinum previous week (-11.5 percent)
Palladium (7.5 percent) vs Palladium previous week (7.4 percent)
Steel (-6.3 percent) vs Steel previous week (-8.3 percent)


Individual Markets:

Gold Comex Futures:

Gold Futures COT ChartThe Gold Comex Futures large speculator standing this week reached a net position of 212,590 contracts in the data reported through Tuesday. This was a weekly lowering of -16,895 contracts from the previous week which had a total of 229,485 net contracts.

This week’s current strength score (the trader positioning range over the past three years, measured from 0 to 100) shows the speculators are currently Bullish with a score of 61.0 percent. The commercials are Bearish with a score of 32.3 percent and the small traders (not shown in chart) are Bullish-Extreme with a score of 99.3 percent.

Price Trend-Following Model: Uptrend

Our weekly trend-following model classifies the current market price position as: Uptrend.

Gold Futures StatisticsSPECULATORSCOMMERCIALSSMALL TRADERS
– Percent of Open Interest Longs:62.815.212.8
– Percent of Open Interest Shorts:14.372.24.3
– Net Position:212,590-249,96537,375
– Gross Longs:275,27766,67056,098
– Gross Shorts:62,687316,63518,723
– Long to Short Ratio:4.4 to 10.2 to 13.0 to 1
NET POSITION TREND:
– Strength Index Score (3 Year Range Pct):61.032.399.3
– Strength Index Reading (3 Year Range):BullishBearishBullish-Extreme
NET POSITION MOVEMENT INDEX:
– 6-Week Change in Strength Index:3.7-4.26.7


Silver Comex Futures:

Silver Futures COT ChartThe Silver Comex Futures large speculator standing this week reached a net position of 46,549 contracts in the data reported through Tuesday. This was a weekly rise of 2,281 contracts from the previous week which had a total of 44,268 net contracts.

This week’s current strength score (the trader positioning range over the past three years, measured from 0 to 100) shows the speculators are currently Bullish with a score of 74.2 percent. The commercials are Bearish with a score of 21.2 percent and the small traders (not shown in chart) are Bullish with a score of 68.1 percent.

Price Trend-Following Model: Uptrend

Our weekly trend-following model classifies the current market price position as: Uptrend.

Silver Futures StatisticsSPECULATORSCOMMERCIALSSMALL TRADERS
– Percent of Open Interest Longs:43.028.519.6
– Percent of Open Interest Shorts:13.670.56.9
– Net Position:46,549-66,67520,126
– Gross Longs:68,10245,12731,016
– Gross Shorts:21,553111,80210,890
– Long to Short Ratio:3.2 to 10.4 to 12.8 to 1
NET POSITION TREND:
– Strength Index Score (3 Year Range Pct):74.221.268.1
– Strength Index Reading (3 Year Range):BullishBearishBullish
NET POSITION MOVEMENT INDEX:
– 6-Week Change in Strength Index:-15.014.2-4.6


Copper Grade #1 Futures:

Copper Futures COT ChartThe Copper Grade #1 Futures large speculator standing this week reached a net position of 26,032 contracts in the data reported through Tuesday. This was a weekly lowering of -2,179 contracts from the previous week which had a total of 28,211 net contracts.

This week’s current strength score (the trader positioning range over the past three years, measured from 0 to 100) shows the speculators are currently Bullish with a score of 57.5 percent. The commercials are Bearish with a score of 40.0 percent and the small traders (not shown in chart) are Bullish with a score of 74.2 percent.

Price Trend-Following Model: Weak Uptrend

Our weekly trend-following model classifies the current market price position as: Weak Uptrend.

Copper Futures StatisticsSPECULATORSCOMMERCIALSSMALL TRADERS
– Percent of Open Interest Longs:29.135.09.7
– Percent of Open Interest Shorts:15.753.24.9
– Net Position:26,032-35,3659,333
– Gross Longs:56,69168,36918,867
– Gross Shorts:30,659103,7349,534
– Long to Short Ratio:1.8 to 10.7 to 12.0 to 1
NET POSITION TREND:
– Strength Index Score (3 Year Range Pct):57.540.074.2
– Strength Index Reading (3 Year Range):BullishBearishBullish
NET POSITION MOVEMENT INDEX:
– 6-Week Change in Strength Index:-12.64.947.4


Platinum Futures:

Platinum Futures COT ChartThe Platinum Futures large speculator standing this week reached a net position of 15,050 contracts in the data reported through Tuesday. This was a weekly decline of -2,738 contracts from the previous week which had a total of 17,788 net contracts.

This week’s current strength score (the trader positioning range over the past three years, measured from 0 to 100) shows the speculators are currently Bullish with a score of 51.5 percent. The commercials are Bearish with a score of 46.6 percent and the small traders (not shown in chart) are Bullish with a score of 63.4 percent.

Price Trend-Following Model: Uptrend

Our weekly trend-following model classifies the current market price position as: Uptrend.

Platinum Futures StatisticsSPECULATORSCOMMERCIALSSMALL TRADERS
– Percent of Open Interest Longs:57.219.811.5
– Percent of Open Interest Shorts:39.743.85.0
– Net Position:15,050-20,6745,624
– Gross Longs:49,26917,0349,912
– Gross Shorts:34,21937,7084,288
– Long to Short Ratio:1.4 to 10.5 to 12.3 to 1
NET POSITION TREND:
– Strength Index Score (3 Year Range Pct):51.546.663.4
– Strength Index Reading (3 Year Range):BullishBearishBullish
NET POSITION MOVEMENT INDEX:
– 6-Week Change in Strength Index:-13.512.70.5


Palladium Futures:

Palladium Futures COT ChartThe Palladium Futures large speculator standing this week reached a net position of -3,734 contracts in the data reported through Tuesday. This was a weekly lowering of -238 contracts from the previous week which had a total of -3,496 net contracts.

This week’s current strength score (the trader positioning range over the past three years, measured from 0 to 100) shows the speculators are currently Bullish with a score of 76.4 percent. The commercials are Bearish-Extreme with a score of 10.0 percent and the small traders (not shown in chart) are Bullish-Extreme with a score of 100.0 percent.

Price Trend-Following Model: Uptrend

Our weekly trend-following model classifies the current market price position as: Uptrend.

Palladium Futures StatisticsSPECULATORSCOMMERCIALSSMALL TRADERS
– Percent of Open Interest Longs:39.232.815.3
– Percent of Open Interest Shorts:57.424.65.3
– Net Position:-3,7341,6792,055
– Gross Longs:8,0406,7193,137
– Gross Shorts:11,7745,0401,082
– Long to Short Ratio:0.7 to 11.3 to 12.9 to 1
NET POSITION TREND:
– Strength Index Score (3 Year Range Pct):76.410.0100.0
– Strength Index Reading (3 Year Range):BullishBearish-ExtremeBullish-Extreme
NET POSITION MOVEMENT INDEX:
– 6-Week Change in Strength Index:7.5-11.519.1


Steel Futures Futures:

Steel Futures COT ChartThe Steel Futures large speculator standing this week reached a net position of -658 contracts in the data reported through Tuesday. This was a weekly increase of 60 contracts from the previous week which had a total of -718 net contracts.

This week’s current strength score (the trader positioning range over the past three years, measured from 0 to 100) shows the speculators are currently Bullish with a score of 60.0 percent. The commercials are Bearish with a score of 40.2 percent and the small traders (not shown in chart) are Bullish with a score of 59.1 percent.

Price Trend-Following Model: Strong Downtrend

Our weekly trend-following model classifies the current market price position as: Strong Downtrend.

Steel Futures StatisticsSPECULATORSCOMMERCIALSSMALL TRADERS
– Percent of Open Interest Longs:18.876.61.9
– Percent of Open Interest Shorts:21.674.61.1
– Net Position:-658478180
– Gross Longs:4,38617,905445
– Gross Shorts:5,04417,427265
– Long to Short Ratio:0.9 to 11.0 to 11.7 to 1
NET POSITION TREND:
– Strength Index Score (3 Year Range Pct):60.040.259.1
– Strength Index Reading (3 Year Range):BullishBearishBullish
NET POSITION MOVEMENT INDEX:
– 6-Week Change in Strength Index:-6.37.0-13.3


Article By InvestMacroReceive our weekly COT Newsletter

*COT Report: The COT data, released weekly to the public each Friday, is updated through the most recent Tuesday (data is 3 days old) and shows a quick view of how large speculators or non-commercials (for-profit traders) were positioned in the futures markets.

The CFTC categorizes trader positions according to commercial hedgers (traders who use futures contracts for hedging as part of the business), non-commercials (large traders who speculate to realize trading profits) and nonreportable traders (usually small traders/speculators) as well as their open interest (contracts open in the market at time of reporting). See CFTC criteria here.

COT Bonds Charts: Speculator Bets led by gains in 5-Year Bond & 2-Year Bonds

By InvestMacro

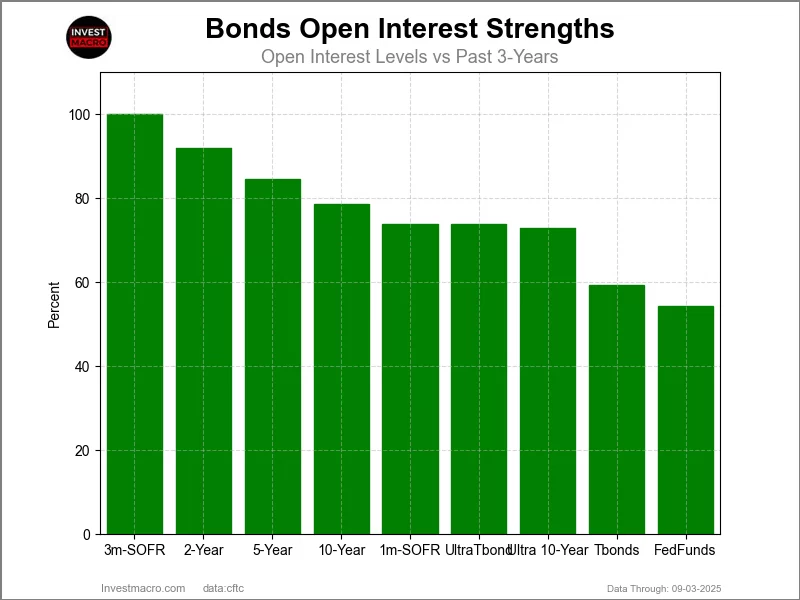
Bonds Market Open Interest Comparison
Here are the latest charts and statistics for the Commitment of Traders (COT) reports data published by the Commodities Futures Trading Commission (CFTC).

The latest COT data is updated through Tuesday August 19th and shows a quick view of how large traders (for-profit speculators and commercial hedgers) were positioned in the futures markets.

Weekly Speculator Changes led by 5-Year Bonds & 2-Year Bonds

Bonds Market Net Speculators Positions
The COT bond market speculator bets were slightly higher this week as five out of the nine bond markets we cover had higher positioning while the other four markets had lower speculator contracts.

Leading the gains for the bond markets was the 5-Year Bonds (57,986 contracts) with the 2-Year Bonds (55,058 contracts), the Ultra 10-Year Bonds (21,171 contracts), the SOFR 1-Month (15,722 contracts) and the US Treasury Bonds (9,751 contracts) also showing positive weeks.

The bond markets with declines in speculator bets for the week were the SOFR 3-Months (-85,699 contracts), the Fed Funds (-83,387 contracts), the Ultra Treasury Bonds (-33,030 contracts) and the 10-Year Bonds (-3,293 contracts) also registering lower bets on the week.

Weekly Price Changes led by US Treasury Bonds

The weekly price performance for the major U.S. bond markets showed slight increases across the board for the most part. The long U.S. Treasury bonds led the last 5 days price changes with a gain of 0.75% followed by the 10-Year Notes which rose by 0.57%. The 5-Year Bond was up by 0.40% while the 2-Year Bond was slightly higher by just 0.22%. The 3-Month Secured Overnight Financing Rate was up by 0.14% while the 1-Month Secured Overnight Financing Rate and the Fed Funds were virtually unchanged as well.


Bonds Data:

Bonds Market Speculators Data Table
Legend: Open Interest | Speculators Current Net Position | Weekly Specs Change | Specs Strength Score compared to last 3-Years (0-100 range)


Strength Scores led by Ultra Treasury Bonds & US Treasury Bonds

Bonds Market Strength Index Comparison
COT Strength Scores (a normalized measure of Speculator positions over a 3-Year range, from 0 to 100 where above 80 is Extreme-Bullish and below 20 is Extreme-Bearish) showed that the Ultra Treasury Bonds (80 percent) and the US Treasury Bonds (66 percent) lead the bond markets this week. The SOFR 1-Month (65 percent) comes in as the next highest in the weekly strength scores.

On the downside, the Fed Funds (0 percent), the 5-Year Bonds (3 percent), the 2-Year Bonds (13 percent) and the Ultra 10-Year Bonds (17 percent) come in at the lowest strength level currently and are in Extreme-Bearish territory (below 20 percent).

Strength Statistics:
Fed Funds (0.0 percent) vs Fed Funds previous week (14.8 percent)
2-Year Bond (13.4 percent) vs 2-Year Bond previous week (8.9 percent)
5-Year Bond (2.7 percent) vs 5-Year Bond previous week (0.0 percent)
10-Year Bond (21.7 percent) vs 10-Year Bond previous week (22.1 percent)
Ultra 10-Year Bond (17.2 percent) vs Ultra 10-Year Bond previous week (11.9 percent)
US Treasury Bond (65.6 percent) vs US Treasury Bond previous week (62.2 percent)
Ultra US Treasury Bond (80.3 percent) vs Ultra US Treasury Bond previous week (92.7 percent)
SOFR 1-Month (65.3 percent) vs SOFR 1-Month previous week (61.4 percent)
SOFR 3-Months (41.3 percent) vs SOFR 3-Months previous week (45.7 percent)


SOFR 1-Month & US Treasury Bonds top the 6-Week Strength Trends

Bonds Market Trend Index Comparison
COT Strength Score Trends (or move index, calculates the 6-week changes in strength scores) showed that the SOFR 1-Month (33 percent) and the US Treasury Bonds (20 percent) lead the past six weeks trends for bonds. The Ultra 10-Year Bonds (17 percent) are the next highest positive movers in the latest trends data.

The Fed Funds (-62 percent) leads the downside trend scores currently with the 10-Year Bonds (-11 percent) following next with lower trend scores.

Strength Trend Statistics:
Fed Funds (-62.4 percent) vs Fed Funds previous week (-43.2 percent)
2-Year Bond (-4.8 percent) vs 2-Year Bond previous week (-8.2 percent)
5-Year Bond (0.4 percent) vs 5-Year Bond previous week (-4.2 percent)
10-Year Bond (-11.5 percent) vs 10-Year Bond previous week (-17.3 percent)
Ultra 10-Year Bond (17.2 percent) vs Ultra 10-Year Bond previous week (8.4 percent)
US Treasury Bond (20.1 percent) vs US Treasury Bond previous week (15.2 percent)
Ultra US Treasury Bond (-7.3 percent) vs Ultra US Treasury Bond previous week (6.7 percent)
SOFR 1-Month (33.3 percent) vs SOFR 1-Month previous week (26.1 percent)
SOFR 3-Months (14.2 percent) vs SOFR 3-Months previous week (20.7 percent)


30-Day Federal Funds Futures:

Federal Funds 30-Day Bonds Futures COT ChartThe 30-Day Federal Funds large speculator standing this week was a net position of -317,054 contracts in the data reported through Tuesday. This was a weekly decrease of -83,387 contracts from the previous week which had a total of -233,667 net contracts.

This week’s current strength score (the trader positioning range over the past three years, measured from 0 to 100) shows the speculators are currently Bearish-Extreme with a score of 0.0 percent. The commercials are Bullish-Extreme with a score of 100.0 percent and the small traders (not shown in chart) are Bullish with a score of 58.0 percent.

Price Trend-Following Model: Downtrend

Our weekly trend-following model classifies the current market price position as: Downtrend.

30-Day Federal Funds StatisticsSPECULATORSCOMMERCIALSSMALL TRADERS
– Percent of Open Interest Longs:10.571.02.2
– Percent of Open Interest Shorts:24.057.32.3
– Net Position:-317,054319,912-2,858
– Gross Longs:244,3101,659,27951,339
– Gross Shorts:561,3641,339,36754,197
– Long to Short Ratio:0.4 to 11.2 to 10.9 to 1
NET POSITION TREND:
– Strength Index Score (3 Year Range Pct):0.0100.058.0
– Strength Index Reading (3 Year Range):Bearish-ExtremeBullish-ExtremeBullish
NET POSITION MOVEMENT INDEX:
– 6-Week Change in Strength Index:-62.465.2-10.7


Secured Overnight Financing Rate (3-Month) Futures:

SOFR 3-Months Bonds Futures COT ChartThe Secured Overnight Financing Rate (3-Month) large speculator standing this week was a net position of -368,146 contracts in the data reported through Tuesday. This was a weekly fall of -85,699 contracts from the previous week which had a total of -282,447 net contracts.

This week’s current strength score (the trader positioning range over the past three years, measured from 0 to 100) shows the speculators are currently Bearish with a score of 41.3 percent. The commercials are Bullish with a score of 58.1 percent and the small traders (not shown in chart) are Bullish-Extreme with a score of 83.0 percent.

Price Trend-Following Model: Weak Uptrend

Our weekly trend-following model classifies the current market price position as: Weak Uptrend.

SOFR 3-Months StatisticsSPECULATORSCOMMERCIALSSMALL TRADERS
– Percent of Open Interest Longs:14.356.70.5
– Percent of Open Interest Shorts:17.353.80.5
– Net Position:-368,146358,3459,801
– Gross Longs:1,768,2797,024,13466,827
– Gross Shorts:2,136,4256,665,78957,026
– Long to Short Ratio:0.8 to 11.1 to 11.2 to 1
NET POSITION TREND:
– Strength Index Score (3 Year Range Pct):41.358.183.0
– Strength Index Reading (3 Year Range):BearishBullishBullish-Extreme
NET POSITION MOVEMENT INDEX:
– 6-Week Change in Strength Index:14.2-12.7-14.5


Individual Bond Markets:

Secured Overnight Financing Rate (1-Month) Futures:

SOFR 1-Month Bonds Futures COT ChartThe Secured Overnight Financing Rate (1-Month) large speculator standing this week was a net position of -12,930 contracts in the data reported through Tuesday. This was a weekly lift of 15,722 contracts from the previous week which had a total of -28,652 net contracts.

This week’s current strength score (the trader positioning range over the past three years, measured from 0 to 100) shows the speculators are currently Bullish with a score of 65.3 percent. The commercials are Bearish with a score of 33.7 percent and the small traders (not shown in chart) are Bullish with a score of 75.9 percent.

Price Trend-Following Model: Weak Uptrend

Our weekly trend-following model classifies the current market price position as: Weak Uptrend.

SOFR 1-Month StatisticsSPECULATORSCOMMERCIALSSMALL TRADERS
– Percent of Open Interest Longs:15.866.70.3
– Percent of Open Interest Shorts:16.766.10.0
– Net Position:-12,9308,5804,350
– Gross Longs:229,471969,5174,631
– Gross Shorts:242,401960,937281
– Long to Short Ratio:0.9 to 11.0 to 116.5 to 1
NET POSITION TREND:
– Strength Index Score (3 Year Range Pct):65.333.775.9
– Strength Index Reading (3 Year Range):BullishBearishBullish
NET POSITION MOVEMENT INDEX:
– 6-Week Change in Strength Index:33.3-33.31.2


2-Year Treasury Note Futures:

2-Year Treasury Bonds Futures COT ChartThe 2-Year Treasury Note large speculator standing this week was a net position of -1,324,539 contracts in the data reported through Tuesday. This was a weekly advance of 55,058 contracts from the previous week which had a total of -1,379,597 net contracts.

This week’s current strength score (the trader positioning range over the past three years, measured from 0 to 100) shows the speculators are currently Bearish-Extreme with a score of 13.4 percent. The commercials are Bullish-Extreme with a score of 86.6 percent and the small traders (not shown in chart) are Bullish with a score of 67.9 percent.

Price Trend-Following Model: Strong Uptrend

Our weekly trend-following model classifies the current market price position as: Strong Uptrend.

2-Year Treasury Note StatisticsSPECULATORSCOMMERCIALSSMALL TRADERS
– Percent of Open Interest Longs:11.379.15.7
– Percent of Open Interest Shorts:40.652.53.0
– Net Position:-1,324,5391,202,916121,623
– Gross Longs:512,2673,582,207258,933
– Gross Shorts:1,836,8062,379,291137,310
– Long to Short Ratio:0.3 to 11.5 to 11.9 to 1
NET POSITION TREND:
– Strength Index Score (3 Year Range Pct):13.486.667.9
– Strength Index Reading (3 Year Range):Bearish-ExtremeBullish-ExtremeBullish
NET POSITION MOVEMENT INDEX:
– 6-Week Change in Strength Index:-4.88.4-7.3


5-Year Treasury Note Futures:

5-Year Treasury Bonds Futures COT ChartThe 5-Year Treasury Note large speculator standing this week was a net position of -2,508,383 contracts in the data reported through Tuesday. This was a weekly gain of 57,986 contracts from the previous week which had a total of -2,566,369 net contracts.

This week’s current strength score (the trader positioning range over the past three years, measured from 0 to 100) shows the speculators are currently Bearish-Extreme with a score of 2.7 percent. The commercials are Bullish-Extreme with a score of 97.7 percent and the small traders (not shown in chart) are Bullish-Extreme with a score of 86.9 percent.

Price Trend-Following Model: Strong Uptrend

Our weekly trend-following model classifies the current market price position as: Strong Uptrend.

5-Year Treasury Note StatisticsSPECULATORSCOMMERCIALSSMALL TRADERS
– Percent of Open Interest Longs:7.382.96.4
– Percent of Open Interest Shorts:41.551.43.7
– Net Position:-2,508,3832,310,706197,677
– Gross Longs:539,0756,090,238471,602
– Gross Shorts:3,047,4583,779,532273,925
– Long to Short Ratio:0.2 to 11.6 to 11.7 to 1
NET POSITION TREND:
– Strength Index Score (3 Year Range Pct):2.797.786.9
– Strength Index Reading (3 Year Range):Bearish-ExtremeBullish-ExtremeBullish-Extreme
NET POSITION MOVEMENT INDEX:
– 6-Week Change in Strength Index:0.4-1.64.9


10-Year Treasury Note Futures:

10-Year Treasury Notes Bonds Futures COT ChartThe 10-Year Treasury Note large speculator standing this week was a net position of -945,516 contracts in the data reported through Tuesday. This was a weekly decline of -3,293 contracts from the previous week which had a total of -942,223 net contracts.

This week’s current strength score (the trader positioning range over the past three years, measured from 0 to 100) shows the speculators are currently Bearish with a score of 21.7 percent. The commercials are Bullish with a score of 76.9 percent and the small traders (not shown in chart) are Bullish with a score of 80.0 percent.

Price Trend-Following Model: Strong Uptrend

Our weekly trend-following model classifies the current market price position as: Strong Uptrend.

10-Year Treasury Note StatisticsSPECULATORSCOMMERCIALSSMALL TRADERS
– Percent of Open Interest Longs:9.877.98.5
– Percent of Open Interest Shorts:27.562.46.3
– Net Position:-945,516826,011119,505
– Gross Longs:523,3084,158,543453,913
– Gross Shorts:1,468,8243,332,532334,408
– Long to Short Ratio:0.4 to 11.2 to 11.4 to 1
NET POSITION TREND:
– Strength Index Score (3 Year Range Pct):21.776.980.0
– Strength Index Reading (3 Year Range):BearishBullishBullish
NET POSITION MOVEMENT INDEX:
– 6-Week Change in Strength Index:-11.513.04.2


Ultra 10-Year Notes Futures:

Ultra 10-Year Treasury Notes Bonds Futures COT ChartThe Ultra 10-Year Notes large speculator standing this week was a net position of -339,150 contracts in the data reported through Tuesday. This was a weekly boost of 21,171 contracts from the previous week which had a total of -360,321 net contracts.

This week’s current strength score (the trader positioning range over the past three years, measured from 0 to 100) shows the speculators are currently Bearish-Extreme with a score of 17.2 percent. The commercials are Bullish with a score of 77.3 percent and the small traders (not shown in chart) are Bullish with a score of 67.7 percent.

Price Trend-Following Model: Weak Uptrend

Our weekly trend-following model classifies the current market price position as: Weak Uptrend.

Ultra 10-Year Notes StatisticsSPECULATORSCOMMERCIALSSMALL TRADERS
– Percent of Open Interest Longs:12.477.19.4
– Percent of Open Interest Shorts:26.061.611.2
– Net Position:-339,150385,087-45,937
– Gross Longs:308,6071,919,822234,113
– Gross Shorts:647,7571,534,735280,050
– Long to Short Ratio:0.5 to 11.3 to 10.8 to 1
NET POSITION TREND:
– Strength Index Score (3 Year Range Pct):17.277.367.7
– Strength Index Reading (3 Year Range):Bearish-ExtremeBullishBullish
NET POSITION MOVEMENT INDEX:
– 6-Week Change in Strength Index:17.2-22.713.7


US Treasury Bonds Futures:

US Year Treasury Notes Long Bonds Futures COT ChartThe US Treasury Bonds large speculator standing this week was a net position of -51,043 contracts in the data reported through Tuesday. This was a weekly rise of 9,751 contracts from the previous week which had a total of -60,794 net contracts.

This week’s current strength score (the trader positioning range over the past three years, measured from 0 to 100) shows the speculators are currently Bullish with a score of 65.6 percent. The commercials are Bearish with a score of 20.8 percent and the small traders (not shown in chart) are Bullish-Extreme with a score of 95.3 percent.

Price Trend-Following Model: Weak Downtrend

Our weekly trend-following model classifies the current market price position as: Weak Downtrend.

US Treasury Bonds StatisticsSPECULATORSCOMMERCIALSSMALL TRADERS
– Percent of Open Interest Longs:8.075.613.2
– Percent of Open Interest Shorts:10.879.16.9
– Net Position:-51,043-62,680113,723
– Gross Longs:144,9761,367,940239,442
– Gross Shorts:196,0191,430,620125,719
– Long to Short Ratio:0.7 to 11.0 to 11.9 to 1
NET POSITION TREND:
– Strength Index Score (3 Year Range Pct):65.620.895.3
– Strength Index Reading (3 Year Range):BullishBearishBullish-Extreme
NET POSITION MOVEMENT INDEX:
– 6-Week Change in Strength Index:20.1-27.234.8


Ultra US Treasury Bonds Futures:

Ultra US Year Treasury Notes Long Bonds Futures COT ChartThe Ultra US Treasury Bonds large speculator standing this week was a net position of -242,162 contracts in the data reported through Tuesday. This was a weekly lowering of -33,030 contracts from the previous week which had a total of -209,132 net contracts.

This week’s current strength score (the trader positioning range over the past three years, measured from 0 to 100) shows the speculators are currently Bullish-Extreme with a score of 80.3 percent. The commercials are Bearish with a score of 30.4 percent and the small traders (not shown in chart) are Bearish with a score of 27.2 percent.

Price Trend-Following Model: Weak Downtrend

Our weekly trend-following model classifies the current market price position as: Weak Downtrend.

Ultra US Treasury Bonds StatisticsSPECULATORSCOMMERCIALSSMALL TRADERS
– Percent of Open Interest Longs:6.481.49.3
– Percent of Open Interest Shorts:18.470.08.8
– Net Position:-242,162230,41511,747
– Gross Longs:129,4181,647,663188,953
– Gross Shorts:371,5801,417,248177,206
– Long to Short Ratio:0.3 to 11.2 to 11.1 to 1
NET POSITION TREND:
– Strength Index Score (3 Year Range Pct):80.330.427.2
– Strength Index Reading (3 Year Range):Bullish-ExtremeBearishBearish
NET POSITION MOVEMENT INDEX:
– 6-Week Change in Strength Index:-7.3-2.727.1


Article By InvestMacroReceive our weekly COT Newsletter

*COT Report: The COT data, released weekly to the public each Friday, is updated through the most recent Tuesday (data is 3 days old) and shows a quick view of how large speculators or non-commercials (for-profit traders) were positioned in the futures markets.

The CFTC categorizes trader positions according to commercial hedgers (traders who use futures contracts for hedging as part of the business), non-commercials (large traders who speculate to realize trading profits) and nonreportable traders (usually small traders/speculators) as well as their open interest (contracts open in the market at time of reporting). See CFTC criteria here.

COT Soft Commodities Charts: Weekly Speculator Bet Changes led by Soybeans & Corn

By InvestMacro

Speculators OI Softs
Here are the latest charts and statistics for the Commitment of Traders (COT) reports data published by the Commodities Futures Trading Commission (CFTC).

The latest COT data is updated through Tuesday August 19th and shows a quick view of how large traders (for-profit speculators and commercial entities) were positioned in the futures markets.

Weekly Speculator Bets led by Soybeans & Corn

Speculators Nets Softs
The COT soft commodities markets speculator bets were mixed this week as five out of the eleven softs markets we cover had higher positioning while five markets had lower speculator contracts and one market had no change.

Leading the gains for the softs markets was Soybeans (35,321 contracts) with Corn (27,964 contracts), Soybean Meal (10,184 contracts), Cotton (3,334 contracts) and Coffee (2,458 contracts) also showing positive weeks.

The markets with the declines in speculator bets this week were Soybean Oil (-15,862 contracts), Wheat (-4,572 contracts), Lean Hogs (-4,218 contracts), Sugar (-1,781 contracts) and with Cocoa (-1,720 contracts) also registering lower bets on the week.

Live Cattle (0 contracts) showed not change on the week which is extremely rare and could likely be revised going forward.

Coffee leads price changes followed by Cocoa

Price changes for the soft commodities markets over the last five days saw just about all of them higher on the week. Coffee led with a huge weekly gain of 14.49%, followed by Cocoa which rose by over 11%. Soybean Meal was up by almost 6% on the week, Live Cattle rose by over 4%, followed by Soybean Oil which was up by 3%, and Lean Hogs which rose by over 2%.

Cotton and Corn also were higher by just over a percent, while Soybeans increased by 1%. Wheat prices were unchanged for the week, while Sugar was the only market that saw a decline with a -0.45% reduction.


Soft Commodities Data:

Speculators Table Softs
Legend: Weekly Speculators Change | Speculators Current Net Position | Speculators Strength Score compared to last 3-Years (0-100 range)


Strength Scores led by Live Cattle & Lean Hogs

Speculators Strength Softs
COT Strength Scores (a normalized measure of Speculator positions over a 3-Year range, from 0 to 100 where above 80 is Extreme-Bullish and below 20 is Extreme-Bearish) showed that Live Cattle (83 percent) and Lean Hogs (80 percent) lead the softs markets this week. Soybean Oil (70 percent), Soybeans (56 percent) and Coffee (54 percent) come in as the next highest in the weekly strength scores.

On the downside, Sugar (2 percent), Soybean Meal (15 percent), Cotton (16 percent) and the Wheat (19.8 percent) come in at the lowest strength levels currently and are in Extreme-Bearish territory (below 20 percent).

Strength Statistics:
Corn (21.9 percent) vs Corn previous week (18.1 percent)
Sugar (1.9 percent) vs Sugar previous week (2.4 percent)
Coffee (53.7 percent) vs Coffee previous week (51.3 percent)
Soybeans (55.6 percent) vs Soybeans previous week (46.5 percent)
Soybean Oil (69.6 percent) vs Soybean Oil previous week (78.3 percent)
Soybean Meal (14.7 percent) vs Soybean Meal previous week (10.8 percent)
Live Cattle (82.6 percent) vs Live Cattle previous week (82.6 percent)
Lean Hogs (79.9 percent) vs Lean Hogs previous week (83.1 percent)
Cotton (16.4 percent) vs Cotton previous week (14.4 percent)
Cocoa (22.2 percent) vs Cocoa previous week (24.0 percent)
Wheat (19.8 percent) vs Wheat previous week (23.5 percent)


Soybean Meal & Corn top the 6-Week Strength Trends

Speculators Trend Softs
COT Strength Score Trends (or move index, calculates the 6-week changes in strength scores) showed that Soybean Meal (14 percent) and Corn (5 percent) lead the past six weeks trends for soft commodities. Live Cattle (5 percent) are the next highest positive movers in the latest trends data.

Wheat (-26 percent) leads the downside trend scores currently with Lean Hogs (-16 percent), Soybean Oil (-5 percent) and Soybeans (-5 percent) following next with lower trend scores.

Strength Trend Statistics:
Corn (5.0 percent) vs Corn previous week (3.0 percent)
Sugar (-2.8 percent) vs Sugar previous week (-0.4 percent)
Coffee (-0.3 percent) vs Coffee previous week (-2.7 percent)
Soybeans (-4.7 percent) vs Soybeans previous week (-14.6 percent)
Soybean Oil (-4.9 percent) vs Soybean Oil previous week (4.6 percent)
Soybean Meal (14.2 percent) vs Soybean Meal previous week (10.8 percent)
Live Cattle (4.8 percent) vs Live Cattle previous week (2.0 percent)
Lean Hogs (-16.0 percent) vs Lean Hogs previous week (-15.7 percent)
Cotton (-3.3 percent) vs Cotton previous week (-6.5 percent)
Cocoa (-0.6 percent) vs Cocoa previous week (0.2 percent)
Wheat (-25.7 percent) vs Wheat previous week (-15.7 percent)


Individual Soft Commodities Markets:

CORN Futures:

CORN Futures COT ChartThe CORN large speculator standing this week totaled a net position of -105,210 contracts in the data reported through Tuesday. This was a weekly gain of 27,964 contracts from the previous week which had a total of -133,174 net contracts.

This week’s current strength score (the trader positioning range over the past three years, measured from 0 to 100) shows the speculators are currently Bearish with a score of 21.9 percent. The commercials are Bullish with a score of 76.0 percent and the small traders (not shown in chart) are Bullish-Extreme with a score of 84.8 percent.

Price Trend-Following Model: Downtrend

Our weekly trend-following model classifies the current market price position as: Downtrend.

CORN Futures StatisticsSPECULATORSCOMMERCIALSSMALL TRADERS
– Percent of Open Interest Longs:21.445.69.0
– Percent of Open Interest Shorts:28.137.710.2
– Net Position:-105,210123,955-18,745
– Gross Longs:334,720714,119141,542
– Gross Shorts:439,930590,164160,287
– Long to Short Ratio:0.8 to 11.2 to 10.9 to 1
NET POSITION TREND:
– Strength Index Score (3 Year Range Pct):21.976.084.8
– Strength Index Reading (3 Year Range):BearishBullishBullish-Extreme
NET POSITION MOVEMENT INDEX:
– 6-Week Change in Strength Index:5.0-6.36.0


SUGAR Futures:

SUGAR Futures COT ChartThe SUGAR large speculator standing this week totaled a net position of -70,293 contracts in the data reported through Tuesday. This was a weekly lowering of -1,781 contracts from the previous week which had a total of -68,512 net contracts.

This week’s current strength score (the trader positioning range over the past three years, measured from 0 to 100) shows the speculators are currently Bearish-Extreme with a score of 1.9 percent. The commercials are Bullish-Extreme with a score of 96.0 percent and the small traders (not shown in chart) are Bearish-Extreme with a score of 17.8 percent.

Price Trend-Following Model: Downtrend

Our weekly trend-following model classifies the current market price position as: Downtrend.

SUGAR Futures StatisticsSPECULATORSCOMMERCIALSSMALL TRADERS
– Percent of Open Interest Longs:21.453.57.7
– Percent of Open Interest Shorts:29.245.58.0
– Net Position:-70,29372,429-2,136
– Gross Longs:193,091482,31769,614
– Gross Shorts:263,384409,88871,750
– Long to Short Ratio:0.7 to 11.2 to 11.0 to 1
NET POSITION TREND:
– Strength Index Score (3 Year Range Pct):1.996.017.8
– Strength Index Reading (3 Year Range):Bearish-ExtremeBullish-ExtremeBearish-Extreme
NET POSITION MOVEMENT INDEX:
– 6-Week Change in Strength Index:-2.8-0.516.3


COFFEE Futures:

COFFEE Futures COT ChartThe COFFEE large speculator standing this week totaled a net position of 28,660 contracts in the data reported through Tuesday. This was a weekly gain of 2,458 contracts from the previous week which had a total of 26,202 net contracts.

This week’s current strength score (the trader positioning range over the past three years, measured from 0 to 100) shows the speculators are currently Bullish with a score of 53.7 percent. The commercials are Bearish with a score of 48.0 percent and the small traders (not shown in chart) are Bearish with a score of 46.5 percent.

Price Trend-Following Model: Weak Downtrend

Our weekly trend-following model classifies the current market price position as: Weak Downtrend.

COFFEE Futures StatisticsSPECULATORSCOMMERCIALSSMALL TRADERS
– Percent of Open Interest Longs:32.140.55.0
– Percent of Open Interest Shorts:13.360.43.9
– Net Position:28,660-30,3561,696
– Gross Longs:48,95261,6587,632
– Gross Shorts:20,29292,0145,936
– Long to Short Ratio:2.4 to 10.7 to 11.3 to 1
NET POSITION TREND:
– Strength Index Score (3 Year Range Pct):53.748.046.5
– Strength Index Reading (3 Year Range):BullishBearishBearish
NET POSITION MOVEMENT INDEX:
– 6-Week Change in Strength Index:-0.3-0.412.4


SOYBEANS Futures:

SOYBEANS Futures COT ChartThe SOYBEANS large speculator standing this week totaled a net position of 19,746 contracts in the data reported through Tuesday. This was a weekly rise of 35,321 contracts from the previous week which had a total of -15,575 net contracts.

This week’s current strength score (the trader positioning range over the past three years, measured from 0 to 100) shows the speculators are currently Bullish with a score of 55.6 percent. The commercials are Bearish with a score of 42.9 percent and the small traders (not shown in chart) are Bullish with a score of 71.9 percent.

Price Trend-Following Model: Strong Uptrend

Our weekly trend-following model classifies the current market price position as: Strong Uptrend.

SOYBEANS Futures StatisticsSPECULATORSCOMMERCIALSSMALL TRADERS
– Percent of Open Interest Longs:17.453.85.5
– Percent of Open Interest Shorts:15.254.37.3
– Net Position:19,746-4,205-15,541
– Gross Longs:155,697481,03349,550
– Gross Shorts:135,951485,23865,091
– Long to Short Ratio:1.1 to 11.0 to 10.8 to 1
NET POSITION TREND:
– Strength Index Score (3 Year Range Pct):55.642.971.9
– Strength Index Reading (3 Year Range):BullishBearishBullish
NET POSITION MOVEMENT INDEX:
– 6-Week Change in Strength Index:-4.74.90.4


SOYBEAN OIL Futures:

SOYBEAN OIL Futures COT ChartThe SOYBEAN OIL large speculator standing this week totaled a net position of 50,207 contracts in the data reported through Tuesday. This was a weekly fall of -15,862 contracts from the previous week which had a total of 66,069 net contracts.

This week’s current strength score (the trader positioning range over the past three years, measured from 0 to 100) shows the speculators are currently Bullish with a score of 69.6 percent. The commercials are Bearish with a score of 31.3 percent and the small traders (not shown in chart) are Bullish with a score of 64.6 percent.

Price Trend-Following Model: Uptrend

Our weekly trend-following model classifies the current market price position as: Uptrend.

SOYBEAN OIL Futures StatisticsSPECULATORSCOMMERCIALSSMALL TRADERS
– Percent of Open Interest Longs:23.043.95.9
– Percent of Open Interest Shorts:14.853.64.4
– Net Position:50,207-59,5239,316
– Gross Longs:141,004268,81236,141
– Gross Shorts:90,797328,33526,825
– Long to Short Ratio:1.6 to 10.8 to 11.3 to 1
NET POSITION TREND:
– Strength Index Score (3 Year Range Pct):69.631.364.6
– Strength Index Reading (3 Year Range):BullishBearishBullish
NET POSITION MOVEMENT INDEX:
– 6-Week Change in Strength Index:-4.94.7-1.4


SOYBEAN MEAL Futures:

SOYBEAN MEAL Futures COT ChartThe SOYBEAN MEAL large speculator standing this week totaled a net position of -48,128 contracts in the data reported through Tuesday. This was a weekly lift of 10,184 contracts from the previous week which had a total of -58,312 net contracts.

This week’s current strength score (the trader positioning range over the past three years, measured from 0 to 100) shows the speculators are currently Bearish-Extreme with a score of 14.7 percent. The commercials are Bullish-Extreme with a score of 87.3 percent and the small traders (not shown in chart) are Bearish with a score of 38.9 percent.

Price Trend-Following Model: Weak Downtrend

Our weekly trend-following model classifies the current market price position as: Weak Downtrend.

SOYBEAN MEAL Futures StatisticsSPECULATORSCOMMERCIALSSMALL TRADERS
– Percent of Open Interest Longs:17.750.07.8
– Percent of Open Interest Shorts:25.145.25.2
– Net Position:-48,12831,20616,922
– Gross Longs:115,221326,01750,621
– Gross Shorts:163,349294,81133,699
– Long to Short Ratio:0.7 to 11.1 to 11.5 to 1
NET POSITION TREND:
– Strength Index Score (3 Year Range Pct):14.787.338.9
– Strength Index Reading (3 Year Range):Bearish-ExtremeBullish-ExtremeBearish
NET POSITION MOVEMENT INDEX:
– 6-Week Change in Strength Index:14.2-12.0-35.0


LIVE CATTLE Futures:

LIVE CATTLE Futures COT ChartThe LIVE CATTLE large speculator standing this week totaled a net position of 106,141 contracts in the data reported through Tuesday. This was a weekly fall of 0 contracts from the previous week which had a total of 106,141 net contracts.

This week’s current strength score (the trader positioning range over the past three years, measured from 0 to 100) shows the speculators are currently Bullish-Extreme with a score of 82.6 percent. The commercials are Bearish-Extreme with a score of 19.3 percent and the small traders (not shown in chart) are Bearish with a score of 21.3 percent.

Price Trend-Following Model: Strong Uptrend

Our weekly trend-following model classifies the current market price position as: Strong Uptrend.

LIVE CATTLE Futures StatisticsSPECULATORSCOMMERCIALSSMALL TRADERS
– Percent of Open Interest Longs:48.328.77.4
– Percent of Open Interest Shorts:20.850.613.0
– Net Position:106,141-84,582-21,559
– Gross Longs:186,130110,31828,487
– Gross Shorts:79,989194,90050,046
– Long to Short Ratio:2.3 to 10.6 to 10.6 to 1
NET POSITION TREND:
– Strength Index Score (3 Year Range Pct):82.619.321.3
– Strength Index Reading (3 Year Range):Bullish-ExtremeBearish-ExtremeBearish
NET POSITION MOVEMENT INDEX:
– 6-Week Change in Strength Index:4.8-6.92.8


LEAN HOGS Futures:

LEAN HOGS Futures COT ChartThe LEAN HOGS large speculator standing this week totaled a net position of 69,709 contracts in the data reported through Tuesday. This was a weekly reduction of -4,218 contracts from the previous week which had a total of 73,927 net contracts.

This week’s current strength score (the trader positioning range over the past three years, measured from 0 to 100) shows the speculators are currently Bullish with a score of 79.9 percent. The commercials are Bearish with a score of 20.3 percent and the small traders (not shown in chart) are Bearish with a score of 43.9 percent.

Price Trend-Following Model: Uptrend

Our weekly trend-following model classifies the current market price position as: Uptrend.

LEAN HOGS Futures StatisticsSPECULATORSCOMMERCIALSSMALL TRADERS
– Percent of Open Interest Longs:44.728.25.7
– Percent of Open Interest Shorts:23.747.67.4
– Net Position:69,709-64,123-5,586
– Gross Longs:148,03193,49418,865
– Gross Shorts:78,322157,61724,451
– Long to Short Ratio:1.9 to 10.6 to 10.8 to 1
NET POSITION TREND:
– Strength Index Score (3 Year Range Pct):79.920.343.9
– Strength Index Reading (3 Year Range):BullishBearishBearish
NET POSITION MOVEMENT INDEX:
– 6-Week Change in Strength Index:-16.016.36.4


COTTON Futures:

COTTON Futures COT ChartThe COTTON large speculator standing this week totaled a net position of -35,105 contracts in the data reported through Tuesday. This was a weekly advance of 3,334 contracts from the previous week which had a total of -38,439 net contracts.

This week’s current strength score (the trader positioning range over the past three years, measured from 0 to 100) shows the speculators are currently Bearish-Extreme with a score of 16.4 percent. The commercials are Bullish-Extreme with a score of 84.9 percent and the small traders (not shown in chart) are Bearish with a score of 20.8 percent.

Price Trend-Following Model: Weak Downtrend

Our weekly trend-following model classifies the current market price position as: Weak Downtrend.

COTTON Futures StatisticsSPECULATORSCOMMERCIALSSMALL TRADERS
– Percent of Open Interest Longs:28.246.94.9
– Percent of Open Interest Shorts:42.732.25.0
– Net Position:-35,10535,326-221
– Gross Longs:67,937113,02111,819
– Gross Shorts:103,04277,69512,040
– Long to Short Ratio:0.7 to 11.5 to 11.0 to 1
NET POSITION TREND:
– Strength Index Score (3 Year Range Pct):16.484.920.8
– Strength Index Reading (3 Year Range):Bearish-ExtremeBullish-ExtremeBearish
NET POSITION MOVEMENT INDEX:
– 6-Week Change in Strength Index:-3.33.01.0


COCOA Futures:

COCOA Futures COT ChartThe COCOA large speculator standing this week totaled a net position of 12,029 contracts in the data reported through Tuesday. This was a weekly reduction of -1,720 contracts from the previous week which had a total of 13,749 net contracts.

This week’s current strength score (the trader positioning range over the past three years, measured from 0 to 100) shows the speculators are currently Bearish with a score of 22.2 percent. The commercials are Bullish with a score of 77.3 percent and the small traders (not shown in chart) are Bullish with a score of 62.5 percent.

Price Trend-Following Model: Uptrend

Our weekly trend-following model classifies the current market price position as: Uptrend.

COCOA Futures StatisticsSPECULATORSCOMMERCIALSSMALL TRADERS
– Percent of Open Interest Longs:28.940.912.3
– Percent of Open Interest Shorts:15.858.57.7
– Net Position:12,029-16,2614,232
– Gross Longs:26,61137,58911,283
– Gross Shorts:14,58253,8507,051
– Long to Short Ratio:1.8 to 10.7 to 11.6 to 1
NET POSITION TREND:
– Strength Index Score (3 Year Range Pct):22.277.362.5
– Strength Index Reading (3 Year Range):BearishBullishBullish
NET POSITION MOVEMENT INDEX:
– 6-Week Change in Strength Index:-0.60.33.0


WHEAT Futures:

WHEAT Futures COT ChartThe WHEAT large speculator standing this week totaled a net position of -93,618 contracts in the data reported through Tuesday. This was a weekly decrease of -4,572 contracts from the previous week which had a total of -89,046 net contracts.

This week’s current strength score (the trader positioning range over the past three years, measured from 0 to 100) shows the speculators are currently Bearish-Extreme with a score of 19.8 percent. The commercials are Bullish-Extreme with a score of 81.8 percent and the small traders (not shown in chart) are Bullish with a score of 61.6 percent.

Price Trend-Following Model: Strong Downtrend

Our weekly trend-following model classifies the current market price position as: Strong Downtrend.

WHEAT Futures StatisticsSPECULATORSCOMMERCIALSSMALL TRADERS
– Percent of Open Interest Longs:26.339.77.5
– Percent of Open Interest Shorts:45.320.97.2
– Net Position:-93,61892,3391,279
– Gross Longs:129,713195,59236,833
– Gross Shorts:223,331103,25335,554
– Long to Short Ratio:0.6 to 11.9 to 11.0 to 1
NET POSITION TREND:
– Strength Index Score (3 Year Range Pct):19.881.861.6
– Strength Index Reading (3 Year Range):Bearish-ExtremeBullish-ExtremeBullish
NET POSITION MOVEMENT INDEX:
– 6-Week Change in Strength Index:-25.720.851.5


Article By InvestMacroReceive our weekly COT Newsletter

*COT Report: The COT data, released weekly to the public each Friday, is updated through the most recent Tuesday (data is 3 days old) and shows a quick view of how large speculators or non-commercials (for-profit traders) were positioned in the futures markets.

The CFTC categorizes trader positions according to commercial hedgers (traders who use futures contracts for hedging as part of the business), non-commercials (large traders who speculate to realize trading profits) and nonreportable traders (usually small traders/speculators) as well as their open interest (contracts open in the market at time of reporting). See CFTC criteria here.

PMI data highlights the resilience of major European economies. Japan to raise interest rate on long-term government bonds

By JustMarkets 

On Thursday, the Dow Jones Industrial Average (US30) fell by 0.34%, the S&P 500 (US500) dropped by 0.40%, and the Nasdaq (US100) closed down 0.34%. Walmart influenced the sentiment, plunging 4.5% after missing quarterly earnings expectations for the first time since 2022, despite raising its full-year sales and profit expectations. Weakness in other retail stocks heightened concerns about consumer resilience amid higher tariffs and uneven spending. On the data front, jobless claims rose more than expected, while the S&P Global Composite PMI indicated the highest rate of business activity in three years, suggesting a mixed economic backdrop. Investors are now awaiting a speech from Fed Chair Powell on Friday for signals on the Central Bank’s next moves. Futures are pricing in a 73% probability of a September rate cut.

The Mexican peso stabilized at 18.76 per dollar. Markets were digesting Banxico’s decision to cut its key rate by 25 basis points to 7.75% in a split vote. The minutes highlighted that headline inflation for July declined to 3.51%, while core inflation remained elevated at 4.23%. This combination points to both monetary easing and lingering inflation concerns.

European stock markets traded with mixed dynamics yesterday. Germany’s DAX (DE40) rose by 0.07%, France’s CAC 40 (FR40) closed down 0.44%, Spain’s IBEX35 (ES35) rose by 0.08%, and the UK’s FTSE 100 (UK100) closed up 0.23%. Frankfurt’s DAX pared its earlier losses to close slightly higher as traders weighed encouraging PMI data and positive developments in US-EU trade against ongoing uncertainty surrounding peace talks in Ukraine. Preliminary PMI data for August underscored the resilience of major European economies in the face of US tariffs and global uncertainty. Germany’s private sector activity in August rose slightly from the previous month, driven by higher-than-expected manufacturing figures. On the trade front, Brussels and Washington today released a long-awaited joint statement on a trade deal they brokered nearly a month ago, confirming that automobiles, semiconductors, and pharmaceuticals would be subject to no more than 15% tariffs upon import to the US.

WTI crude oil prices rose by 1.3% to $63.5 per barrel on Thursday, supported by signs of high US demand and uncertainty regarding efforts to end the war in Ukraine. A sharp 6 million-barrel reduction in US crude oil inventories, significantly exceeding expectations, also boosted sentiment, although an increase in Cushing stockpiles suggests that underlying demand may be less robust. Geopolitical tensions escalated, with Russia warning that peace efforts without Moscow’s participation are futile and the US announcing new tariffs on Indian goods in response to Delhi’s heavy reliance on Russian oil imports.

Asian markets also traded without any clear trend yesterday. Japan’s Nikkei 225 (JP225) fell by 0.65%, China’s FTSE China A50 (CHA50) rose by 0.51%, Hong Kong’s Hang Seng (HK50) fell by 0.24%, and Australia’s ASX 200 (AU200) showed a positive result of 1.13%.

Japan’s Ministry of Finance is preparing to raise the assumed interest rate on long-term government bonds to 2.6% in its budget requests for the 2026/27 fiscal year, which would be the highest level in 17 years. The previously assumed bond interest rate was set at 2.1% at the budget request stage for fiscal year 2025, and was later revised down to 2.0% in the final budget. The planned rate increase will lead to higher debt servicing costs. According to Kyodo News, the finance ministry will allocate about 30 trillion yen (approximately $202 billion) for debt service in its 2026/27 fiscal year budget request. This will be a record high, driven by rising long-term interest rates, the report said.

Malaysia’s annual inflation rate in July 2025 rose to 1.2% from a 4-year low of 1.1% in June, matching market expectations. Core inflation, which excludes volatile prices for fresh food and administrative services, has held at 1.8% y/y for the third consecutive month, remaining at its highest level since November 2023. On a monthly basis, consumer prices rose by 0.1%, matching the increase from the previous three months.

S&P 500 (US500) 6,370.17 −25.61 (−0.40%)

Dow Jones (US30) 44,785.50 −152.81 (−0.34%)

DAX (DE40) 24,293.34 +16.37 (+0.07%)

FTSE 100 (UK100) 9,309.20 +21.06 (+0.23%)

USD Index 98.65 +0.43 (+0.44%)

News feed for: 2025.08.22

  • Japan National Core CPI (m/m) at 02:30 (GMT+3);
  • Singapore Inflation Rate (m/m) at 08:00 (GMT+3);
  • UK Retail Sales (m/m) at 09:00 (GMT+3);
  • Canada Retail Sales (m/m) at 15:30 (GMT+3);
  • US Fed Chair Powell Speaks at 17:00 (GMT+3);
  • Jackson Hole Symposium (Day 2).

By JustMarkets


This article reflects a personal opinion and should not be interpreted as an investment advice, and/or offer, and/or a persistent request for carrying out financial transactions, and/or a guarantee, and/or a forecast of future events.

GBP/USD: Friday correction after surge

By RoboForex Analytical Department

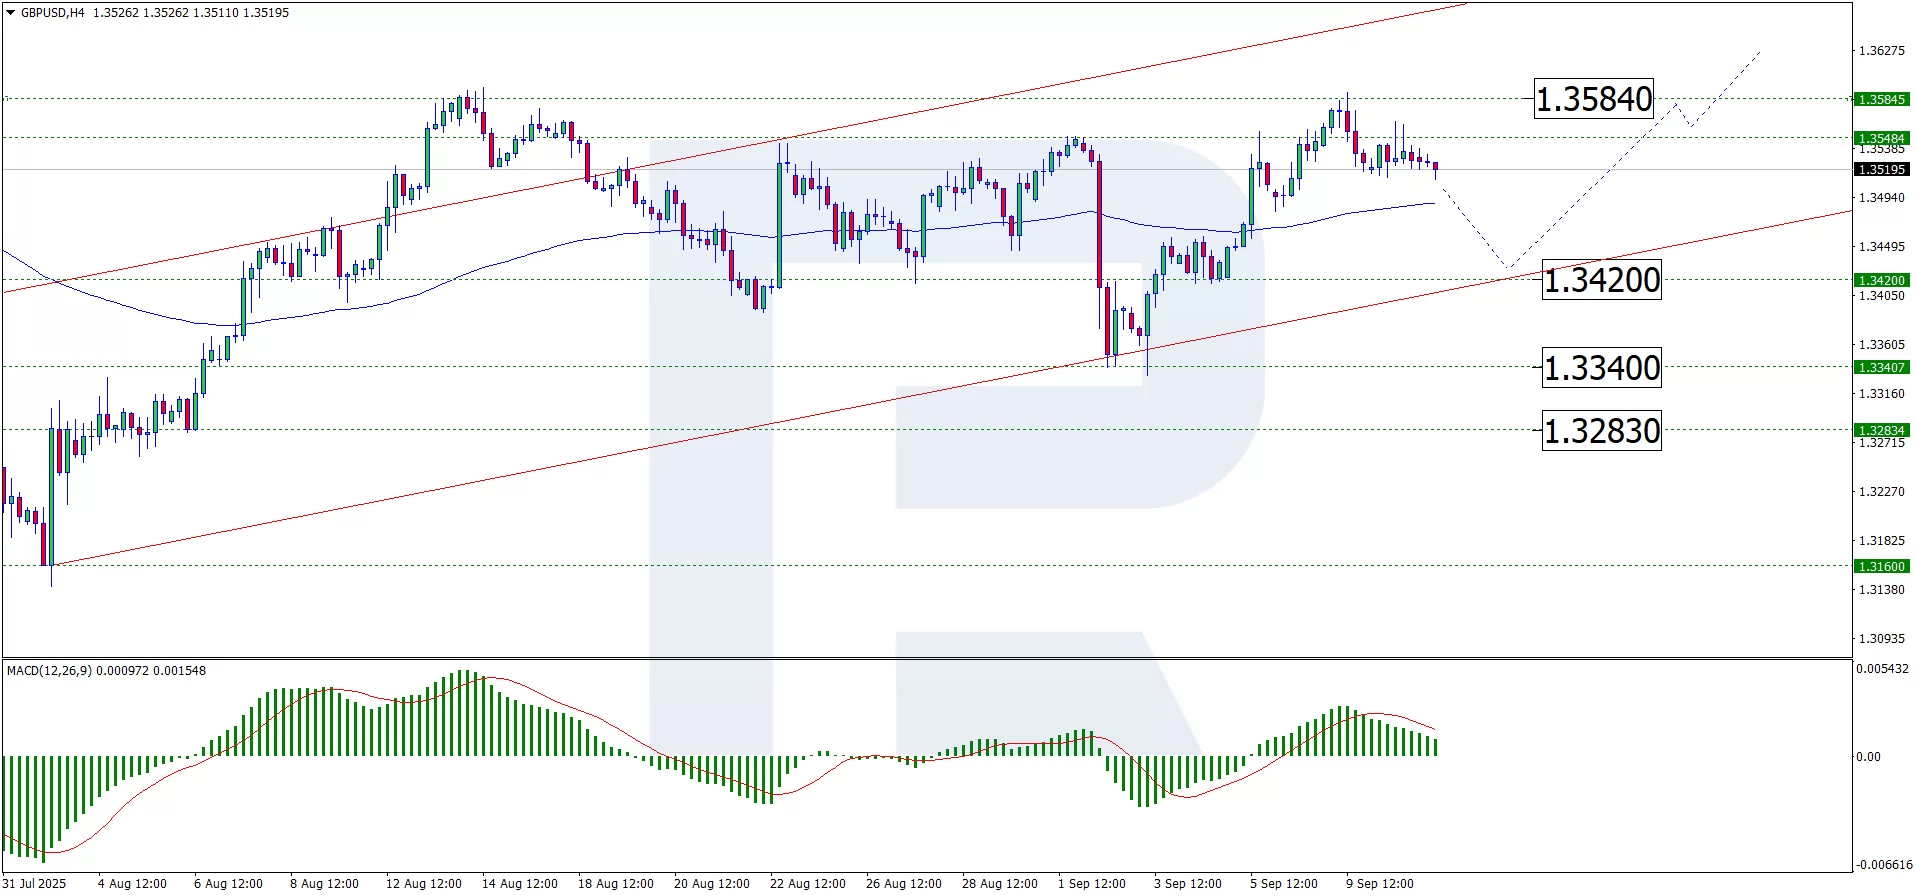
On Friday, the GBP/USD pair declined to 1.3401 after strong gains earlier in the week. The previous rally was triggered by July business activity data, which showed the best performance in a year, mainly supported by the services sector.

The release came alongside fresh UK inflation statistics, which briefly lifted sterling. However, economists noted that the price acceleration was largely driven by airfare increases rather than broad-based inflationary pressure, meaning its effect on the Bank of England policy remains limited.

Money markets are currently pricing in less than a 50% chance of a rate cut before the end of 2025. The probability of a 25-basis-point cut this year stands at only 36%, while investors do not expect the next move in interest rates before spring 2026. Since the start of 2025, the pound has already gained almost 8% against the US dollar.

Technical analysis of GBP/USD

The market built a consolidation range around 1.3472 and broke it to the downside. A decline to 1.3350 is possible, followed by a correction bounce back to 1.3472. The downtrend may later extend to 1.3270. This outlook is supported by the MACD indicator, whose signal line remains below zero and is pointing sharply downwards, confirming bearish momentum.

On the H1 timeframe, the market nearly completed a corrective wave at 1.3594 before starting a new downward movement. A decline to 1.3350 is expected, after which a short-term pullback to 1.3472 is likely. The Stochastic oscillator confirms this view: its signal line is below 50, moving downwards towards 20, indicating further downside pressure.

Summary

After a strong rally, GBP/USD entered a corrective phase. Technical indicators suggest a bearish outlook with 1.3350 and 1.3270 as key downside targets, while 1.3472 may serve as a corrective rebound level.


Disclaimer

Any forecasts contained herein are based on the author’s particular opinion. This analysis may not be treated as trading advice. RoboForex bears no responsibility for trading results based on trading recommendations and reviews contained herein.

Oil is rising as inventories decline. The Bank of Indonesia unexpectedly cut its key interest rate

By JustMarkets 

The Dow Jones Industrial Average (US30) rose by 0.04% on Wednesday. The S&P 500 (US500) fell by 0.24%. The Nasdaq (US100) closed down 0.67%. In the July FOMC meeting minutes, almost all officials supported keeping the rate at the current 4.25–4.50%, with only Michelle Bowman and Christopher Waller speaking in favor of a quarter-point rate cut to protect the weakening labor market. Their concerns were heightened after data from the Department of Labor showed lower-than-expected July employment figures, a higher unemployment rate, and a sharp downward revision of previous job gain numbers, which prompted Trump to fire the head of the Bureau of Labor Statistics. Markets believe there is an 85% probability of a September rate cut, with a speech from Powell at Jackson Hole on Friday expected to clarify his position.

European stock markets were mostly down yesterday. Germany’s DAX (DE40) fell by 0.60%, France’s CAC 40 (FR40) closed down 0.08%, Spain’s IBEX35 (ES35) fell by 0.08%, and the UK’s FTSE 100 (UK100) closed up 1.08%. The Eurozone’s annual inflation rate in July 2025 remained unchanged from the previous month at 2%, matching the flash estimate and staying slightly above the market’s initial expectation of 1.9%. This is the second consecutive month that inflation has matched the European Central Bank’s official target. The rise in service prices slowed (3.2% vs 3.3% in June), hitting a three-year low since May and offsetting acceleration in most other areas of the bloc’s consumer basket. Meanwhile, core inflation, which excludes energy, food, alcohol, and tobacco, remained unchanged at 2.3%, the lowest level since January 2022.

In August 2025, the Swedish Riksbank kept its policy rate at 2% as expected, as inflation rose more than anticipated. The growth of real wages, previous rate cuts, and an increase in business confidence are creating some conditions for economic recovery, albeit at a slow pace. Given these conditions, the Central Bank decided to leave rates unchanged, maintaining its June assessment that the outlook is broadly unchanged and leaving the door open for further rate cuts this year if inflation subsides and economic weakness persists.

WTI crude oil prices rose by 1.4% to $63.2 per barrel on Wednesday after a weekly report from the Energy Information Administration showed a 6 million-barrel decrease in US crude inventories, providing moderate support for prices. Despite the overall decline, inventories in Cushing, Oklahoma, rose for the seventh consecutive week to 23.5 million barrels, reflecting a sharp increase in supplies from the Permian Basin. Analysts noted that while the inventory decline is a “bullish” factor in the short term, the long-term outlook remains “bearish” due to an anticipated increase in OPEC+ supply and demand concerns. Futures have fallen more than 10% this year, reflecting ongoing market uncertainty.

Asian markets were mostly up yesterday. Japan’s Nikkei 225 (JP225) fell by 1.51%, China’s FTSE China A50 (CHA50) rose by 1.03%, Hong Kong’s Hang Seng (HK50) rose by 0.17%, and Australia’s ASX 200 (AU200) showed a positive result of 0.25%.

On Thursday, the Australian dollar fell to $0.642, marking its fourth consecutive session of decline and remaining at its lowest level in three weeks following the release of the latest economic data. Australia’s private sector grew at its fastest pace since April 2022, with the composite PMI rising to 54.9 in August, driven by strong expansion in services (55.1 vs 54.1 in July) and manufacturing (52.9 vs 51.3), fueled by a significant increase in new orders and an expanding client base. Meanwhile, consumer inflation expectations fell for the second consecutive month, decreasing to 3.9% in August 2025 from 4.7% in July, the lowest level since March.

The Bank of Indonesia unexpectedly cut its key interest rate by 25 bps to 5.0% at its August 2025 policy meeting, following a 25 bps cut in the previous month and contrary to market expectations of leaving rates unchanged. This was the fifth rate cut since last September, bringing the key rate to its lowest level since October 2022. The decision reflects projections that inflation in 2025–2026 will remain within the Central Bank’s target range of 2.5 plus-minus 1%, a stable rupiah exchange rate, and ongoing efforts to support economic growth. The latest data showed that Q2 GDP grew by 5.12% y/y, the highest figure in the last two years. Meanwhile, annual inflation rose to 2.37% in July from 1.87% in June, a yearly high, but still within the Central Bank’s target range.

S&P 500 (US500) 6,395.78 −15.59 (−0.24%)

Dow Jones (US30) 44,938.31 +16.04 (+0.04%)

DAX (DE40) 24,276.97 −146.10 (−0.60%)

FTSE 100 (UK100) 9,288.14 +98.92 (+1.08%)

USD Index 98.25 −0.01 (−0.01%)

News feed for: 2025.08.21

  • New Zealand Trade Balance (q/q) at 01:45 (GMT+3);
  • Australia Manufacturing PMI (m/m) at 02:00 (GMT+3);
  • Australia Services PMI (m/m) at 02:00 (GMT+3);
  • Japan Manufacturing PMI (m/m) at 03:30 (GMT+3);
  • Japan Services PMI (m/m) at 03:30 (GMT+3);
  • German Manufacturing PMI (m/m) at 10:30 (GMT+3);
  • German Services PMI (m/m) at 10:30 (GMT+3);
  • Eurozone Manufacturing PMI (m/m) at 11:00 (GMT+3);
  • Eurozone Services PMI (m/m) at 11:00 (GMT+3);
  • UK Manufacturing PMI (m/m) at 11:30 (GMT+3);
  • UK Services PMI (m/m) at 11:30 (GMT+3);
  • US Initial Jobless Claims (w/w) at 15:30 (GMT+3);
  • US Manufacturing PMI (m/m) at 16:45 (GMT+3);
  • US Services PMI (m/m) at 16:45 (GMT+3);
  • US Existing Home Sales (m/m) at 17:00 (GMT+3);
  • US Natural Gas Storage (w/w) at 17:30 (GMT+3);
  • Jackson Hole Symposium (Day 1).

By JustMarkets


This article reflects a personal opinion and should not be interpreted as an investment advice, and/or offer, and/or a persistent request for carrying out financial transactions, and/or a guarantee, and/or a forecast of future events.

EUR/USD Volatility Rises, But Fails to Drive Direction

By RoboForex Analytical Department

On Thursday, the EUR/USD pair is trading around 1.1646, consolidating after the previous session’s volatility. The market is stabilising following the recent US dollar rally, driven by expectations ahead of the Federal Reserve’s annual symposium in Jackson Hole. Investors remain cautious before Fed Chair Jerome Powell’s speech, seeking clarity on interest rate prospects and any potential adjustments to expectations of rapid monetary easing.

Futures currently assign an 82% probability of a 25-basis-point rate cut in September, down from last week’s 94%. The minutes of the July Fed meeting revealed that policymakers remain more concerned with inflation risks than labour market conditions. Tariffs, however, continue to divide opinion among officials.

In Washington, US President Donald Trump urged Fed Board Member Lisa Cook to resign amid allegations of mortgage fraud and reiterated his demand for lower interest rates. With Powell’s term expiring in May, Trump is actively considering potential successors. As expected, Treasury Secretary Scott Bessent once again advocated for a more aggressive 50-basis-point cut in September.

Technical analysis of EUR/USD

On the H4 chart, the market is consolidating around 1.1656. A downward breakout is anticipated, targeting 1.1597, with the potential for further decline to 1.1582. The first target in the next downward wave is set at 1.1455. This scenario is technically supported by the MACD indicator, whose signal line lies below zero and is pointing sharply downwards, indicating strong bearish pressure.

On the H1 chart, the pair completed a downward wave to 1.1622, followed by a correction to 1.1670, effectively defining the consolidation range. A downward breakout towards 1.1597 is possible today, followed by a rebound to 1.1645. Beyond this, the pair may resume a decline to 1.1455, with the wave potentially extending to 1.1430. The Stochastic oscillator confirms this bearish scenario: its signal line is below the 50 level and is trending sharply towards 20, signalling continued downside momentum.

Summary

The EUR/USD pair remains directionless despite heightened volatility as traders await Powell’s speech at Jackson Hole. Technical signals point to a continuation of the bearish trend, with key downside levels at 1.1597 and 1.1455, while any rebounds are likely to remain short-lived corrections.


Disclaimer

Any forecasts contained herein are based on the author’s particular opinion. This analysis may not be treated as trading advice. RoboForex bears no responsibility for trading results based on trading recommendations and reviews contained herein.

Cleantech Co. Advances Innovative Systems for Data Centers

Source: Streetwise Reports (8/19/25)

Environmental and cleantech company BioLargo Inc. (BLGO:OTCQX) announces its financial results, including a huge increase in revenue in its engineering segment due to contracts to provide control compliance services.

Environmental and cleantech company BioLargo Inc. (BLGO:OTCQX) announced that new engineering contracts to provide air quality control compliance services has increased its engineering segment revenue by 517%.

However, due to decreased volume of sales of its pet odor product Poop, overall revenues fell to US$ 2.78 million in the second quarter of this year and US$6.046 million in the first half, the company said in a release on August 13.

The company had reported in its annual report that it had achieved record revenues in 2024, marking a 45% increase compared to the previous year, largely driven by the success of Pooph. For the year ending December 31, 2024, revenues reached US$17,779,000, reflecting a 45% increase over 2023 and marking the 10th consecutive year of revenue growth, according to the company.

“There are many important technologies and products in our portfolio that will have a major role in industry,” President and Chief Executive Officer Dennis P. Calvert said.

He continued, “Over the past few months and quarters, our team has done a tremendous job in progressing the overall value of the BioLargo portfolio … the unseen value is many multiples of our current US$50 million market cap, driven by our unmatched technologies, capital-conserving strategy, highly qualified people and high impact.”

“We are very optimistic with our emerging solutions surrounding surgical products, water treatment for the global PFAS contamination crisis and battery energy storage technology,” Calvert said. “Our team is focused on creating optimal partnerships to drive commercialization of these solutions across varying industries.”

Calvert noted that BioLargo’s investments in these technologies have yielded a suite of validated technical claims and product features that “we believe are unmatched in the marketplace.” This diversification strategy has proved “especially wise” as BioLargo advances its commercial efforts into high-growth opportunities like its Clyra and Cellinity technologies, Calvert has said.

According to the company, here are some of the other key highlights of the report:

  • Clyra Medical Technologies secured a series of sales and distribution agreements to make its products available to 6,100 hospitals, 6,300 ambulatory surgery centers, and 2,200 specialty wound care clinics in the U.S. alone.
  • An independent evaluation by U.S. BESS Corporation, a leading provider of advanced energy storage solutions, confirmed the breakthrough performance of BioLargo’s Cellinity battery technology for grid-scale energy storage.
  • Cellinity, our innovative battery technology, signed four memoranda of understanding (MOUs) with prospective joint venture partners interested in building and operating Cellinity battery factories.
  • Garratt Callahan, one of the company’s co-development technology partners, continued efforts in selling and business development, focusing on the reuse of cooling tower water, such as at data centers.
  • Engineering & Environmental Services is actively working with clients to develop scopes of work and budgets for several significant projects.
  • As of June 30, 2025, stockholders’ equity was $6,060,000, assets totaled $12,499,000, liabilities were $6,439,000, and the company held $3,471,000 in cash and cash equivalents.

Independent Evaluation Confirms Advantages of Cellinity

In June, BioLargo announced that an independent evaluation had confirmed the significant advantages of its Cellinity battery technology for grid-scale energy storage systems. The assessment was carried out by U.S. BESS Corp. is a leading provider of advanced energy storage solutions for critical infrastructure in utilities, defense, microgrids, and heavy industry, according to BioLargo.

“Based on our inspection and the evidence provided, U.S. BESS finds that the Cellinity Cell demonstrates a sufficient performance profile, with strong indications of high thermal stability, efficiency, energy and power density, and material sustainability, to suggest further investment in testing and commercialization,” the report stated. “These attributes position this technology as a potential solution for critical gaps in grid-scale energy storage markets.”

The senior technical team at U.S. BESS conducted a thorough review of Cellinity’s design and assembly processes, inspected the testing infrastructure, analyzed test data, and evaluated the methodologies used for performance characterization.

U.S. BESS Corp. further determined that it is reasonable to assert that: a) the cell would not undergo thermal runaway, b) the materials used in its construction are commonly available and can be sourced domestically, c) the cell does not incorporate rare earth elements, and d) the components of the cell are fully recyclable.

Analyst Maintains Rating, Price Target

In a July 23 research note, Oak Ridge Financial Analyst Richard Ryan noted, “BioLargo’s business model approach is to invent or acquire novel technologies, develop them into product offerings, and extend their commercial reach through licensing and channel partnerships to maximize their impact.”

This cleantech and life sciences innovator, according to the analyst, has several core products that address PFAS (also known as “forever chemicals” because of the time they take to break down) contamination, advanced water and wastewater treatment, odor and volatile organic compound control, air quality improvement, energy efficiency and safe onsite energy storage, and infection control. BioLargo remains a Buy, according to Ryan.

Ryan noted that in a letter to shareholders in July, Calvert noted that he believes Pooph will ultimately be successful. He added that it is difficult to forecast future Pooph results given the lack of visibility into the business and the short time (three years) its products have been on the market.

The Catalyst: More Energy for AI, Data Centers, and Grid Resilience

The global need for grid-scale energy storage is rapidly growing to support increasing demands. In 2024, the U.S. Energy Information Administration (EIA) noted a 66% rise in battery energy storage capacity in the U.S. While lithium-ion batteries currently lead this sector, they present several challenges, such as fire risks due to thermal runaway, efficiency loss over time, and sourcing difficulties related to rare and critical minerals.

BioLargo said its Cellinity battery technology tackles these issues by using innovative materials and designs to deliver exceptional thermal performance and operational efficiency without relying on rare earth elements.

According to a February report by the International Energy Agency (IEA), global electricity consumption is expected to grow at its fastest rate in recent years, increasing by nearly 4% annually through 2027 as power use rises across various sectors.

“The growth in global demand will be the equivalent of adding an amount greater than Japan’s annual electricity consumption every year between now and 2027,” the agency noted. This surge is largely driven by the robust use of electricity for industrial production, increased demand for air conditioning, accelerating electrification led by the transport sector, and the rapid expansion of data centers.

Streetwise Ownership Overview*

BioLargo Inc. (BLGO:OTCQX)

Retail: 85.36%
Insiders & Management: 14.6%
Institutions: 0.04%
85.4%
14.6%
*Share Structure as of 6/19/2025


In the United States, the total capacity for large-scale battery storage exceeded 26 gigawatts (GW) in 2024, as detailed in the EIA’s January 2025 Preliminary Monthly Electric Generator Inventory. That year, generators added 10.4 GW of battery storage capacity, marking the second-largest increase in generating capability after solar energy. Despite the rapid growth of battery storage, it accounted for just 2% of the total 1,230 GW of utility-scale electricity generation capacity in the country in 2024.

Looking forward to 2025, battery storage growth could potentially reach new heights, with operators planning to add 19.6 GW of large-scale battery storage to the electrical grid, as indicated in the January 2025 preliminary electric generator inventory data, the agency reported.

Ownership and Share Structure

About 14.6% of BioLargo is owned by insiders and management, according to Yahoo! Finance. They include Chief Science Officer Kenneth Code with 8.3%, CEO Calvert with 3.29%, and Director Jack Strommen with 1.6%, Refinitiv reported.

About 0.04% is held by the institution First American Trust, Refinitiv said.

The rest, about 85%, is retail.

Its market cap is US$56.12 million, with about 304.85 million shares outstanding and about 262.22 million free-floating. It trades in a 52-week range of US$0.32 and US$0.16.


Important Disclosures:

  1. BioLargo Inc. is a billboard sponsor of Streetwise Reports and pays SWR a monthly sponsorship fee between US$4,000 and US$5,000.
  2. As of the date of this article, officers and/or employees of Streetwise Reports LLC (including members of their household) own securities of BioLargo Inc.
  3. Steve Sobek wrote this article for Streetwise Reports LLC and provides services to Streetwise Reports as an employee.
  4. This article does not constitute investment advice and is not a solicitation for any investment. Streetwise Reports does not render general or specific investment advice and the information on Streetwise Reports should not be considered a recommendation to buy or sell any security. Each reader is encouraged to consult with his or her personal financial adviser and perform their own comprehensive investment research. By opening this page, each reader accepts and agrees to Streetwise Reports’ terms of use and full legal disclaimer. Streetwise Reports does not endorse or recommend the business, products, services or securities of any company.
  5. This article does not constitute medical advice. Officers, employees and contributors to Streetwise Reports are not licensed medical professionals. Readers should always contact their healthcare professionals for medical advice.

For additional disclosures, please click here.

RBNZ predictably cut rates. Investors are selling off risky assets ahead of the Jackson Hole Symposium

By JustMarkets

The Dow Jones Industrial Average (US30) finished Tuesday up 0.02%. The S&P 500 (US500) fell 0.59%, and the tech-heavy Nasdaq (US100) closed down 1.39%, hitting its lowest level in over two weeks amid a sharp drop in chipmakers. US stocks largely closed lower as losses in major tech companies weighed on the market. Nvidia fell by 3.5%, AMD was down 5.4%, Broadcom dropped 3.6%, and Palantir was the weakest performer in the S&P 500, plunging 9.3%. Intel bucked the trend, rising 7% after SoftBank announced a $2 billion investment, which fueled optimism about its turnaround. Investors are now focused on the Federal Reserve’s Jackson Hole Symposium, where Chair Jerome Powell’s speech on Friday could provide insight into the September policy meeting and the possibility of rate cuts.

The Canadian dollar weakened to 1.38 per US dollar, nearing its two-month low of 1.386 from July 31, as investors digested the latest inflation data. Headline inflation slowed to 1.7% in July, largely driven by lower gasoline prices, but the Bank of Canada’s core measures remained near the top of its target range. The trimmed mean measure, in particular, was stuck at 3.0% in July against expectations of 3.1%, which pushed the market toward a more dovish stance from the Central Bank. This was compounded by an unexpected loss of 41,000 jobs in July, far worse than the 13,500 analysts had projected, and an unchanged unemployment rate of 6.9%.

Bitcoin (BTC/USD) is trading around $113,000, holding most of its losses after a sharp sell-off that sent it to a six-week low. The decline reflects the correlation between digital assets and tech stocks, as investors moved away from growth-oriented assets ahead of the Fed’s Jackson Hole Symposium. The sell-off was further intensified by reports that the Securities and Exchange Commission is investigating potential stock fraud and manipulation at Alt5 Sigma, which fueled broader risk-off sentiment in speculative markets.

European stock markets gained yesterday. Germany’s DAX (DE40) rose by 0.45%, France’s CAC 40 (FR40) closed up 1.21%, Spain’s IBEX35 (ES35) gained 0.34%, and the UK’s FTSE 100 (UK100) closed positive 0.34%. On Tuesday, European equities closed sharply higher, reaching their highest level since March, on optimism about steps taken to end the war between Russia and Ukraine. On Monday, European leaders met with US and Ukrainian Presidents Trump and Zelenskyy in Washington and announced they would provide security guarantees to Ukraine if it began to end the war.

The US natural gas prices (XNG/USD) fell below $2.80 per MBtu, their lowest level since November 2024, pressured by near-record production and high storage levels. The average production in the Lower 48 states was 108.1 billion cubic feet per day in August, up from the record 107.9 billion cubic feet per day in July. The latest EIA data showed that storage inventories grew by 56 billion cubic feet for the week ending August 8, well above seasonal norms.

Asian markets were mostly lower yesterday. Japan’s Nikkei 225 (JP225) fell by 0.38%, China’s FTSE China A50 (CHA50) declined 0.28%, Hong Kong’s Hang Seng (HK50) dropped 0.21%, and Australia’s ASX 200 (AU200) ended the day down 0.70%.

The New Zealand dollar fell by more than 1% to $0.582 on Wednesday, reaching its lowest level since mid-April, after the Reserve Bank, as expected, cut interest rates and signaled that further easing was possible. The Central Bank lowered the Official Cash Rate by 25 basis points to a three-year low of 3%, bringing its easing cycle to 250 basis points, as policymakers sought to revive a struggling economy and protect it from risks related to US tariff policy. Following the announcement, markets quickly priced in two more rate cuts by the end of the year, setting a 50% probability for such a move in October and more than a 100% chance in November.

S&P 500 (US500) 6,411.37 −37.78 (−0.59%)

Dow Jones (US30) 44,922.27 +10.45 (+0.02%)

DAX (DE40) 24,423.07 +108.30 (+0.45%)

FTSE 100 (UK100) 9,189.22 +31.48 (+0.34%)

USD Index 98.26 +0.09 (+0.09%)

News feed for: 2025.08.20

  • Japan Trade Balance (m/m) at 02:50 (GMT+3);
  • China PBoC Loan Prime Rate at 04:15 (GMT+3);
  • New Zealand RBNZ Official Cash Rate at 05:00 (GMT+3);
  • New Zealand RBNZ Monetary Policy Statement at 05:00 (GMT+3);
  • UK Consumer Price Index (m/m) at 09:00 (GMT+3);
  • Sweden Riksbank Rate Decision at 10:30 (GMT+3);
  • Eurozone Consumer Price Index (m/m) at 12:00 (GMT+3);
  • US Crude Oil Reserves (w/w) at 17:30 (GMT+3);
  • US FOMC Meeting Minutes at 21:00 (GMT+3).

By JustMarkets


This article reflects a personal opinion and should not be interpreted as an investment advice, and/or offer, and/or a persistent request for carrying out financial transactions, and/or a guarantee, and/or a forecast of future events.