By ForexTime
The S&P 500 index is widely used as the benchmark to gauge how overall US stocks are performing.
And much has already been made about the selloff that had persisted through the first half of this year, driven by fears that the Fed will send US interest rates soaring (which it has, by 225 basis points since March).
Since posting a record high early this year, this blue-chip index then fell by as much as 23.55% on June 16th, crossing over into ‘bear market’ territory.
However, since mid-June, the S&P 500 has climbed by 14.8%. Yesterday (Wednesday, August 10th), this index posted its highest closing price since May.

The question now that’s being hotly debated now is whether the worst of the US stock market’s selloff is already over.
And markets are watching closely whether we’ll see a key piece of technical evidence on the S&P 500 today that could help substantially address that very question.
But first … let’s try and understand what may be contributing to the S&P 500’s gains over the past couple of months.
What’s driving this rebound in the S&P 500?
Arguably, the primary reason is that markets believe that the Fed has done the largest chunks of its rate hikes already.
Since March, the Fed has already hiked by 225 basis points. At the time of writing, markets think there are only 125 basis points in hikes left in the Fed’s tank, to be triggered between next month and March 2023.
After that, markets think the US central bank then has to start unwinding its rate hikes (i.e. lower interest rates) sometime in the middle of next year, so as to either avoid sending the US into a full-blown recession, or at least support the demand that the Fed has already gone about destroying in the name of quelling red-hot inflation.
Recall that, generally speaking, riskier assets such as stocks dislike the thought of US interest rates moving higher.
However, if the worst of those fears (markets at one point thought that the Fed would trigger a gargantuan 100 bps hike) had already been priced in, any relief from such perceived worst-case scenarios should translate into a recovery for risk assets.
Hence, investors have been emboldened by the above narrative, and have been rewarded (so far) for “buying the dip”.
Which brings us back to the main question …
Is the worst of this year’s selloff over for the S&P 500?
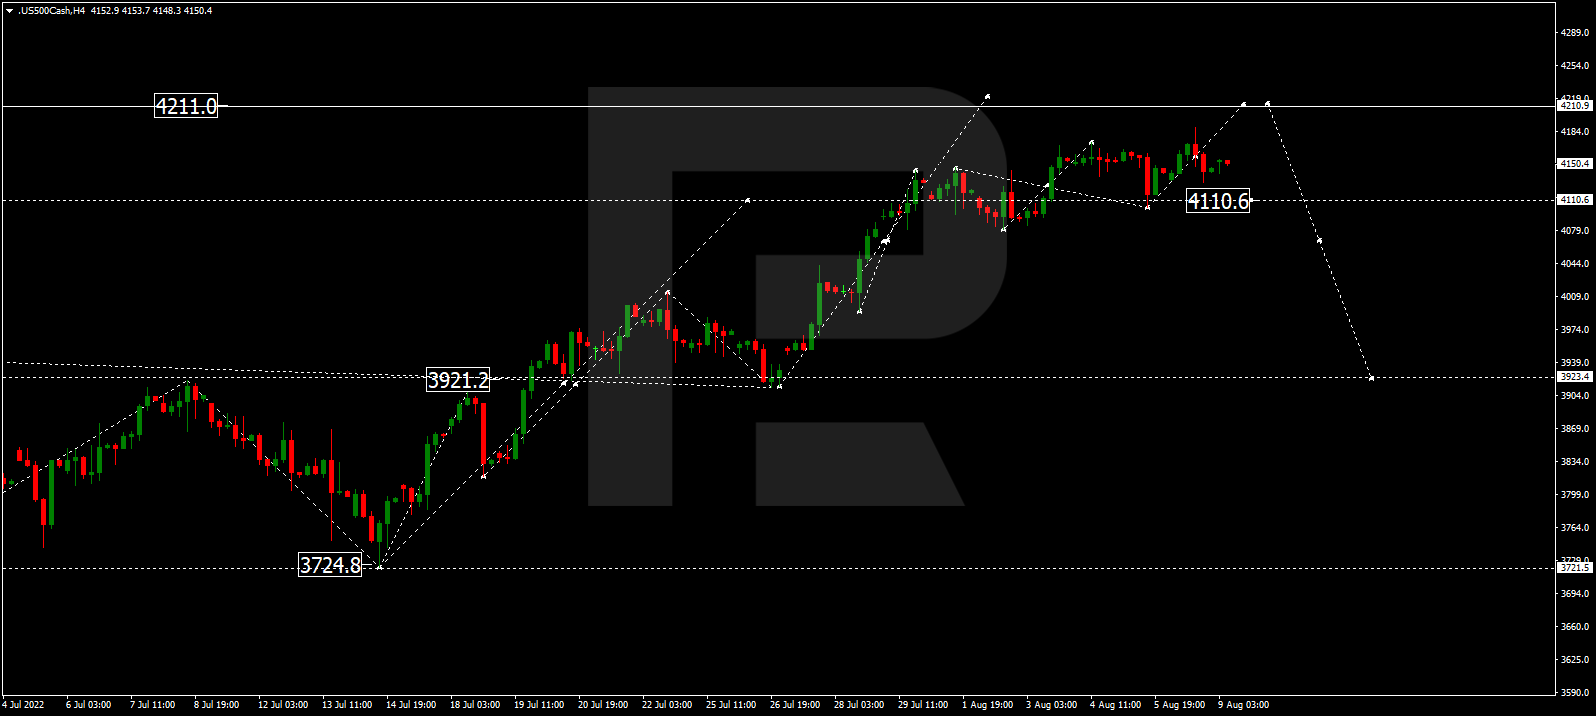
And here’s the important technical indicator that could confirm whether that the mid-June low of 3637.3 would be the lowest point for the S&P 500 for this latest selloff.
The S&P 500 has to register a daily close above 50% Fibonacci retracement level!
Looking back at the chart above, the S&P 500 has already managed to breach the 4228.6 line, which marks the halfway point from its peak-to-trough plummet in the first half of this year.
According to data compiled by CFRA (research firm) and S&P Global (ratings, analytics, and market intelligence agency), in 18 of the 19 bear markets witnessed since World War 2 (with the exception being the bear market of 1973-1974), the S&P 500 goes on to make a recovery/mark a new bull run once it closes back above its 50% Fibonacci retracement line.
In other words, once the S&P 500 secures a daily close above 4228.6, market participants can then say with greater confidence that the market bottom is indeed in the past.
But wait, there’s more …
Also, the S&P 500 has already posted a higher-high above the late-May cycle peak of 4205.7.
Such a technical event may carry less weight compared to a daily close above the 50% Fib retracement level, but can be used as a point in deciphering whether the S&P 500’s downtrend has been broken.
But let’s be careful.
To be clear, markets never move in a single, straight line.
And also from a technical perspective, the S&P 500 may be due for a pullback, given that its 14-day relative strength index is now flirting with the 70 mark that denotes ‘overbought’ conditions.
So it’s still entirely possible that the S&P 500 falters back below 4228.6, even after a daily close above that mark.
Instead, the idea is that the S&P 500 will not fall lower than the mid-June bottom of 3637.3 if the index posts a daily close above that 50% retracement level of 4228.6 (or so suggest the proponents of such a signal).
S&P 500 still at the mercy of the Fed/US economy
Risk assets have in the past two months clearly basked in the thought that the incoming Fed rate hikes would be fewer and smaller from here on out.
Such a notion was emboldened by yesterday’s (Wednesday, August 10th) lower-than-expected headline US inflation print.
The consumer price index (CPI) “only” rose by 8.5%. That is lower than almost all economists’ had forecasted (at least those surveyed by Bloomberg), and also lower than June’s year-on-year CPI advance of 9.1%.
Those participating in recent gains appear to harbour the belief that US inflation has peaked, which in turn may allow the Fed to step away from being so aggressive in its battle against multi-decade high inflation.
And so, it remains to be seen whether US inflation has truly peaked. Also, whether a full-blown, risk-off recession could undermine the S&P 500’s attempts at a full recovery.
More confirmation could be had at these upcoming economic events:
- August 25-27: Fed’s Jackson Hole Symposium
(where central bankers gather to talk about issues pertaining to the economy and monetary policy. More clues about the Fed’s view on inflation/rate hikes?) - September 2: US August nonfarm payrolls report
(can the US jobs market stay resilient enough to handle US interest rates going much higher?) - September 13: US August CPI release
(a print below July’s 8.5% may confirm that inflation in the world’s largest economy has indeed peaked) - September 21: FOMC meeting
(Fed to hike by 75bps? Or “just” 50bps?)
So stay alert and watch this space.
 Article by ForexTime
ForexTime Ltd (FXTM) is an award winning international online forex broker regulated by CySEC 185/12 www.forextime.com