By JustForex
The EUR/USD currency pair
- Prev Open: 1.0174
- Prev Close: 1.0193
- % chg. over the last day: +0.18%
According to Refinitiv, investors are considering a 69% chance that the Fed will raise rates by 75 basis points at its September meeting. The US dollar is supported by a combination of stronger US economic data and hawkish comments from regional Fed presidents, which have prompted market participants to abandon expectations of dovish Fed policy. According to strategists at Deutsche Bank, it’s too early to think about the peak of the Fed’s tightening cycle. For now, traders’ main focus is on US inflation data, which will be released on Wednesday. Analysts expect annual inflation to remain about the same. But the unexpected rise in CPI may lead to further growth in government bond yields and the US dollar.
- Support levels: 1.0176, 1.0146, 1.0112, 1.0035, 1.0000
- Resistance levels: 1.0227, 1.0245, 1.0264, 1.0284, 1.0365, 1.0415, 1.050
From the technical point of view, the trend on the EUR/USD currency pair on the hour time frame is bullish. The price is still forming a wide volatile balance with the borders of 1.0112-1.0284. Under such market conditions, buy trades are best to consider on intraday time frames from the support level of 1.0176. Sell trades can be considered from the resistance level of 1.0227 or 1.0245, but only after additional confirmation and only with short targets.
Alternative scenario: if the price breaks down through the 1.0112 support level and fixes below, the downtrend will likely resume.

The GBP/USD currency pair
- Prev Open: 1.2067
- Prev Close: 1.2075
- % chg. over the last day: +0.07%
Four weeks before Britain gets a new Prime Minister, Liz Truss is so far ahead in the polls that she thinks it’s time for Rishi Sunak to step down so she can work faster on the crises Britain is facing, including the looming recession and declining living standards. In addition to these problems, Britain’s largest electricity distribution company has announced that the £280 million damage from the bankruptcy of energy companies will be passed on to consumers. Thus, consumers will receive a double blow. This will undoubtedly harm consumer confidence and reduce business activity.
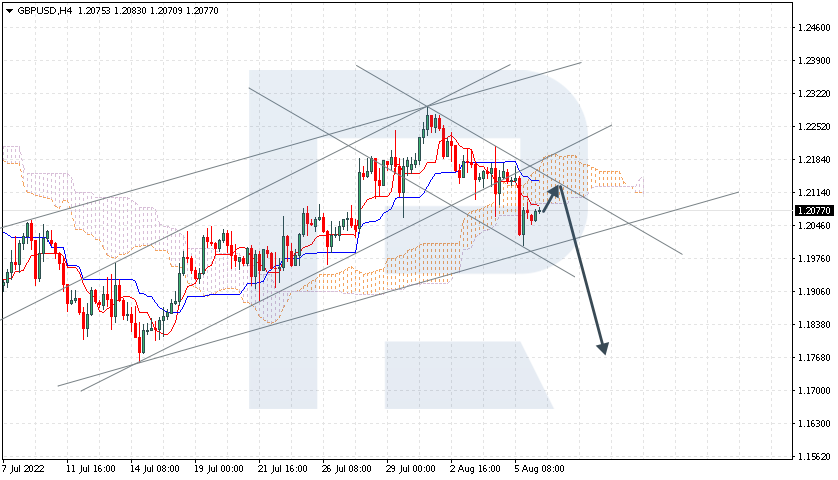
- Support levels: 1.2063, 1.2006, 1.1803
- Resistance levels: 1.2105, 1.2123, 1.2167, 1.2209, 1.2294
From the technical point of view, the trend on the GBP/USD currency pair on the hour time is bullish, but on Friday, the price broke through the priority change level but failed to consolidate below, forming a false break down. The MACD indicator becomes inactive. If the price holds below 1.2063 again, a trend will change. At the moment, it is better to look for buy trades on the intraday time frames from the support level of 1.2063, but only with a confirmation. Sell trades can be considered from the resistance level of 1.2105, but only after additional confirmation and with short targets.
Alternative scenario: if the price breaks down through the 1.2063 support level and fixes below, the downtrend will likely resume.

The USD/JPY currency pair
- Prev Open: 135.03
- Prev Close: 135.02
- % chg. over the last day: -0.01%
The situation on the USD/JPY currency pair remains unchanged, and there is nothing to add. The Bank of Japan’s ultra-soft monetary policy to support economic recovery has left the Japanese yen behind other G-10 currencies, while the US Federal Reserve is aggressively tightening monetary policy and raising interest rates aggressively. The Japanese government is already discussing a change in monetary policy, but so far, it’s all just talk. Analysts predict that the Bank of Japan will leave things as they are until the end of the year.
- Support levels: 134.29, 133.42, 132.12, 131.37, 130.85
- Resistance levels: 135.29, 136.03, 137.11
From the technical point of view, the medium-term trend on the USD/JPY currency pair is close to changing to the uptrend. The price is now trading at the priority change level but has not yet consolidated higher. A break of 135.29 will change the trend. Under such market conditions, buy trades can be sought from the support level of 134.29 or 133.42, but with additional confirmation. Resistance levels of 135.29 may be considered for sell deals, but only with additional confirmation in the form of a reverse initiative, as the price has already tested it.
Alternative scenario: If the price fixes above 135.29, the uptrend will likely resume.

The USD/CAD currency pair
- Prev Open: 1.2930
- Prev Close: 1.2855
- % chg. over the last day: -0.58%
The Canadian dollar is a commodity currency, so it depends not only on the monetary policy of the Bank of Canada but also on the USD Index and oil price movements. The dollar index traded without significant changes yesterday, while oil prices increased by 2%. A jump in oil prices gave confidence to the Canadian currency, which has strengthened a bit. The Bank of Canada and the US Federal Reserve keep interest rates at 2.5% so that parity will prevail in the USD/CAD currency pair with a short-term shift of initiative from the dollar to the Canadian and vice versa.
- Support levels: 1.2802, 1.2786
- Resistance levels: 1.2895, 1.2926, 1.3006, 1.3085, 1.3154
In terms of technical analysis, the USD/CAD currency pair trend has changed to bullish. The price confidently broke through the priority change level and consolidated above. But yesterday, against the background of rising oil prices, the USD/CAD prices dropped below the moving lines again and did it aggressively. The MACD indicator became negative with signs of sellers’ pressure. Under such market conditions, buy trades should be considered on the lower time frames from the support level of 1.2802, but only with confirmation and short targets. For sell deals, it is better to consider the resistance level of 1.2895 or 1.2926, but with confirmation.
Alternative scenario: if the price breaks out and consolidates below the 1.2786 support level, the downtrend will likely resume.

By JustForex
This article reflects a personal opinion and should not be interpreted as an investment advice, and/or offer, and/or a persistent request for carrying out financial transactions, and/or a guarantee, and/or a forecast of future events.