Archive for Financial News – Page 312

The Analytical Overview of the Main Currency Pairs on 2022.08.03

By JustForex

The EUR/USD currency pair

Technical indicators of the currency pair:
  • Prev Open: 1.0261
  • Prev Close: 1.0165
  • % chg. over the last day: -0.94%

New tensions between the US and China triggered a rise in the US dollar. Investors returned to safe-haven assets yesterday amid growing tensions between the US and China over a visit by the US speaker to the island of Taiwan, which China considers its territory. Also, the dollar was strengthened by Fed officials’ statements, which indicated that a 0.75% rate hike at the September meeting is also under active consideration. A possible economic slowdown is needed to slow inflation. The euro and other assets fell against the dollar.

Trading recommendations
  • Support levels: 1.0112, 1.0035, 1.0000
  • Resistance levels: 1.0191, 1.0264, 1.0284, 1.0365, 1.0415, 1.050

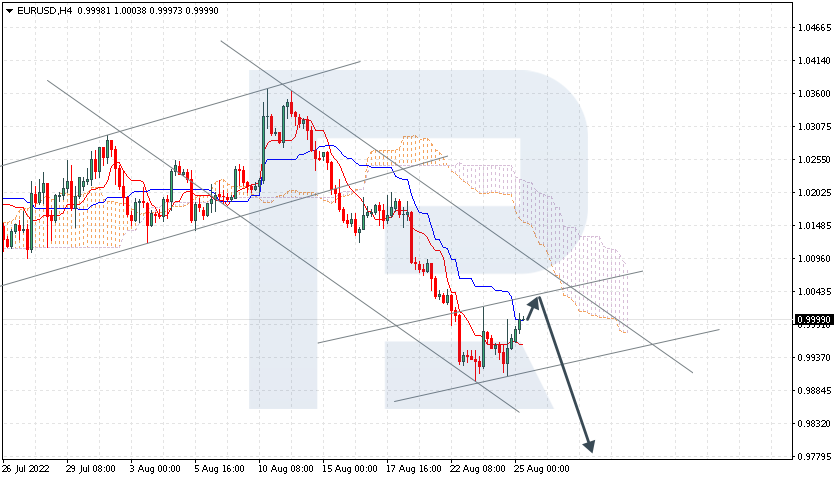
From the technical point of view, the trend on the EUR/USD currency pair on the hourly time frame is bullish. The price is still forming a wide volatile balance, but the sellers’ initiative has replaced the buyers’ pressure. The MACD indicator has become negative. Under such market conditions, buy trades are best sought on intraday time frames from the support level of 1.0112. Sell trades can be considered from the resistance level of 1.0191 or 1.0264, but only after additional confirmation and only with short targets.

Alternative scenario: if the price breaks down through the 1.0112 support level and fixes below, the downtrend will likely resume.

EUR/USD
News feed for 2022.08.03:
  • – US FOMC Member Bullard Speaks (m/m) at 01:45 (GMT+3);
  • – German Services PMI (m/m) at 10:55 (GMT+3);
  • – Eurozone Services PMI (m/m) at 11:00 (GMT+3);
  • – Eurozone Retail Sales (m/m) at 12:00 (GMT+3);
  • – US ISM Services PMI (m/m) at 17:00 (GMT+3).

The GBP/USD currency pair

Technical indicators of the currency pair:
  • Prev Open: 1.2241
  • Prev Close: 1.2161
  • % chg. over the last day: -0.65%

The Bank of England will hold its monetary policy and interest rate meeting tomorrow. Five consecutive 25 basis point hikes have raised the bank rate to 1.25%, but actual inflation continues to rise, and inflation expectations remain dangerously high. Three bank officials last time wanted a 50 basis point increase, and with the economy’s apparent growing problems, a majority may now favor a larger move. Also, tomorrow, the Bank of England is due to present a plan to reduce its balance sheet. QE is still a whopping £843.8 billion, and just last month, Bank of England Governor Bailey said that the Central Bank was considering cutting its assets.

Trading recommendations
  • Support levels: 1.2152, 1.2114, 1.2114, 1.2063, 1.1907, 1.1803
  • Resistance levels: 1.2203, 1.2294

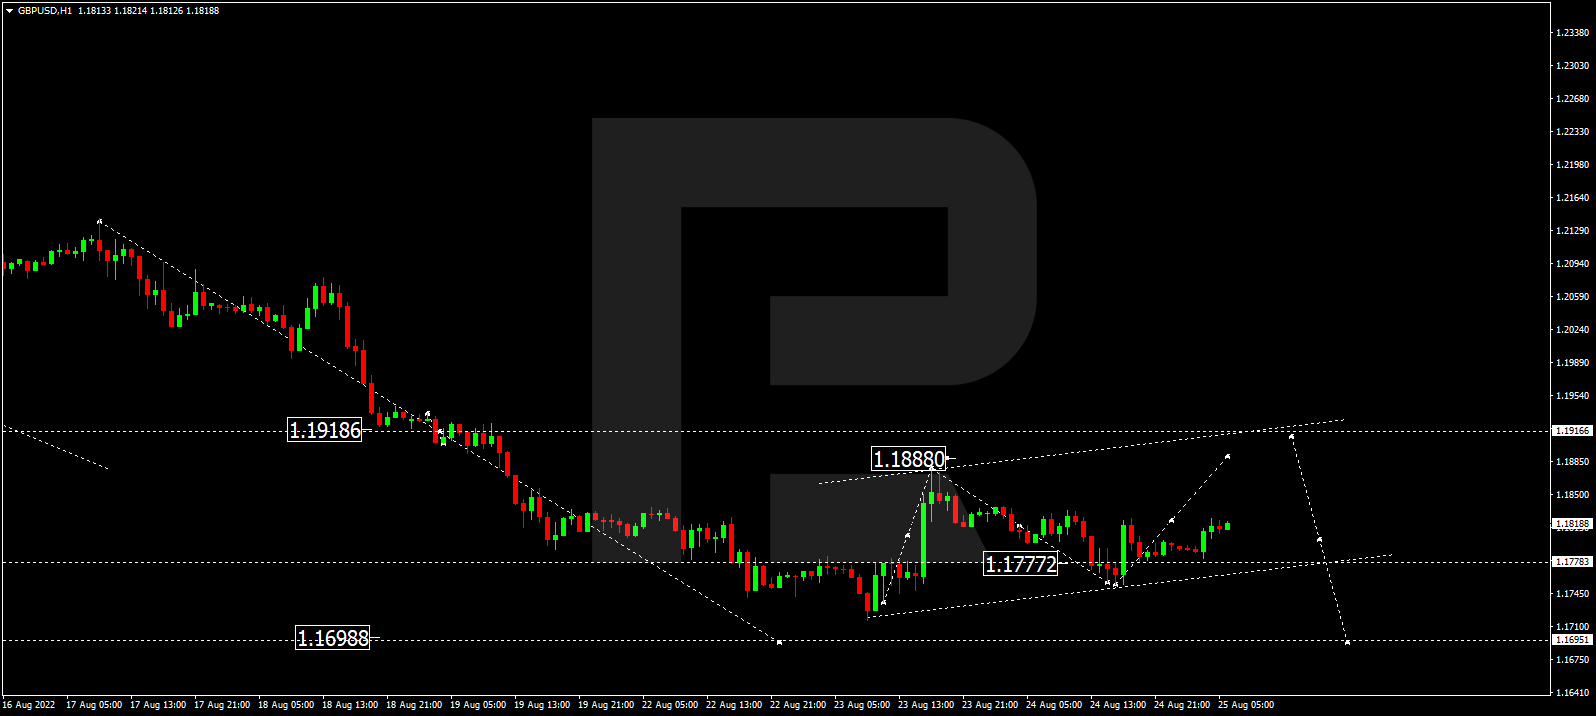
From the technical point of view, the GBP/USD currency pair trend on the hourly time frame is bullish. The price is now balanced and trading between the moving averages. The MACD indicator is in the negative zone, and there is an initiative from the sellers. Under such market conditions, it is better to look for buy trades on the intraday time frames from the support level 1.2152 or 1.2114, but only with confirmation. Sell trades can be considered from the resistance level of 1.2203, but only after additional confirmation and with short targets.

Alternative scenario: if the price breaks down through the 1.2006 support level and fixes below, the downtrend will likely resume.

GBP/USD
News feed for 2022.08.03:
  • – UK Services PMI (m/m) at 11:30 (GMT+3).

The USD/JPY currency pair

Technical indicators of the currency pair:
  • Prev Open: 131.69
  • Prev Close: 133.15
  • % chg. over the last day: +1.11%

The Japanese yen was on track for its biggest gain since the coronavirus crisis in March 2020, as growing tensions between the US and China over Taiwan and deepening fears of a global economic slowdown increased the appeal of safe-haven assets. Against the dollar, the Japanese currency brought its cumulative gains to nearly 4.5% in five trading sessions. But the US dollar is also a safe-haven currency, so yesterday, it closed the day in the background of the dollar index growth. It is also worth keeping in mind that the US Federal Reserve is on the path to higher interest rates, while the Bank of Japan keeps its monetary policy soft. Such opposite policy plays in favor of USD/JPY quotes growth.

Trading recommendations
  • Support levels: 132.42, 131.37, 130.85
  • Resistance levels: 133.17, 134.00, 135.29, 136.03, 137.11

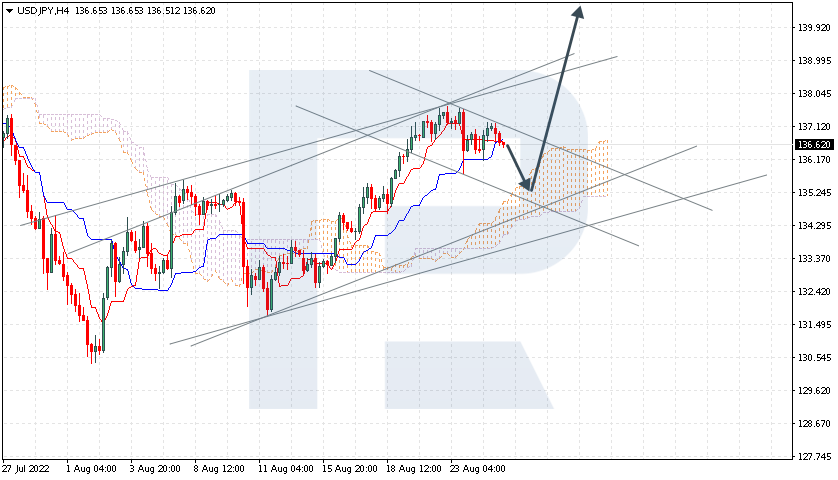
From the technical point of view, the medium-term trend on the USD/JPY currency pair is bearish. In the last trading sessions, the Japanese yen has strengthened, but yesterday the dollar intercepted the initiative. The MACD indicator became positive. Under such market conditions, buy trades can be sought from the support level of 132.42 or 131.37, but with additional confirmation. Resistance levels of 134.00 may be considered for sell deals, but only with additional confirmation and short targets.

Alternative scenario: If the price fixes above 135.29, the uptrend will likely resume.

USD/JPY
News feed for 2022.08.03:
  • – Japan Services PMI (m/m) at 03:30 (GMT+3).

The USD/CAD currency pair

Technical indicators of the currency pair:
  • Prev Open: 1.2841
  • Prev Close: 1.2879
  • % chg. over the last day: +0.29%

USD/CAD quotes increased yesterday on the back of a rising dollar and because of lower oil prices. The Canadian weakness was also affected by the manufacturing data. The manufacturing PMI fell from 54.6 to 52.5. The latest survey showed a new decline in production and new orders, while employment growth slowed. The sector was hit particularly hard in July by a drop in export sales. Cost pressures continued on the price front, with higher material, food, and transportation costs often cited as the main drivers of inflation.

Trading recommendations
  • Support levels: 1.2786
  • Resistance levels: 1.2880, 1.2923, 1.3006, 1.3085, 1.3154

In terms of technical analysis, the USD/CAD currency pair trend is bearish. At the moment, the price is forming a wide balance. The MACD indicator became positive, and there was an initiative of buyers. Under such market conditions, it is better to consider sell deals from the resistance level of 1.2880, but with confirmation. Buy trades should be considered on the lower time frames from the support level of 1.2786 or from the lower border of the channel, but only with confirmation and short targets.

Alternative scenario: if the price breaks out and consolidates above the 1.3006 resistance level, the uptrend will likely resume.

USD/CAD
News feed for 2022.08.03:
  • – US Crude Oil Reserves (w/w) at 17:30 (GMT+3).

By JustForex


This article reflects a personal opinion and should not be interpreted as an investment advice, and/or offer, and/or a persistent request for carrying out financial transactions, and/or a guarantee, and/or a forecast of future events.


New tensions between the US and China provoked investors to return to safe-haven assets

By JustForex

According to analysts at JPMorgan, the US stock market is ready for further growth, likely starting as early as the second half of this year. Easing inflation expectations and falling bond yields indicate that the peak of the hawkish sentiment has probably already passed, and for this reason, analysts at JPMorgan believe that the US economy will avoid recession, despite the negative GDP growth for two consecutive quarters. JPMorgan’s year-end target for the S&P 500 is 4,800 points, which represents a growth potential of 17% from current levels.

Cleveland Fed President Loretta Mester said yesterday that it would take some time to get inflation back to the 2% level and brushed aside concerns about a slowing economy, stressing that a slowdown is necessary. The comments came just hours after San Francisco Fed President Mary Daly said the Fed’s work on lowering inflation is far from over and that raising interest rates another 0.75% at the September meeting is also under active consideration by the Committee.

As the stock market closed yesterday, the Dow Jones Index (US30) decreased by 1.22%, and the S&P 500 Index (US500) lost 0.66%. The NASDAQ Technology Index (US100) fell by 0.10%.

An American special flight carrying US House Speaker Nancy Pelosi landed in Taipei, the administrative capital of Taiwan. According to preliminary information, Taiwanese fighters escorting Nancy Pelosi’s plane opened warning fire on Chinese fighters that had entered the air defense zone of Taiwan. The Chinese Foreign Ministry summoned the US ambassador and protested about Nancy Pelosi’s visit to Taiwan. “China’s response will be powerful and strong,” the Chinese ambassador to the US said. The US military installations in the Indo-Pacific region are on high alert.

Geopolitical tensions rose higher during the day after Chinese battery giant CATL said it would suspend plans to invest billions of dollars in a new battery plant in the United States because of House Speaker Nancy Pelosi’s trip to Taiwan.

Uber Technologies (Uber) reported its first positive cash flow and earnings that beat expectations. The company’s stock jumped by 17% on the report. Pinterest (PINS) jumped more than 12% despite quarterly results missing the Wall Street estimates. Caterpillar (CAT) showed a drop in earnings as a business exit from Russia, higher costs, and a stronger dollar impacted performance. The company’s stock is down more than 4%.

Booking (BKNG), Moderna (MRNA), Regeneron Pharma (REGN), Nintendo ADR (NTDOY), MetLife (MET), eBay (EBAY), and others report today.

Stock markets in Europe were mostly down on Tuesday. German DAX (DE30) fell by 0.23%, French CAC 40 (FR40) lost 0.42%, Spanish IBEX 35 (ES35) gained 0.15%, British FTSE 100 (UK100) closed down by 0.06%.

Challenging summer conditions, including extreme heat and drought, led to new highs in European energy prices. Rivers are too warm to cool nuclear plants in France, and water levels are too low to deliver coal to power plants, limiting Europe’s electricity supply. This means countries rely even more on gas to meet additional electricity demand. Further cuts in Russian supplies to the continent will further exacerbate the situation. Analysts believe that electricity prices in Europe will rise even higher.

Energy stocks, meanwhile, remained flat amid uncertainty over whether major oil producers will decide to raise production at Wednesday’s meeting. Commerzbank said the outcome of the OPEC+ meeting is impossible to predict for now, but there is speculation that the current output will remain unchanged.

Asian markets traded flat yesterday. Japan’s Nikkei 225 (JP225) decreased by 1.42%, Hong Kong’s Hang Seng (HK50) ended down by 2.36%, and Australia’s S&P/ASX 200 (AU200) was up by 0.07%.

S&P 500 (F) (US500) 4,091.35 −27.28 (−0.66%)

Dow Jones (US30) 32,396.76 −401.64 (−1.22%)

DAX (DE40) 13,449.20 −30.43 (−0.23%)

FTSE 100 (UK100) 7,409.11 −4.31 (−0.058%)

USD Index 106.25 +0.80 (+0.76%)

Important events for today:
  • – US FOMC Member Bullard Speaks (m/m) at 01:45 (GMT+3);
  • – New Zealand Unemployment Rate at 01:45 (GMT+3);
  • – Japan Services PMI (m/m) at 03:30 (GMT+3);
  • – Australia Retail Sales (m/m) at 04:30 (GMT+3);
  • – China Caixin Services PMI (m/m) at 04:45 (GMT+3);
  • – Switzerland Consumer Price Index (m/m) at 09:30 (GMT+3);
  • – German Services PMI (m/m) at 10:55 (GMT+3);
  • – Eurozone Services PMI (m/m) at 11:00 (GMT+3);
  • – UK Services PMI (m/m) at 11:30 (GMT+3);
  • – Eurozone Retail Sales (m/m) at 12:00 (GMT+3);
  • – US ISM Services PMI (m/m) at 17:00 (GMT+3);
  • – US Crude Oil Reserves (w/w) at 17:30 (GMT+3).

By JustForex


This article reflects a personal opinion and should not be interpreted as an investment advice, and/or offer, and/or a persistent request for carrying out financial transactions, and/or a guarantee, and/or a forecast of future events.

Inflation is spiking around the world – not just in the United States

By Christopher Decker, University of Nebraska Omaha 

The 9.1% increase in U.S. consumer prices in the 12 months ending in June 2022, the highest in four decades, has prompted many sobering headlines.

Meanwhile, annual inflation in Germany and the U.K. – countries with comparable economies – ran nearly as high: 7.5% and 8.2%, respectively, for the 12 months ending in June 2022. In Spain, inflation has hit 10%.

It might seem like U.S. policies brought on this predicament, but economists like me doubt it because inflation is spiking everywhere, with few exceptions. Rates averaged 9.65% in the 38 largely wealthy countries that belong to the Organization for Economic Cooperation and Development through May 2022.

What revved up those price increases starting in early 2021?

Scarcity put pressure on prices everywhere

When the COVID-19 pandemic began, demand for computers and other high-tech goods soared as many people switched from working in offices to clocking in at home.

Computer chip manufacturers struggled to keep up, leading to chip shortages and higher prices for a dizzying array of devices and machines requiring them, including refrigerators, cars and smartphones.

It’s not just chips. Many of the goods Americans consume, such as cars, televisions and prescription drugs, are imported from all corners of the world.

Supply chain strains

On top of problems tied to supply and demand changes, there have been major disruptions to how goods move to manufacturers and then onto consumers along what’s known as the supply chain.

Freight disruption, whether by ship, train or truck, has interfered with the delivery of all sorts of goods since 2020. That’s caused the cost of shipping goods to rise sharply.

These massive shipping disruptions have exposed the disadvantages of the popular just-in-time practice for managing inventory.

By keeping as little of the materials needed to make their products on hand, companies become more vulnerable to shortages and transportation snafus. And when manufacturers are unable to make their products quickly, shortages occur and prices surge.

This approach, especially when it involves the reliance on far-flung suppliers, has left businesses much more susceptible to market shocks.

Labor complications

The beginning of the pandemic also sent shock waves through labor markets with lasting effects.

Many businesses either fired or furloughed large numbers of workers in 2020. When governments began to relax restrictions related to the pandemic, many employers found that significant numbers of their former workers were unwilling to return to work.

Whether those workers had chosen to retire early, seek new jobs offering a better work-life balance or become disabled, the results were the same: labor shortages that required higher wages to recruit replacements and retain other employees.

Again, all of these dynamics are occurring globally, not just in the U.S.

War in Ukraine compounded these woes

Russia’s war on Ukraine, which began officially on Feb. 24, 2022, has also exacerbated inflation by interfering with the global supply of fuels and grains.

The conflict’s effects are reverberating around the globe and fueling inflation.

Russia is the world’s second-largest exporter of crude oil. Sanctions against Russian imports, combined with Russia halting oil shipments to European countries in retaliation, has led to disruptions in the global oil market.

As Europe buys more oil from the Middle East, demand for oil from that region increases, prompting price increases. Crude prices jumped from $101 per barrel in late February 2022, to $123 a month later. Prices stayed high for several months but by late July were around $100 a barrel again.

Food prices have increased substantially in the U.S. and elsewhere, partly due to this conflict. Ukraine possesses some of the most fertile soil in the world and is the third-largest exporter of corn.

Russia’s destruction of Ukrainian crops and its blockade of Ukrainian exports have led to significant price increases worldwide for agricultural commodities.

How will the world respond?

Support for globalization and international trade has waned in recent years. Given supply chain disruptions and the war in Ukraine fueling inflation, this trend will likely continue.

However, as an economist, I believe the benefits of free and open trade still outweigh current challenges.

In my view, there isn’t anything fundamentally wrong with the globalization that cannot be fixed. But, like quelling inflation and alleviating supply chain bottlenecks, it will take time.The Conversation

About the Author:

Christopher Decker, Professor of Economics, University of Nebraska Omaha

This article is republished from The Conversation under a Creative Commons license. Read the original article.


Why Nancy Pelosi’s visit to Taiwan puts the White House in delicate straits of diplomacy with China

By Meredith Oyen, University of Maryland, Baltimore County 

U.S. House Speaker Nancy Pelosi arrived in Taiwan on Aug. 2, 2022 – a highly controversial trip that has been strongly opposed by China.

Such is the sensitivity over the island’s status that even before Pelosi’s plane touched down in the capital of Taipei, mere reports of the proposed trip prompted a warning by China of “serious consequences.” In the hours before she set foot on the island, Chinese fighter jets flew close to the median line separating Taiwan and China, while Chinese foreign minister Wang Yi commented that U.S. politicians who “play with fire” on Taiwan would “come to no good end”.

For it’s part, the U.S. has distanced itself from the visit. Prior to the trip President Joe Biden said it was “not a good idea.”

As someone who has long studied the U.S.‘s delicate diplomatic dance over Taiwan, I understand why this trip has sparked reaction in both Washington and Beijing, given the current tensions in the region. It also marks the continuation of a process that has seen growing U.S. political engagement with Taiwan – much to China’s annoyance.

Cutting diplomatic ties

The controversy over Pelosi’s visit stems from the “one China” policy – the diplomatic stance under which the U.S. recognizes China and acknowledges Beijing’s position that Taiwan is part of China. The policy has governed U.S. relations with Taiwan for the last 40-plus years.

In 1979, the U.S. abandoned its previous policy of recognizing the government of Taiwan as that of all of China, instead shifting recognition to the government on the mainland.

As part of this change, the U.S. cut off formal diplomatic ties with Taiwan, with the U.S. embassy in Taiwan replaced by a nongovernmental entity called the American Institute in Taiwan.

The institute was a de facto embassy – though until 2002, Americans assigned to the institute would have to resign from U.S. State Department to go there, only to be rehired once their term was over. And contact between the two governments was technically unofficial.

As the government in Taiwan pursued democracy – starting from the lifting of martial law in 1987 through the first fully democratic elections in 1996 – it shifted away from the assumption once held by governments in both China and Taiwan of eventual reunification with the mainland. The government in China, however, has never abandoned the idea of “one China” and rejects the legitimacy of Taiwanese self-government. That has made direct contact between Taiwan and U.S. representatives contentious to Chinese officials.

Indeed, in 1995, when Lee Teng-hui, Taiwan’s first democratically elected president, touched down in Hawaii en route to Central America, he didn’t even set foot on the tarmac. The U.S. State Department had already warned that the president would be refused an entry visa to the U.S., but had allowed for a brief, low-level reception in the airport lounge during refueling. Apparently feeling snubbed, Lee refused to leave the airplane.

Previous political visits

Two years after this incident came a visit to Taiwan by then-House Speaker Newt Gingrich.

Similarly to the Pelosi visit, the one by Gingrich annoyed Beijing. But it was easier for the White House to distance itself from Gingrich – he was a Republican politician visiting Taiwan in his own capacity, and clearly not on behalf of then-President Bill Clinton.

Pelosi’s visit my be viewed differently by Beijing, because she is a member of the same party as President Joe Biden. China may assume she has Biden’s blessing, despite his comments to the contrary.

Asked on July 20 about his views on the potential Pelosi trip, Biden responded that the “military thinks it’s not a good idea right now.”

The comment echoes the White House’s earlier handling of a comment by Biden in which he suggested in May 2022 that the U.S. would intervene “militarily” should China invade Taiwan. Officials in the Biden administration rolled back the comment, which would have broken a long-standing policy of ambiguity over what the U.S. would do if China tried to take Taiwan by force.

Similarly with Pelosi, the White House is distancing itself from a position that suggests a shift in U.S.-Taiwanese relations following a period in which the U.S. had already been trying to rethink how it interacts with Taiwan.

Shifting policy?

In 2018, Congress passed the bipartisan Taiwan Travel Act. This departed from previous policy in that it allowed bilateral official visits between the U.S. and Taiwan, although they are still considered to be subdiplomatic.

In the wake of that act, Donald Trump’s Health and Human Services secretary, Alex Azar, became the highest-ranking U.S. official to visit Taiwan since 1979. Then in 2020, Keith Krach, undersecretary for economic growth, energy and the environment, visited Taiwan.

And in April 2022, a U.S. congressional delegation visited Taiwan. Pelosi herself was reportedly due to visit the island that same month, but canceled after testing positive for COVID-19.

Each of these visits has provoked angry statements from Beijing.

A high-profile visit – even one without the public backing of the White House – would signal support to the island at a time when the invasion of Ukraine by Russia has raised questions over the international community’s commitment to protect smaller states from more powerful neighbors.

Meanwhile, the erosion of democracy in Hong Kong has undermined China’s commitment to the idea of “one nation, two systems.” The principle, which allowed Hong Kong to maintain its economic, political and social systems while returning to the mainland after the end of British rule, had been cited as a model for reunification with Taiwan. The Chinese Communist Party also plans to hold its 20th congress in the coming months, making the timing sensitive for a Taiwan visit from a high-profile U.S. political figure such as Pelosi.

Editor’s note: This is an updated version of an article originally published on July 26, 2022.The Conversation

About the Author:

Meredith Oyen, Associate Professor of History and Asian Studies, University of Maryland, Baltimore County

This article is republished from The Conversation under a Creative Commons license. Read the original article.


Murrey Math Lines 02.08.2022 (AUDUSD, NZDUSD)

Article By RoboForex.com

AUDUSD, “Australian Dollar vs US Dollar”

In the H4 chart, AUDUSD is trading above the 200-day Moving Average, thus indicating an ascending tendency. In this case, the price is expected to break 7/8 and continue growing to reach the resistance at 8/8. However, this scenario may no longer be valid if the price breaks 6/8 to the downside. After that, the instrument may reverse and resume falling to return to the support at 5/8.

AUDUSDH4
Risk Warning: the result of previous trading operations do not guarantee the same results in the future

As we can see in the M15 chart, the pair has broken the upside line of the VoltyChannel indicator and, as a result, may continue moving upwards.

AUDUSD_M15
Risk Warning: the result of previous trading operations do not guarantee the same results in the future

NZDUSD, “New Zealand Dollar vs US Dollar”

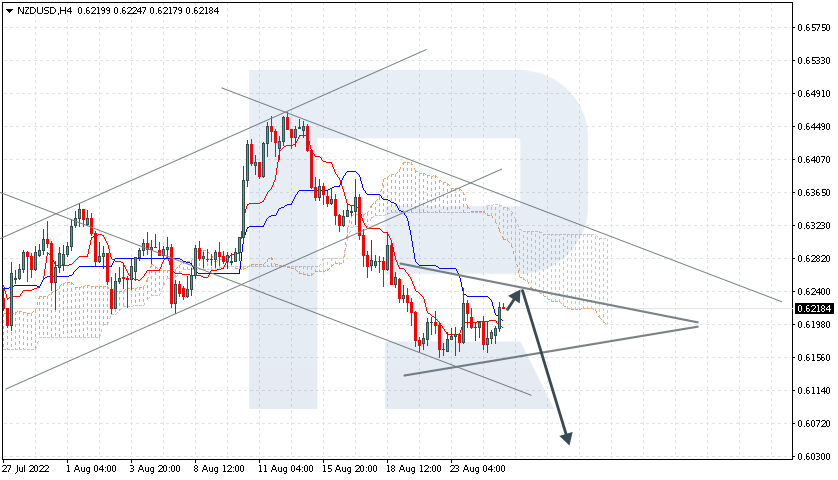
As we can see in the H4 chart, NZDUSD has reached the “overbought area”. In this case, the price is expected to rebound from 8/8 and resume moving downwards to reach the support at 6/8. However, this scenario may no longer be valid if the price breaks the resistance at 8/8 to the upside. After that, the instrument may continue growing towards +1/8.

NZDUSD_H4
Risk Warning: the result of previous trading operations do not guarantee the same results in the future

In the M15 chart, the pair may break the downside line of the VoltyChannel indicator and, as a result, continue its decline.

NZDUSD_M15

Article By RoboForex.com

Attention!
Forecasts presented in this section only reflect the author’s private opinion and should not be considered as guidance for trading. RoboForex LP bears no responsibility for trading results based on trading recommendations described in these analytical reviews.

The Euro is heading up. Overview for 02.08.2022

Article By RoboForex.com

EURUSD resumed its growth after weak PMI releases.

The major currency pair is back to growing. The current quote for the instrument is 1.0244.

The start of this trading week was rather struggling – the economic calendar offered a lot of PMI data from China, the US, and the Euro Area, which was minor.

On the other hand, it would be stupid to expect anything else. Most of the global central banks are tightening their monetary policies to fight inflation, which, in its turn, reduces business activities. Now, take a look around and you will see that the plan is working. Except that the possible consequences are looking terrifying.

The ISM Manufacturing PMI report showed 52.8 points in July after being 53.0 points the month before. However, the expected number was 52.3 points, so the actual data wasn’t too bad. Nevertheless, it’s the lowest reading since June 2020.

The components of the report showed that the major contribution to the decline was made by new orders, employment, production, and supplier deliveries.

Today’s calendar contains no important statistics, either from the US or the Euro Area. It means that investors will have to work with the facts that they already know.

Article By RoboForex.com

Attention!
Forecasts presented in this section only reflect the author’s private opinion and should not be considered as guidance for trading. RoboForex LP bears no responsibility for trading results based on trading recommendations described in these analytical reviews.

The Analytical Overview of the Main Currency Pairs on 2022.08.02

By JustForex

The EUR/USD currency pair

Technical indicators of the currency pair:
  • Prev Open: 1.0212
  • Prev Close: 1.0260
  • % chg. over the last day: +0.47%

European manufacturing PMI dipped below the level of 50 in July. This usually means that a country is approaching a recession. It is a preliminary and rough indicator, but the statistics show that a drop of 50 triggers recessive processes in the country. The Central Bank has begun to work toward easing monetary policy. In Spain, the Index fell from 52.6 to 48.7, Italy from 50.9 to 48.5, France from 49.6 to 49.5, Germany from 52 to 49.3, and the overall Eurozone PMI fell from 52.1 to 49.8. With the ECB just starting to tighten monetary policy and raise interest rates, Europe will slowly deepen into recession. Winter will not be easy for Europe.

Trading recommendations
  • Support levels: 1.0112, 1.0035, 1.0000
  • Resistance levels: 1.0284, 1.0365, 1.0415, 1.050

From the technical point of view, the trend on the EUR/USD currency pair on the hourly time frame is bullish. The price is still forming a wide volatile balance, and buyer pressure prevails now. The MACD indicator is in the positive zone. Under such market conditions, buy trades are best sought on intraday time frames from the support level of 1.0112. Sell trades can be considered from the resistance level of 1.0284, but only after additional confirmation and only with short targets.

Alternative scenario: if the price breaks down through the 1.0112 support level and fixes below, the downtrend will likely resume.

EUR/USD
News feed for 2022.08.02:
  • – US JOLTs Job Openings (m/m) at 17:00 (GMT+3).

The GBP/USD currency pair

Technical indicators of the currency pair:
  • Prev Open: 1.2164
  • Prev Close: 1.2254
  • % chg. over the last day: +0.74%

The UK manufacturing PMI declined from 52.8 to 52.1, which is better than the rest of Europe. Output fell for the first time in more than two years as new orders and export shipments continued to fall. The PMI held above the 50 mark thanks to faster job growth, increased inventories of purchases, and longer lead times for suppliers. Manufacturing output declined for the first time since May 2020, largely reflecting the downturn in the consumer and intermediate goods sub-sectors.

Trading recommendations
  • Support levels: 1.2203, 1.2150, 1.2114, 1.2063, 1.1907, 1.1803
  • Resistance levels: 1.2294

From the technical point of view, the GBP/USD currency pair trend on the hourly time frame is bullish. The price reached the daily resistance level. The MACD indicator is in the positive zone but shows signs of divergence already in several time frames. Under such market conditions, it is better to look for buy trades on the intraday time frames from the support level 1.2203, but only with confirmation. Sell trades can be considered from the resistance level of 1.2294, but only after additional confirmation and with short targets.

Alternative scenario: if the price breaks down through the 1.2006 support level and fixes below, the downtrend will likely resume.

GBP/USD
There is no news feed for today.

The USD/JPY currency pair

Technical indicators of the currency pair:
  • Prev Open: 133.25
  • Prev Close: 131.60
  • % chg. over the last day: -1.25%

The Japanese yen is strengthening amid a decline in US yields. The dollar also declined, falling to its lowest level in two months. Nervousness over an upcoming visit to Taiwan by US House Speaker Nancy Pelosi also led to an influx of capital into the yen and put pressure on other Asian currencies. However, it should not be noted that the difference between the US and Japanese interest rates is not in favor of the Japanese yen, so at any time, upward movement on the currency pair USD/JPY may resume.

Trading recommendations
  • Support levels: 130.85
  • Resistance levels: 131.37, 133.17, 134.00, 135.10, 136.03, 137.11

From the technical point of view, the medium-term trend on the USD/JPY currency pair is bearish. In the last trading sessions, the Japanese yen is getting stronger. The MACD indicator is in the negative zone, and the sellers’ pressure is still there, but there are signs of divergence. Under such market conditions, buy trades can be sought from the support level of 130.85, but with additional confirmation. Resistance levels of 131.37 may be considered for sell deals, but only with additional confirmation and short targets.

Alternative scenario: If the price fixes above 136.03, the uptrend will likely resume.

USD/JPY
There is no news feed for today.

The USD/CAD currency pair

Technical indicators of the currency pair:
  • Prev Open: 1.2808
  • Prev Close: 1.2837
  • % chg. over the last day: +0.22%

Oil decreased by almost 5% due to negative Chinese data. China is the world’s largest importer of crude oil, while the Canadian dollar is a commodity currency and depends on oil prices. Falling oil prices are weakening the Canadian dollar. It also should be noted that the Central Banks of the US and Canada keep their interest rates at the same level (2.5%), so there is no significant imbalance in this currency pair to form a long-term trend. At the same time, employment growth in Canada could affect the USD/CAD exchange rate as the Bank of Canada (BoC) wants to accelerate the path to higher interest rates. An improvement in the labor market could lead to a more aggressive rate hike.

Trading recommendations
  • Support levels: 1.2786
  • Resistance levels: 1.2880, 1.2923, 1.3006, 1.3085, 1.3154

In terms of technical analysis, the USD/CAD currency pair trend is bearish. At the moment, the price is forming a wide balance. The MACD indicator is in the negative zone, but there is a divergence, which indicates that it is harder for the price to move lower. Under such market conditions, it is better to consider sell deals from the resistance level of 1.2880, but with confirmation. Buy trades should be considered on the lower time frames from the support level of 1.2786 or from the lower border of the channel, but only with confirmation and short targets.

Alternative scenario: if the price breaks out and consolidates above the 1.3006 resistance level, the uptrend will likely resume.

USD/CAD
There is no news feed for today.

By JustForex


This article reflects a personal opinion and should not be interpreted as an investment advice, and/or offer, and/or a persistent request for carrying out financial transactions, and/or a guarantee, and/or a forecast of future events.

Australia’s Central Bank has raised its interest rate. Business activity in Europe is falling

By JustForex

According to the latest ISM report, economic activity in the US manufacturing sector rose in July, with the economy posting its 26th consecutive month of growth. But it should be noted that there is a downward trend in growth, and the PMI indicator is approaching the level of 50. Going below 50 is usually a harbinger of recession.

At the close of trading yesterday, the Dow Jones (US30) decreased by 0.14%, and the S&P 500 (US500) lost 1.28%. The NASDAQ Technology Index (US100) was down by 1.13% on Monday.

Twitter (TWTR) lost about 2%, even as Greenlight Capital announced a new stake in the social media giant, betting that the latter will emerge victorious in a legal battle with Elon Musk to force the billionaire to fulfill his $44 billion deal. Boeing (BA) shares jumped by 6% after reports that the Federal Aviation Administration cleared the maker to resume delivery of the 787 Dreamliner.

Companies reporting today include AMD (AMD), Caterpillar (CAT), PayPal Holdings Inc (PYPL), Starbucks (SBUX), Gilead (GILD), Airbnb (ABNB), Marriott Int (MAR), Uber Tech (UBER), Ferrari NV (RACE), Electronic Arts (EA), and others.

On the political front, US House Speaker Nancy Pelosi is expected to visit Taiwan as part of her tour of Asia, despite hostile threats from China. This adds significantly to the nervousness in the financial markets.

Stock markets in Europe were mostly down on Monday. German DAX (DE30) decreased by 0.03%, French CAC 40 (FR40) lost 0.18%, Spanish IBEX 35 (ES35) was 0.87% lower, British FTSE 100 (UK100) was 0.13% lower.

European manufacturing PMI dipped below the level of 50 in July. This usually means that a country is approaching a recession. It is a preliminary and rough indicator, but the statistics show that a drop of 50 triggers recessive processes in the country. The Central Bank has begun to work toward easing monetary policy. In Spain, the Index fell from 52.6 to 48.7, Italy from 50.9 to 48.5, France from 49.6 to 49.5, Germany from 52 to 49.3, and the overall Eurozone PMI fell from 52.1 to 49.8. With the ECB just starting to tighten monetary policy and raise interest rates, Europe will slowly deepen into recession. Winter will not be easy for Europe.

Oil is down nearly 5% due to negative Chinese data. Chinese factory activity declined in July amid new blockages related to COVID. China is the world’s largest importer of crude oil. OPEC+, Organization of Petroleum Exporting Countries, will meet Wednesday to decide on September production quotas for the group’s members. Analysts believe that OPEC+, which includes 23 countries, will likely leave production unchanged and only raise it slightly in September. Most importantly, OPEC+ should not cut production at this point.

Asian markets traded flat yesterday. Japan’s Nikkei 225 (JP225) gained 0.69%, Hong Kong’s Hang Seng (HK50) ended down by 0.05%, while Australia’s S&P/ASX 200 (AU200) was up by 0.69%.

Australia’s Central Bank raised its interest rate by 50 basis points to 1.85% and noted further tightening. The Bank said in a statement that it attaches great importance to getting inflation back into the 2-3 percent range over time while keeping the economy stable. The outlook for global economic growth has been worsened by pressure on real income due to higher inflation, tighter monetary policy in most countries, Russia’s invasion of Ukraine, and COVID containment measures in China.

Japan’s planned record minimum wage hike paves the way for sustained GDP growth. Japan’s average minimum wage is rising at a record pace this year. The government said Tuesday, a positive development for Prime Minister Fumio Kishida’s efforts to protect households from global inflation. Kishida expects the increase to contribute to his flagship policy of distributing wealth to the broader population to put Japan’s economy on a sustainable recovery path.

S&P 500 (F) (US500) 4,118.63 −11.66 (−0.28%)

Dow Jones (US30) 32,798.40 −46.73 (−0.14%)

DAX (DE40) 13,479.63 −4.42 (−0.033%)

FTSE 100 (UK100) 7,413.42 −10.01 (−0.13%)

USD Index 105.41 −0.49 (−0.47%)

Important events for today:
  • – Australia RBA Interest Rate Decision (m/m) at 07:30 (GMT+3);
  • – Australia RBA Rate Statement (m/m) at 07:30 (GMT+3);
  • – Switzerland Manufacturing PMI (m/m) at 10:30 (GMT+3).

By JustForex


This article reflects a personal opinion and should not be interpreted as an investment advice, and/or offer, and/or a persistent request for carrying out financial transactions, and/or a guarantee, and/or a forecast of future events.

Bond yields move lower, stocks too

By ForexTime

Asian stocks have kicked off August on the back foot as US-China tensions stir safe-haven demand. This follows on from US equities, that snapped a three-day win streak after capping their best month since 2020 last week. Trading volumes are typically thinner during summer as European traders especially are running flat trading books during the holiday season. This means volumes will be a fraction of the size of normal trading activity which can exacerbate price action and swings. These were certainly seen intraday yesterday as the broad S&P500 index moved between gains and losses.

Yesterday’s falls across the pond followed on from a gain of more than 9% for the blue-chip S&P500 in July and a 12.3% increase in the tech-heavy Nasdaq that marked the tech benchmark’s strongest month since April 2020. Easing expectations for interest rate rises and positive earnings updates from several big tech and energy companies were the two key drivers of this summer rally. The question on many investors’ lips has been if the low is now in place, or if this is a bear market rally in a broader downtrend?

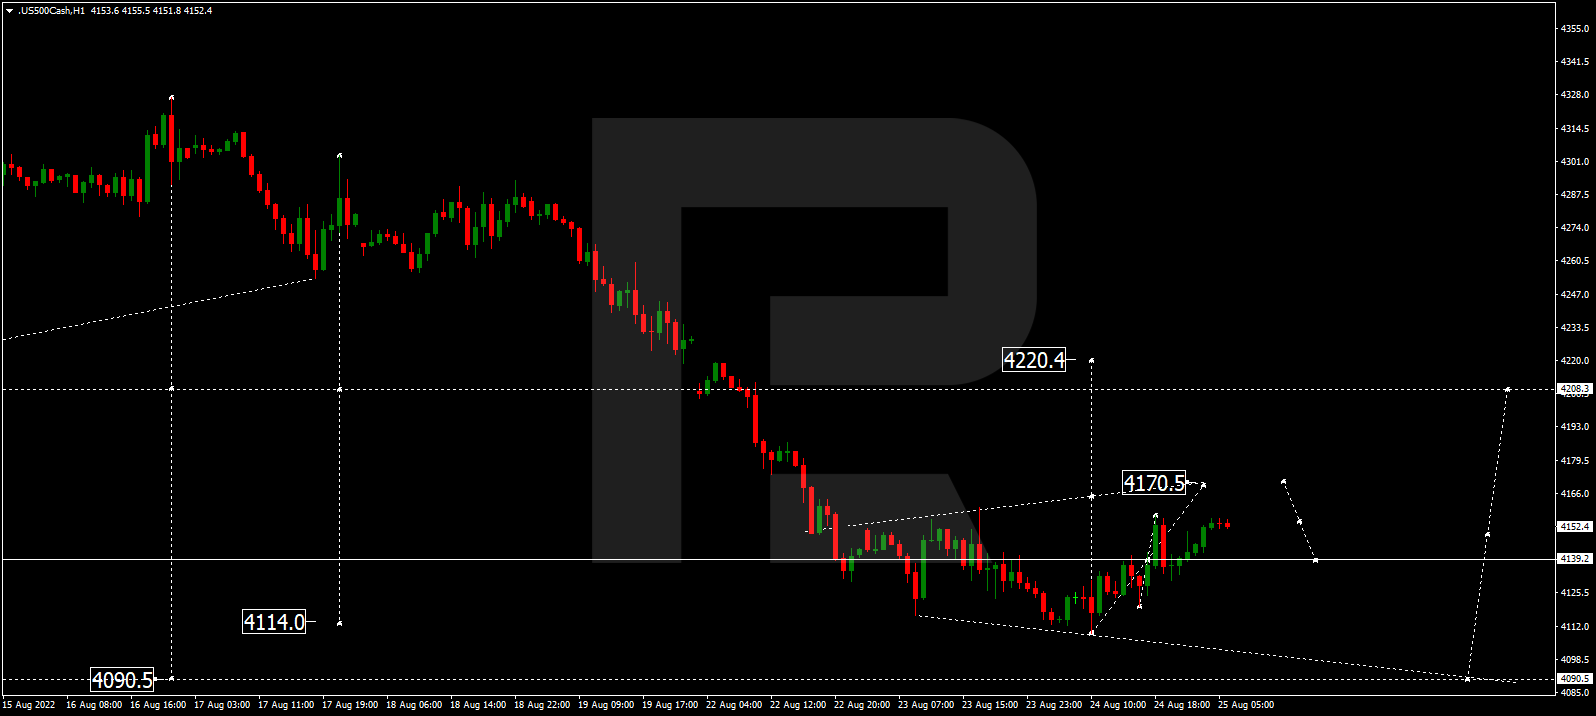
On the technical side, the S&P500 has hit the 100-day simple moving average at 4121 in a resistance zone with the February low at 4114. The halfway point of the March to June move is also near at 4137.

Data Dependent traders

Market participants are now watching data more closely too, after Fed Chair Powell, and President Lagarde, and the ECB, bailed out of offering forward guidance to investors and markets. Probably this is an honest admission that policymakers don’t know what the economy is going to do next. Instead, they are now data dependent and yesterday’s main economic indicator painted a cloudy picture at best.

The US ISM slipped to 52.9 in July, its lowest level since June 2020. Any figure above 50 indicates an expansion, but the latest result points to a slowdown in growth.  But the ISM’s index did provide an encouraging gauge that cost pressures may be easing on companies. The sub-index fell to a near two-year low, well below the estimates of economists.

Falling bond yields take down USD/JPY

The high in USD/JPY seems a distant memory today from when it was posted in mid-July above 139. The major is correlated with US 10-year rate differentials, mainly due to the Bank of Japan’s commitment to yield curve control. This effectively means where the US 10-year Treasury yield goes, so to does USD/JPY. And those yields have fallen sharply as markets have scaled back their expectations of how much the Fed will tighten policy to curb red-hot inflation. From a high close to 3.5%, the US 10-year yield is now nearing 2.5% after dropping below the lower bound of the recent sideways trading range around 2.7%. This is a mighty fall in bond markets and has weighed heavily on USD/JPY.

The major is back below 135 and smashed down through the next major support at 131.34 overnight. The latest US wage and inflation data may slow the descent of US yields. But the yen may retain a small bid on growing odds of a US recession as the Fed hiking cycle continues. This week’s bid for safe haven assets as US House Speaker Pelosi gears up to visit Taiwan is also helping the yen. The 100-day simple moving average could offer support at 130.12 as prices go into overbought territory.


Forex-Time-LogoArticle by ForexTime

ForexTime Ltd (FXTM) is an award winning international online forex broker regulated by CySEC 185/12 www.forextime.com

Crude Oil Prices Continue to Be Under Pressure

By RoboForex Analytical Department

The commodity sector remains rather tense on Monday; Brent is trading at $102.75.

Global geopolitics is what investors are focused on right now. Any complications in this area muddy the water one way or another, and it’s bad news. Last weekend, the Kosovo situation escalated – a gas pipeline “Balkan Stream” is going through Serbia, which doesn’t recognise the independence of Kosovo. The pipeline delivers natural gas from “TurkStream” to Hungary.

Later this week, OPEC and OPECF+ will have meetings. The OPEC+ agreement is ending in August and the organisations are set to discuss options to increase oil production. First of all, it depends on Saudi Arabia, a country that still has the potential for oil extraction expansion. However, Saudis don’t seem to be interested in it.

The latest report from Baker Hughes showed that over the past week, the Oil Rig Count in the US gained 6 units, up to 605. In Canada, the indicator increased by 13 units, up to 137.

On the H4 chart, Brent is forming the third ascending wave with the target at 111.55 and may later correct down to 106.16. After that, the instrument may resume trading upwards with the short-term target at 118.80. From the technical point of view, this scenario is confirmed by the MACD Oscillator: its signal line is moving above 0 inside the histogram area. Both the line and the price chart may yet continue to move upwards.

As we can see in the H1 chart, after finishing the descending correctional structure at 106.16, Brent is consolidating above this level. Possibly, the asset may break the range to the upside and start another growth with the target at 111.55, or even extends this structure up to 118.70. From the technical point of view, this idea is confirmed by the Stochastic Oscillator: after breaking 20, its signal line is heading towards 50. Later, the line may break the latter level and continue growing to reach 80.

Disclaimer

Any forecasts contained herein are based on the author’s particular opinion. This analysis may not be treated as trading advice. RoboForex bears no responsibility for trading results based on trading recommendations and reviews contained herein.