
Article By RoboForex.com
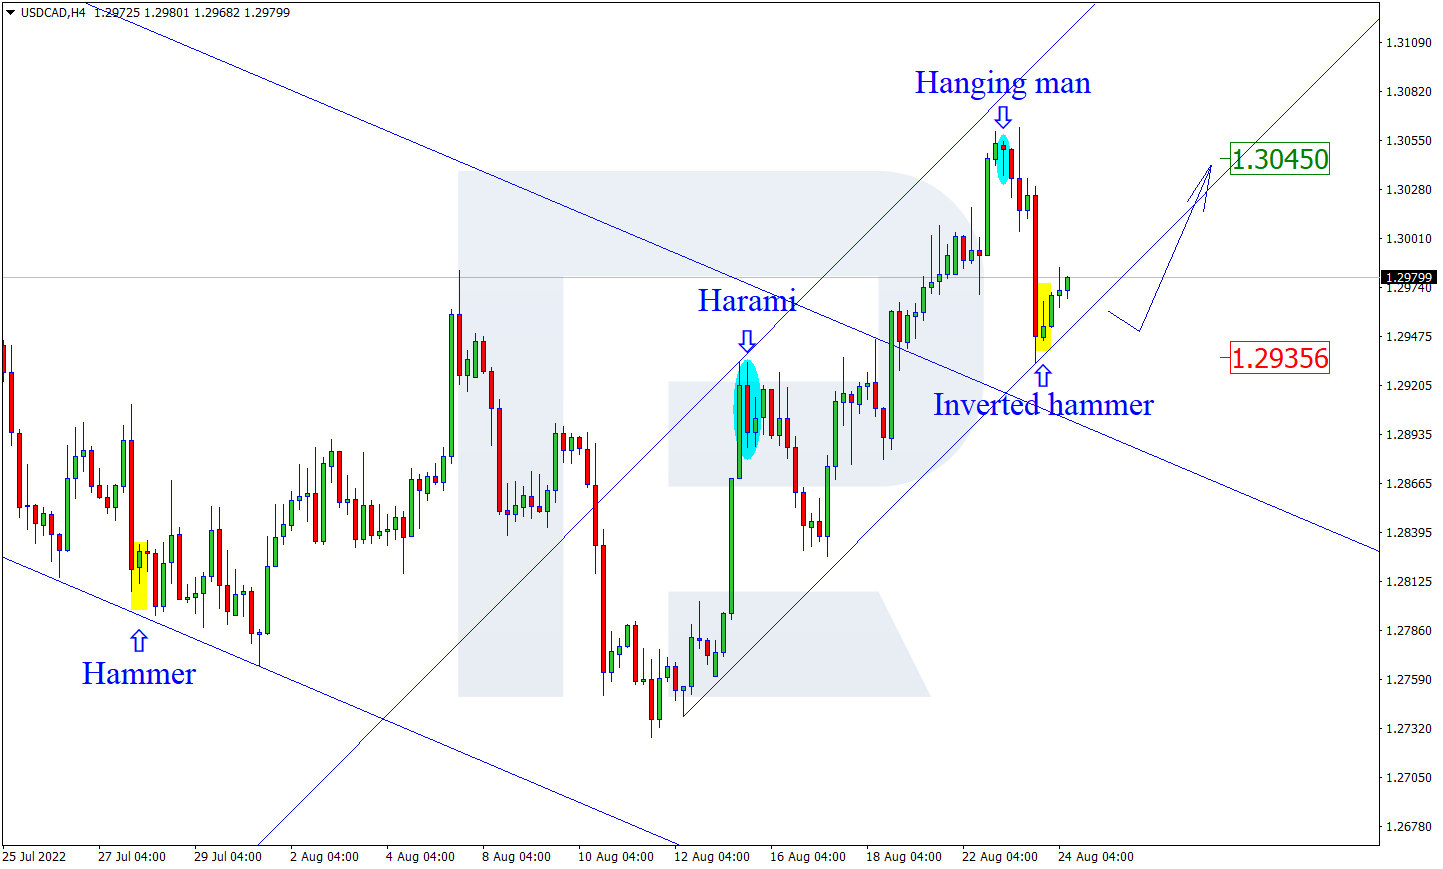
USDCAD, “US Dollar vs Canadian Dollar”
As we can see in the H4 chart, after forming several reversal patterns close to the support level, such as Inverted Hammer, USDCAD may reverse in the form of a new ascending impulse. In this case, the upside target may be at 1.3045. Later, the market may break this level and continue growing. However, an alternative scenario implies that the asset may correct to reach 1.2935 first and then resume the uptrend.

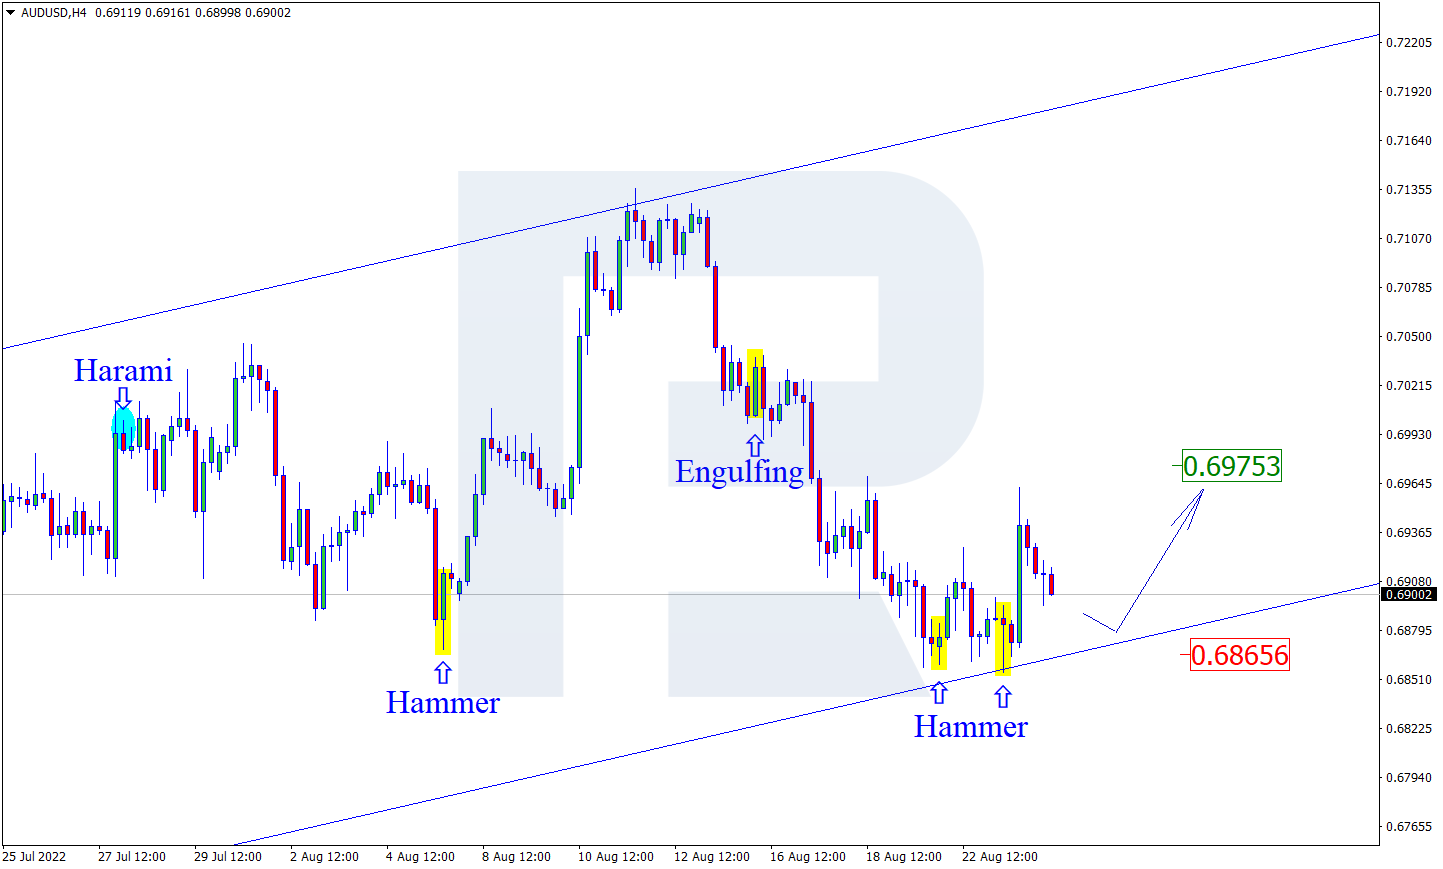
AUDUSD, “Australian Dollar vs US Dollar”
As we can see in the H4 chart, AUDUSD has formed several reversal patterns near the support area, for example, Hammer. At the moment, the asset is reversing in the form of a new rising impulse. In this case, the upside target may be the resistance level at 0.6975. After testing the level, the price may break it and continue the ascending tendency. At the same time, the opposite scenario implies that the price may correct to reach 0.6865 and continue the uptrend only after the pullback.
Free Reports:
 Get our Weekly Commitment of Traders Reports - See where the biggest traders (Hedge Funds and Commercial Hedgers) are positioned in the futures markets on a weekly basis.
 Download Our Metatrader 4 Indicators – Put Our Free MetaTrader 4 Custom Indicators on your charts when you join our Weekly Newsletter
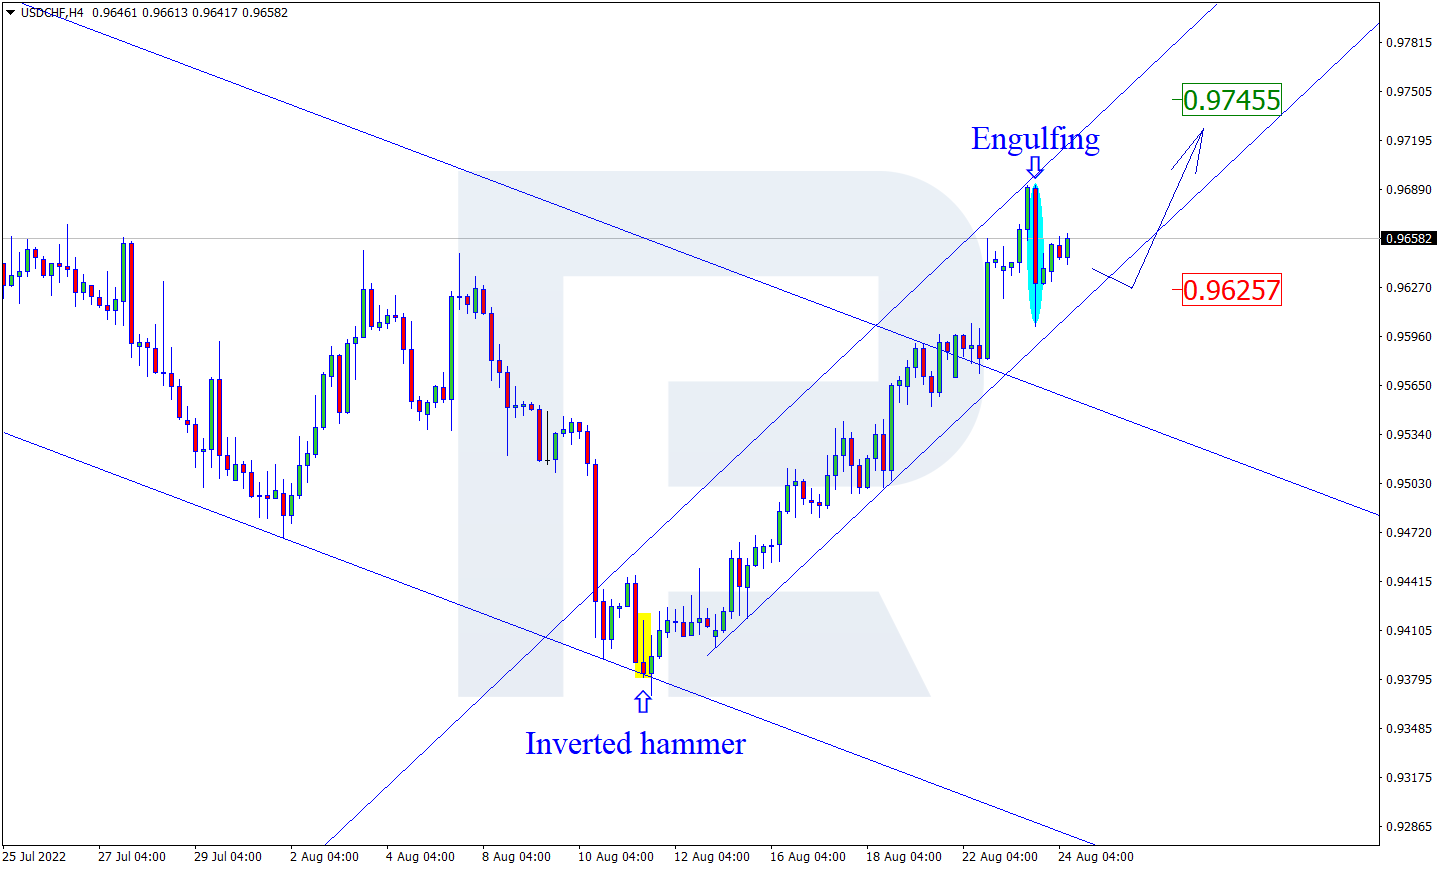
USDCHF, “US Dollar vs Swiss Franc”
As we can see in the H4 chart, after testing the resistance area, the pair has formed an Engulfing reversal pattern. At the moment, USDCHF may reverse in the form of a new descending impulse. In this case, the downside target may be at 0.9625. After testing the support level, the price may rebound from it and resume trading upwards. Still, there might be an alternative scenario, in which the asset may grow to reach 0.9745 and continue the ascending tendency only after the pullback.
Article By RoboForex.com
Attention!
Forecasts presented in this section only reflect the author’s private opinion and should not be considered as guidance for trading. RoboForex LP bears no responsibility for trading results based on trading recommendations described in these analytical reviews.

- COT Metals Charts: Weekly Speculator Changes led by Copper Jul 26, 2026
- COT Bonds Charts: Speculator Bets led by SOFR 3-Months & 5-Year Bonds Jul 26, 2026
- COT Energy Charts: Weekly Speculator Bets led by WTI Crude & Natural Gas Jul 26, 2026
- COT Soft Commodities Charts: Weekly Speculator Bets led by Corn & Soybeans Jul 26, 2026
- The US introduces new import tariffs for 60 countries. Brent crude surpasses $100 per barrel Jul 24, 2026
- USD/JPY Breaks Records: Nothing Slows the Yen’s Decline Jul 24, 2026
- Oil prices reached a 6‑week high. The AUD strengthened on the back of a strong labor‑market report Jul 23, 2026
- EUR/USD Recovers as Dollar Weakens Jul 23, 2026
- Bitcoin rose to $66,000. The New Zealand dollar continues to strengthen Jul 22, 2026
- Inflationary pressure is easing in Canada. In New Zealand, on the contrary, inflation is rising Jul 21, 2026