By JustMarkets
The EUR/USD currency pair
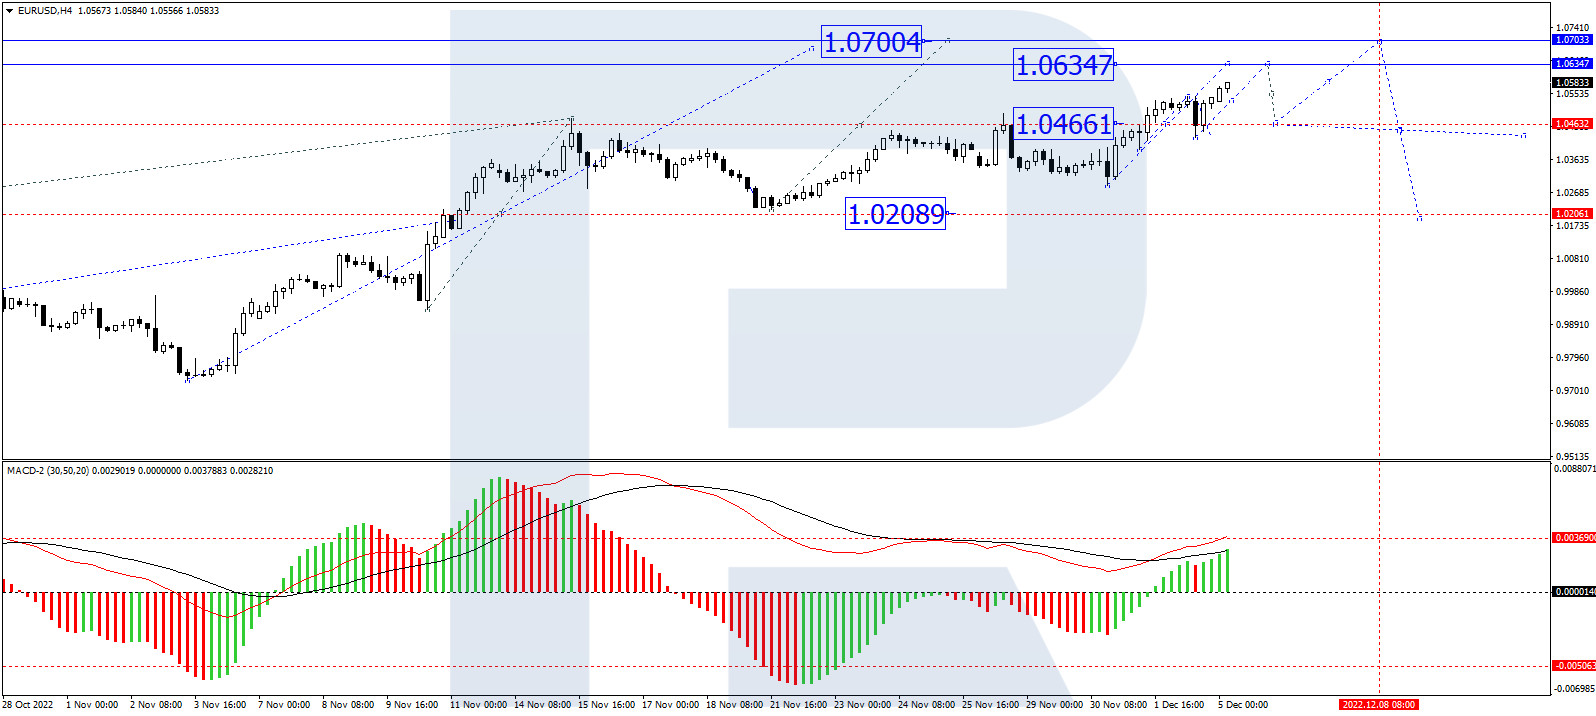
- Prev Open: 1.0484
- Prev Close: 1.0463
- % chg. over the last day: -0.20 %
European Central Bank spokesman Constantinos Herodotou said on Tuesday that interest rates will continue to rise but are now “very close” to their neutral level. ECB policymakers are repeating the same mantra without saying anything specific. That’s their style. Analysts are leaning that the ECB will raise the interest rate by 0.5% at next week’s meeting.
- Support levels: 1.0446, 1.0361, 1.0332, 1.0284, 1.0193
- Resistance levels: 1.0494, 1.0543, 1.0610
The trend on the EUR/USD currency pair on the hourly time frame is bullish. The price is trading below the levels of moving averages, the MACD indicator is in the negative zone, and there are signs of sellers’ weakness. Buy trades are best considered from the support levels of 1.0446 or 1.0361, but with additional confirmation. Sell deals can be considered from the resistance level of 1.0494, but it is better with confirmation in the form of reverse initiative.
Alternative scenario: if the price breaks down through the support level of 1.0332 and fixes below it, the downtrend will likely resume.

- – German Industrial Production (m/m) at 09:00 (GMT+3);
- – Eurozone GDP (q/q) at 12:00 (GMT+3).
The GBP/USD currency pair
- Prev Open: 1.2173
- Prev Close: 1.2132
- % chg. over the last day: -0.33 %
The UK Construction Business Activity Index fell to a three-month low. Business expectations were the weakest since May 2020. Rising interest rates, higher borrowing costs, and worries about the economic outlook reduced construction activity. The UK economic outlook remains bleak, but the new government is doing everything it can to cushion the falling economy. Analysts believe that economic indicators will decline until spring-summer 2023, after which they will reach a low and then begin a slow recovery.
- Support levels: 1.2117, 1.2016, 1.1964, 1.1684, 1.1476, 1.1418
- Resistance levels: 1.2199, 1.2254, 1.2381, 1.2431
From the technical point of view, the trend on the GBP/USD currency pair on the hourly time frame is bullish. The price is trading below the moving levels. The MACD indicator is in the negative zone, there is a slight sellers’ pressure inside the day, but the divergence indicates that correction will be completed soon. Under such market conditions, it is better to look for buy deals from the support level of 1.2127, but with confirmation. Sell trades are best to look for on intraday time frames from the resistance levels of 1.2199, but also better with confirmation in the form of a reverse initiative or a false breakout.
Alternative scenario: if the price breaks down from the 1.1965 support level and fixes below it, the downtrend will likely resume.

The USD/JPY currency pair
- Prev Open: 136.71
- Prev Close: 137.04
- % chg. over the last day: +0.24 %
Japan’s largest labor union decided last week to call for a wage increase of about 5% next spring, the highest demand in 28 years. The move indicates that Japan intends to fight rising prices by regulating wage levels rather than by changing monetary policy. Bank of Japan spokesman Nakamura also said yesterday that the central bank would continue to maintain a soft monetary policy.
- Support levels: 135.34, 133.53
- Resistance levels: 137.65, 139.09, 140.75, 143.17, 145.16
From the technical point of view, the medium-term trend on the currency pair USD/JPY is bearish. But the MACD indicator is in the positive zone, and buyers’ pressure prevails during the day. Under such market conditions, buy trades can be sought on the intraday time frames from the support level of 135.34 or from the uptrend line, but only with confirmation. Sell deals can be sought from the resistance level of 137.65, provided there is a reverse reaction.
Alternative scenario: If the price fixes above 139.08, the uptrend will likely resume.

The USD/CAD currency pair
- Prev Open: 1.3590
- Prev Close: 1.3650
- % chg. over the last day: +0.44 %
The Bank of Canada will have an important monetary policy meeting today. Higher inflation, strong economic activity, and a super tight labor market are arguments for another 50 basis point rate hike. Nonetheless, recession fears are on the rise, which means that a rate hike looks close. Traders are counting on a 73% chance of a 25 basis point rate hike by the Bank of Canada.
- Support levels: 1.3520, 1.3438, 1.3386, 1.3360, 1.3281, 1.3212
- Resistance levels: 1.3658, 1.3682, 1.3776, 1.3855
From the point of view of technical analysis, the trend on the USD/CAD currency pair has changed to bullish. The price is trading above the moving averages. The MACD indicator is in the positive zone, but there are signs of divergence. Buy trades should be considered after a slight pullback from the support level 1.3520, but with additional confirmation. For sell deals, it is better to consider the resistance level of 1.3658 but with confirmation in the form of reverse initiative.
Alternative scenario: if the price breaks down and consolidates below the support level of 1.3386, the downtrend will likely resume.

- – Canada BoC Interest Rate Decision at 17:00 (GMT+3);
- – Canada BoC Rate Statement at 17:00 (GMT+3);
- – US Crude Oil Reserves (w/w) at 17:30 (GMT+3).
By JustMarkets
This article reflects a personal opinion and should not be interpreted as an investment advice, and/or offer, and/or a persistent request for carrying out financial transactions, and/or a guarantee, and/or a forecast of future events.