On H4, at the support level, gold has formed a Harami reversal pattern. Currently, the pair is going by the signal in an ascending wave. The goal of the growth may be 1810.00. Upon testing the resistance level, the pair will get the chance for breaking through it and continuing the uptrend. However, the price may pull back to 1775.00 before further growth.
NZDUSD, “New Zealand Dollar vs US Dollar”
On H4, at the support level, the pair has formed a Hammer reversal pattern. The pair is now going by the signal in an ascending wave. The goal of the growth may be 0.6450. Upon breaking through the resistance level, the quotes will get the chance to continue the uptrend. However, the price may pull back to 0.6305 before further growth.
GBPUSD, “Great Britain Pound vs US Dollar”
On H4, at the support level, the pair has formed a Doji reversal pattern. The pair may now go by the signal in an ascending wave. The goal of the growth may be the resistance level of 1.2380. However, the price may pull back to 1.2105 before continuing the uptrend.
Attention! Forecasts presented in this section only reflect the author’s private opinion and should not be considered as guidance for trading. RoboForex LP bears no responsibility for trading results based on trading recommendations described in these analytical reviews.
The currency pair is correcting by a Wedge reversal pattern. The instrument is going above the Ichimoku Cloud, which suggests an uptrend. A test of the upper border of the Cloud at 1.2155 is expected, followed by growth to 1.2545. An additional signal confirming the growth will be a bounce off the lower border of the bullish channel. The scenario can be cancelled by a breakaway of the lower border of the Cloud and securing under 1.9175, which will mean further falling to 1.1875. The growth will be confirmed by a breakaway of the upper border of the Wedge and securing above 1.2215.
USDJPY, “US Dollar vs Japanese Yen”
The currency pair is pushing off the resistance level. The instrument is going below the Ichimoku Cloud, which suggests a downtrend. A test of the upper border of the Cloud at 137.55 is expected, followed by falling to 131.25. An additional signal confirming the growth will be a bounce off the upper border of the descending channel. The scenario can be cancelled by a breakaway of the upper border of the Cloud and securing above 139.35, which will mean further growth to 140.25. The falling will be confirmed by a breakaway of the lower border of the bullish channel and securing under 135.85.
NZDUSD, “New Zealand Dollar vs US Dollar”
The currency pair is testing the signal lines of the indicator. The instrument is going above the Ichimoku Cloud, which suggests an uptrend. A test of the upper border of the Cloud at 0.6325 is expected, followed by growth to 0.6625. An additional signal confirming the growth will be a bounce off the lower border of the bullish channel. The scenario can be cancelled by a breakaway of the lower border of the Cloud and securing under 0.6205, which will mean further falling to 0.6110.
Attention! Forecasts presented in this section only reflect the author’s private opinion and should not be considered as guidance for trading. RoboForex LP bears no responsibility for trading results based on trading recommendations described in these analytical reviews.
European Central Bank spokesman Kazimir pointed out yesterday that the inflation figure alone is not enough to slow rates down, so the ECB has plenty of “reasons” to keep tightening. Kazimir is considered among the most hawkish spokespeople and favors a 75 bps rate hike. Also, Kazimir is not convinced that Eurozone inflation has peaked but believes that the Eurozone recession will be short.
Trading recommendations
Support levels: 1.0483, 1.0361, 1.0332, 1.0284, 1.0193
Resistance levels: 1.0562, 1.0610
The trend on the EUR/USD currency pair on the hourly time frame is bullish. The price is trading at the level of the moving averages, the MACD indicator is positive again, and buying pressure is coming back. Buy trades are best considered from support levels of 1.0483, but with additional confirmation. Sell deals can be considered from the resistance level of 1.0562, but better with confirmation in the form of reverse initiative, as the price may react to the border of the inclined descending channel.
Alternative scenario: if the price breaks down through the support level of 1.0332 and fixes below it, the downtrend will likely resume.
News feed for 2022.12.08:
– Eurozone ECB President Lagarde Speaks at 14:00 (GMT+3);
– US Initial Jobless Claims (w/w) at 15:30 (GMT+3).
The GBP/USD currency pair
Technical indicators of the currency pair:
Prev Open: 1.2134
Prev Close: 1.2208
% chg. over the last day: +0.61 %
UK Chancellor of the Exchequer Jeremy Hunt is expected to unveil a series of reforms later this week that will help make London more competitive. The new chancellor wants to reduce cap rules for Britain’s biggest banks and adjust Solvency II rules to make the insurance sector more competitive. Next week, a host of major central banks will announce their latest monetary policy decisions ahead of the Christmas break. The Bank of England is expected to raise its interest rate by 0.5%.
Trading recommendations
Support levels: 1.2117, 1.2016, 1.1964, 1.1684, 1.1476, 1.1418
Resistance levels: 1.2254, 1.2381, 1.2431
From the technical point of view, the GBP/USD currency pair trend on the hourly time frame is bullish. The price is trading at the level of the moving averages. The MACD indicator has returned to the positive zone, and there is a slight buying pressure inside the day. Under such market conditions, it is better to look for buy deals from the support level of 1.2127 but with confirmation because the level has already been tested. Sell trades are best looked for on intraday time frames from resistance levels of 1.2254, but they are also better with confirmation in the form of a reverse initiative or a false breakout.
Alternative scenario: if the price breaks down of the 1.1965 support level and fixes below it, the downtrend will likely resume.
There is no news feed for today.
The USD/JPY currency pair
Technical indicators of the currency pair:
Prev Open: 136.95
Prev Close: 136.58
% chg. over the last day: -0.27 %
Japan’s economy shrank at an annualized rate of 0.8% in real terms over the last quarter, down from 1.2% last quarter. Inflation-adjusted real gross domestic product declined by 0.2% on a quarterly basis. There was a sharp increase in imports in the July-September quarter due to higher energy prices and a sharp weakening of the yen, which inflated the value of imported goods. The increase in imports has a negative impact on GDP, which measures the total value of goods and services produced in a country.
From the technical point of view, the medium-term trend on the currency pair USD/JPY is bearish. The MACD indicator has become inactive, and the price forms a flat structure. Under such market conditions, buy trades can be sought on intraday time frames from the support level of 135.34 or from the uptrend line, but only with confirmation. Sell deals can be sought from the resistance level of 137.15, provided there is a reverse reaction and a change in the structure on the intraday time frames.
Alternative scenario: If the price fixes above 139.08, the uptrend will likely resume.
News feed for 2022.12.08:
– Japan GDP (q/q) at 01:50 (GMT+3).
The USD/CAD currency pair
Technical indicators of the currency pair:
Prev Open: 1.3648
Prev Close: 1.3652
% chg. over the last day: +0.03 %
The Bank of Canada went for a more aggressive rate hike of 50 bps, although analysts had expected a 25 bps increase. The Bank of Canada’s overnight rate is now 4.25%, the highest since 2008. The Bank of Canada and the Reserve Bank of New Zealand currently hold the highest rates of any major economy. The statement indicates that inflation growth has been more robust than expected, while Canada’s labor market remains “tight” and the economy continues to operate in excess demand. Nevertheless, there is growing evidence that monetary tightening is holding back domestic demand, citing slowing consumer spending growth and a weakening housing market.
Trading recommendations
Support levels: 1.3637, 1.3520, 1.3438, 1.3386, 1.3360, 1.3281, 1.3212
Resistance levels: 1.3682, 1.3682, 1.3776, 1.3855
From the point of view of technical analysis, the trend on the USD/CAD currency pair has changed to bullish. The price is trading above the moving averages. But the MACD indicator shows a strong divergence, and there is a change in the structure of the lower time frames. Buy trades should be considered after a slight pullback from the support level of 1.3637, but with additional confirmation. For sell deals, it is better to consider the resistance level of 1.3683 but with confirmation in the form of reverse initiative.
Alternative scenario: if the price breaks down and consolidates below the support level of 1.3386, the downtrend will likely resume.
This article reflects a personal opinion and should not be interpreted as an investment advice, and/or offer, and/or a persistent request for carrying out financial transactions, and/or a guarantee, and/or a forecast of future events.
Summit Therapeutics Inc. shares traded 194% higher yesterday after the company reported it entered into an in-license agreement with Akeso Inc. for its breakthrough bispecific antibody ivonescimab, which combines a blockade of PD-1 with an anti-VEGF into a single molecule designed to target cancer. Summit has agreed to pay Akeso an upfront payment of US$500 million, which it plans to finance via an equity rights issuance.
Biopharmaceutical companySummit Therapeutics Inc. (SMMT:NASDAQ; SUMM:LON), which is engaged in the discovery, development of, and commercialization of medicines for infectious diseases, cancer, and other unmet medical needs, yesterday announced that it entered into a definitive partnership agreement with Akeso Inc. (9926.HK) to in-license its breakthrough bispecific antibody, ivonescimab.
Summit Therapeutics explained that ivonescimab, known as AK112 in China and Australia and SMT112 in the U.S, Canada, Europe, and Japan, is “a novel, potential first-in-class bispecific antibody combining the power of immunotherapy via a blockade of PD-1 with the anti-angiogenesis benefits of an anti-VEGF into a single molecule.”
The report indicated that ivonescimab is believed to be the most advanced PD-1 / VEGF bispecific antibody advanced in clinical studies, though to date, neither the U.S Food and Drug Administration (FDA) nor the European Medicines Agency (EMA) have granted approval for any PD-1- based bispecific antibodies. Summit mentioned that ivonescimab has received Breakthrough Therapy Designation status in China from The National Medical Products Administration (NMPA) for three separate indications relating to non-small cell lung cancer (NSCLC).
The agreement will provide Summit with the rights to advance, market, and commercialize SMT112 (ivonescimab) in the U.S, Canada, Japan, and Europe, with Akeso retaining the rights to develop and sell ivonescimab in China, Australia, and all other areas except for those assigned to Summit. The report stated that Akeso is considered to be a pioneer and source originator in creating and developing novel antibodies and that the in-license arrangement with Summit will allow it to advance its goals of becoming a global biopharma firm.
For its part, Summit will make an upfront payment in the amount of US$500 million to Akeso. Akeso will be eligible to receive up to an additional US$4.5 billion if certain regulatory and commercial milestones are achieved, along with low double-digit royalties on net sales.
The offering is expected to provide the company with gross proceeds of up to US$500 million, which it plans to utilize to pay its upfront payment to Akeso, support clinical development and regulatory approval for SMT112, and expand its drug pipeline.
Summit Therapeutics’ Chairman and CEO Robert W. Duggan commented, “The partnership between Summit Therapeutics and Akeso is a strategically compelling opportunity . . . We are extremely encouraged by ivonescimab and the potential for improving the quality and duration of patients’ lives based on clinical data to support this point.”
Akeso’s Co-founder, Chairwoman, CEO, and President, Dr. Michelle Xia, stated, “Ivonescimab has demonstrated the potential to deliver superior clinical benefit for patients and tremendous value for investors . . . The Akeso team has been dedicated to the development of ivonescimab for the past eight years and proudly advanced the molecule to the clinical Phase 3 stage. The global value of ivonescimab awaits great work from a great team to realize.”
“We look forward to the swift execution of the clinical development and commercial plan in a global setting for ivonescimab,” Xia added.
Summit Therapeutics advised that in a Phase 2 NSCLC trial that included patients with failed EGFR-TKI’s, those treated with ivonescimab demonstrated “an overall response rate (ORR) of 68.4% and a median Progression-Free Survival (mPFS) time period of 8.2 months when combined with combination chemotherapy (pemetrexed and carboplatin) as compared to historical mPFS of 4.3 months in patients treated with combination chemotherapy (pemetrexed and platinum-based chemotherapy) alone.”
Ivonescimab is now being developed in China and Australia for use in treating multiple solid tumors and is currently being evaluated in a Phase 3 clinical trial in patients with NSCLC that is positive for an epidermal growth factor receptor (EGFR) mutation and whose disease has progressed after treatment with an EGFR tyrosine-kinase inhibitor (TKI).
Co-CEO, President, and Summit Board Member Maky Zanganeh remarked, “We have found the ideal partnership with the potential to change the paradigm for treating patients facing difficult odds with devastating diagnoses . . . 10 years ago, metastatic lung cancer patients rarely survived for more than ten to twelve months from diagnosis. Today, survival can be measured in years.”
Summit advised that it intends to finance its obligations under the agreement by the issuance of a rights offering that will allow its common shareholders of record to purchase non-transferable subscription rights to buy common shares at the lesser of US$1.05 per share or the five-day volume weighted-average price of its shares prior to the date of the transaction. The offering is expected to provide the company with gross proceeds of up to US$500 million, which it plans to utilize to pay its upfront payment to Akeso, support clinical development and regulatory approval for SMT112, and expand its drug pipeline.
Summit Therapeutics is a biopharmaceutical firm headquartered in Menlo Park, Calif. The company is engaged in discovering, developing, and commercializing medicines to treat cancer, infectious and other diseases with high unmet needs. The firm is highly focused on developing SMT112 (ivonescimab), which was engineered to combine two well-established oncology-targeted mechanisms of action. Initially, the company’s SMT112 development efforts at being directed at treating NSCLC. Summit plans to begin treating patients in clinical studies by Q2/23.
Akeso is a biopharma company engaged in the discovery, development, manufacturing, and marketing of medicines designed to address high unmet medical needs worldwide. The company’s pipeline includes more than 30 assets that are being developed to treat cancer, autoimmune disease, inflammation, metabolic disease, and other therapeutic areas. To date, 17 of these product candidates have been advanced into clinical trials. Akeso’s Kaitanni (cadonilimab) received approval from China’s NMPA in June 2022 for use in the treatment of relapsed or metastatic cervical cancer in patients who progressed on or after platinum-based chemotherapy making it the first commercialized PD-1-based bispecific drug globally.
Summit Therapeutics started off the day yesterday with a market cap of around US$158.0 million with approximately 201.3 million shares outstanding. SMMT shares opened 68% higher yesterday at US$1.32 (+US$0.535, +68.15%) over the previous day’s US$0.785 closing price. The stock traded yesterday between US$1.19 and US$1.59 per share and closed for trading at US$1.54 (+US$0.755, +96.18%).
Disclosures:
1) Stephen Hytha wrote this article for Streetwise Reports LLC and provides services to Streetwise Reports as an independent contractor. He or members of his household own securities of the following companies mentioned in the article: None. He or members of his household are paid by the following companies mentioned in this article: None.
2) The following companies mentioned in this article are billboard sponsors of Streetwise Reports: None. Click here for important disclosures about sponsor fees.
3) Comments and opinions expressed are those of the specific experts and not of Streetwise Reports or its officers. The information provided above is for informational purposes only and is not a recommendation to buy or sell any security.
4) The article does not constitute investment advice. Each reader is encouraged to consult with his or her individual financial professional and any action a reader takes as a result of information presented here is his or her own responsibility. By opening this page, each reader accepts and agrees to Streetwise Reports’ terms of use and full legal disclaimer. This article is not a solicitation for investment. Streetwise Reports does not render general or specific investment advice and the information on Streetwise Reports should not be considered a recommendation to buy or sell any security. Streetwise Reports does not endorse or recommend the business, products, services or securities of any company mentioned on Streetwise Reports.
5) From time to time, Streetwise Reports LLC and its directors, officers, employees or members of their families, as well as persons interviewed for articles and interviews on the site, may have a long or short position in securities mentioned. Directors, officers, employees or members of their immediate families are prohibited from making purchases and/or sales of those securities in the open market or otherwise from the time of the decision to publish an article until three business days after the publication of the article. The foregoing prohibition does not apply to articles that in substance only restate previously published company releases.
6) This article does not constitute medical advice. Officers, employees and contributors to Streetwise Reports are not licensed medical professionals. Readers should always contact their healthcare professionals for medical advice.
National Economic Council Director Brian Deese said yesterday that the US economy is resilient despite the Federal Reserve raising interest rates. Brian Deese also added that low credit card delinquencies and mortgage problems point to resilient household balance sheets, while the labor market and savings rates also point to more robust growth. Moreover, he pointed to slowing inflation as a positive sign of healthier economic growth. But at the moment, the Fed is expected to raise rates again at its meeting next week, and that is putting downward pressure on quotes. As the stock market closed Wednesday, the Dow Jones Index (US30) closed at opening levels, while the S&P 500 Index (US500) was down by 0.19%. Technology Index NASDAQ (US100) fell by 0.51% yesterday. All three indices closed negative.
The 2/10 Treasury bond yield curve flipped by 82 basis points, the biggest reversal in 40 years, signaling growing fears of a potential recession.
The Bank of Canada has chosen a more aggressive 50 bps rate hike, though analysts had expected a 25 bps increase. The Bank of Canada’s overnight rate now stands at 4.25%, the highest since 2008. The Bank of Canada and the Reserve Bank of New Zealand currently hold the highest rates of the major economies. The statement indicates that inflation growth has been more robust than expected, while Canada’s labor market remains “tight” and the economy continues to operate in excess demand. The Bank of Canada plans a final 25 basis point hike early next year and will take a long pause after that. The next meeting is scheduled for January 25.
Equity markets in Europe were mostly down yesterday. German DAX (DE30) decreased by 0.57%, French CAC 40 (FR40) fell by 0.41%, Spanish IBEX 35 (ES35) was down by 0.50%, British FTSE 100 (UK100) closed on Wednesday with minus 0.43%.
European Central Bank Governing Council spokesman Peter Kazimir expressed support for a third straight 75 basis point interest rate hike next week. While the slowdown to 10% in November is welcome, it is too early to declare that the worst of the unprecedented price spike is over, Kazimir said in an interview. According to him, any recession in the eurozone is likely to be short, and inflation will remain above the target level even in 2025. In addition to interest rates, officials will also discuss how to begin writing off about 5 trillion euros ($5.3 trillion) worth of bonds bought in recent years as part of stimulus measures, a process known as quantitative tightening (QT).
The UK and US are forming a new energy partnership aimed at improving energy security and lowering prices. The new partnership will stimulate work to reduce global dependence on energy exports from Russia, stabilize energy markets, and increase cooperation on energy efficiency, nuclear power, and renewable energy. As part of this, the US will export at least 9 to 10 billion cubic meters of LNG over the next year through British terminals, more than double the level exported in 2021.
China seems to have loosened its zero COVID policy considerably, but US crude reserves showed a huge increase in petroleum products, which outweighs the country’s weekly crude consumption. Crude oil inventories were down by 5.187 million barrels, compared to expectations of a 3.305 million barrel decline. That sent crude oil prices down for the fourth straight day, near a yearly low. January WTI crude oil fell by 3% to $72 a barrel. Brent crude oil fell by 2.8% to $77.11/bbl in London trading.
Asian markets were mostly down yesterday. Japan’s Nikkei 225 (JP225) decreased by 0.72%, Hong Kong’s Hang Seng (HK50) was 3.22% lower, and Australia’s S&P/ASX 200 (AU200) was 0.85% lower.
Asian markets were mostly down yesterday. Japan’s Nikkei 225 (JP225) gained 0.24%, Hong Kong’s Hang Seng (HK50) ended the day down by 0.40%, and Australia’s S&P/ASX 200 (AU200) fell by 0.47%.
China on Wednesday announced its biggest easing of COVID restrictions, lifting several travel restrictions and testing mandates. The move sparked some gains in Asian markets in the previous session. But with China still struggling with a record-high daily increase in COVID-19 cases, investors remain uncertain as to when Beijing will announce a full opening.
Japan’s economy shrank at an annualized rate of 0.8% in real terms in the last quarter, down from 1.2% last quarter. Inflation-adjusted real gross domestic product shrank by 0.2% on a quarterly basis. The country recorded an unexpected current account deficit in the third quarter on the back of lower exports and more expensive imports.
S&P 500 (F) (US500) 3,933.78 −7.48 (−0.19%)
Dow Jones (US30) 33,596.87 +0.53 (+0.02%)
DAX (DE40) 14,261.19 −82.00 (−0.57%)
FTSE 100 (UK100) 7,489.19 −32.20 (−0.43%)
USD Index 105.15 -0.43 (-0.41%)
Important events for today:
– Japan GDP (q/q) at 01:50 (GMT+3);
– Eurozone ECB President Lagarde Speaks at 14:00 (GMT+3);
– US Initial Jobless Claims (w/w) at 15:30 (GMT+3);
This article reflects a personal opinion and should not be interpreted as an investment advice, and/or offer, and/or a persistent request for carrying out financial transactions, and/or a guarantee, and/or a forecast of future events.
The USDJPY currency pair (nickname “the Yen”) on the H4 time frame was in a downtrend until 2 December, when a last lower bottom was recorded at 133.611.
After the bottom at 133.611, the market broke through the 15 and 34 Simple Moving Averages and the Momentum Oscillator broke the 100 baseline into bullish terrain. A possible shift in the market momentum from bearish to bullish was further confirmed with many strong bullish candles driving the price significantly higher to make a higher top.
A possible critical resistance level was formed at a higher top that was reached on 7 December at 137.847. The bears then tried their best to dominate the market again but failed when a higher bottom formed later in the same session at 136.261.
If the Yen manages to break through the critical resistance level at 137.847, then three possible price targets can be considered from there. Attaching the Fibonacci tool to the higher top at 137.847 and dragging it to the support level near the 34 Simple Moving Average at 136.261, the following targets can be calculated. The first target is estimated at 138.827 (161.8%). The second price target can be forecast at 140.413 (261.8%) and the third and final target might be anticipated at 142.979 (423.6%).
If the support level at 136.261 is broken, the above scenario is no longer valid.
With Russian troops digging trenches to prepare for an expected winter standoff, it would be easy to conclude that fighting will slow in Ukraine until after the ground thaws in the spring.
But evidence from the Ukrainian battlefields point to a different trajectory.
As a career U.S. special forces officer who conducted field research on the 2008 and 2014 wars in Georgia and Ukraine, it is my view that this war has demonstrated that only one side, the Ukrainians, can execute effective combat maneuvers. I believe that the Ukrainians will attempt to launch a large-scale counteroffensive in late winter when the ground is still frozen.
Winter’s impact on war
Historically, the pace of fighting does slow in the winter.
Weapons and other equipment can freeze up in extreme cold, and it’s much more difficult to shoot a weapon while wearing thick gloves.
Shorter days are a factor. Despite technological advances, most of the fighting during this war has occurred during the day.
But this winter may be different for the Ukrainian military.
First, Ukrainian winters are not nearly as cold and snowy as many believe.
Donetsk, for example, has an average temperature of nearly 25 degrees Fahrenheit (-4 degrees Celsius) in January and February.
Its snowiest month, January, averages only 4.9 inches of snow, or .12 meters. Both January and February average just as many rainy days as snowy days – roughly two days of each.
A brief history of Russian attack
Since the invasion began in February 2022, Russia made most of its gains in the first month of the war when it seized Kherson, surrounded Mariupol, and was on the doorsteps of Kyiv and Kharkiv.
But Russia soon gave up on Kyiv and withdrew all its forces from the north.
During this time, Ukraine built up its combat power with new weaponry from the West and planned a large counteroffensive, which it initiated on Aug. 28, 2022.
In the first week of the counteroffensive, Ukraine liberated more territory than Russia had captured in the previous five months.
The success of the counteroffensive showed that Ukraine’s military was superior to Russia’s in every category with the exception of size. It had better doctrine, leaders, strategy, culture and will – and it had just proved that it could effectively fight battles with a combination of artillery, tanks, soldiers and air attacks.
By Sept. 12, 2022, Ukraine had liberated much of Kharkiv Oblast as Russian troops routinely fled from their positions.
After liberating the entirety of Kharkiv Oblast in early October 2022, Ukraine turned its attention to Kherson in the south. This was a different fight, and in some ways Ukraine’s military followed Chinese military strategist Sun Tzu’s axiom of “winning without fighting.”
The Ukrainians were able to conquer much of the territory without using many troops on the ground.
Russia’s best forces have been decimated throughout the conflict, and it is now increasingly relying on untrained conscripts.
Likewise, Russia is exhausting much of its weaponry as international sanctions against them are limiting Russia’s wartime production. Aside from Iran, few nations are providing military aid to Russia.
Russia’s military is now less trained, has lower morale, and has significantly fewer weapons and less ammunition than it had at the beginning of the current war.
As a result, Russia lacks the ability to conduct large-scale attacks, and it is left with little option but to continue what it has been doing: conducting missile strikes against targets that are either defenseless or offer little strategic value.
Limiting Russia’s options further, these strikes have been less effective as the war has progressed.
Winter should not affect these types of combat operations.
But snow will have an impact on Russia’s already stressed and underperforming logistical system, and the cold will further lower – if that is possible – the already low morale of Russia’s poorly outfitted and undertrained soldiers.
What to expect from Ukraine
As the smaller military, Ukraine cannot afford to take heavy losses.
Thus far, it has used a strategy of defending territory when it could, retreating when it should to preserve combat power, and attacking when the opportunities have presented themselves.
An important question must be asked. Why did it take six months for Ukraine to launch its counteroffensive?
One reason is that Ukraine had to wait several months for promised Western aid to arrive at its bases. In my view, a significant factor is the lengthy amount of time it takes to plan large counteroffensives and to position supplies, equipment and forces.
The fact that Ukraine conducted the counterattacks in succession suggests that Ukraine lacks the combat power to conduct two large-scale counterattacks at the same time.
Ukraine is going to need time to regroup, refit and plan for its next large-scale operation.
Thus, it seems reasonable that Ukraine will have to wait at least 30 to 45 days – maybe more – before it is ready to execute its next counteroffensive, which would be in the heart of winter.
While conducting an attack in winter may be difficult, off-road movement in the spring could become impossible, as the Russians discovered during their initial invasion in muddy and wet terrain.
It seems reasonable to conclude that Ukraine may wish to initiate its next counteroffensive while the ground is still frozen – and Russian troop morale is at its lowest point since the invasion.
With inflation on the rise, investor attention has shifted to more tangible assets such as zinc-lead. With a positive relationship with locals and good ESG, Slave Lake Zinc Corp. may be one company you want to add to your radar.
Inflation generally drives smart investors into tangible assets, and few assets are more tangible than ore-bearing ground. Hard to steal and easy to profit from, rich mining claims often provide the perfect, slow-but-steady appreciation to counterbalance the bipolar nature of the equities market.
In-ground zinc-lead, in particular, has become a prized commodity among investors seeking to diversify around the vagaries of commercial exchanges.
Zinc-lead “is among the most important of base metals, constituting an essential requirement of a country’s industrial development,” explained analyst Rick Mills on November 22, 2022. “The two metals keep us powered and sheltered, yet the zinc-lead sector has not seen a major discovery in over two decades, leading to concerns over resource depletion.”
Reporting on November 17, 2022, Echelon Capital Markets stated that BCA Research’s Chief Commodity and Energy Strategist Robert Ryan “noted that risks to the global demand picture have prompted a continued decline in copper prices year-to-date, with inventories at exchanges extending their downtrend prompting expectations for tight supply over the coming decade.”
The report goes on to explain funds raised for base metals increased 17% month-over-month to US$262,000,000 in October on rapidly expanding transaction volume. Currently, zinc is sitting at around US$1.38 per lb and lead at US$0.97, which is quite rich for the metals, and one company, in particular, to keep watch on isSlave Lake Zinc Corp. (SLZ:CSE).
Slave Lake’s name comes from the lake itself, and the company’s large claim lies somewhat south of this eponymous feature of the northern Canadian landscape.
The claim is in an area briefly mined for lead and zinc at the end of the second world war, but the owners at the time halted production after the market for the metals cratered in the 1950s.
American Yellowknife Mines, which operated the mine then, identified 67,950 tons grading 7.64% Zinc, 3.12% lead, 0.13% copper, and 8.22 grams per tonne (8.22 g/pt) silver near the Shaft Zone, an area that includes a headframe and underground drifting of over 400 meters into various smaller pits.
This zone includes drilling down to 200 meters, with complete mineralization found the whole way down. Samples from the pits contained 10% to 27% zinc plus lead. The existing 55-meter deep three-compartment shaft has a drift station at 45 meters providing access to a seam assayed at 55% lead, 13.5% zinc, and 84.4 g/t silver.
Technical analyst Clive Maund opined that “with the company looking set to move forward, the move looks like the beginning of a new uptrend following the tedious downtrend from the highs of last April, and it is viewed as a speculative Buy here.”
Of course, these uses are all somewhat niche compared to the metal’s primary industrial use in the galvanization process. Zinc is important enough that governments in both the U.S. and Canada designate it as a critical material.
Currently, Slave Lake is fully permitted with a has a Type A Land Use permit and Type B Water license to have a 49-person, 3-drill operation to begin with, which allows it to move forward immediately, further de-risking the company’s plans moving forward. Funding-dependent, the company could potentially start drilling tomorrow.
However, as it stands, Slave Lake Zinc Corp. is not producing any materials for sale.
Instead, the company is continuing to expand its claim as it does further geological work to map out the footprint of a large, high-quality hydrothermal formation.
“At this stage, we are highly focused on diminishing risk,” explained Slave Lake Zinc Corp.’s CEO, Ritch Wigham. He’s recently overseen the company’s expansion from a 600-acre claim to one that’s over 18,000 acres or 76.25 sqkm and has been busy acquiring permits and developing a strong “right of first refusal” working relationship with members of the local community.
Positive Relationships and ESG
Slave Lake Zinc Corp. is one of only two companies that have successfully negotiated the multi-year, international process required to allow tribal lands in Canada to revert to Crown ownership and be claimed by commercial producers.
“We can confirm that Slave Lake Zinc and the NWTMN have a positive working relationship, as provided for in the Collaboration Agreement between the NWTMN and Slave Lake Zinc,” explained Dr. Ronald Yaworsky of KHL Consulting, speaking on behalf of the nation itself. “Slave Lake Zinc has been respectful and proactive in [its] engagement
In addition to the considerable goodwill and rich in-ground reserves he has ferreted out, Wigham says the claim’s close proximity (about 37 miles) to the Taltson hydroelectric plant will allow for an ESG-forward, hydrocarbon-free operation once the mine is up and running.
Wigham’s strategy is to continue building the claim’s value by mitigating the risks any processor would face when taking on the site and ramping up to full production.
As it currently stands, Slave Lake Zinc Corp. is a basic buy-and-hold play for those interested in buying unexploited base metal reserves to hedge against either inflation or an equities market downturn. The company plans to start a comprehensive drilling program early next year to quantify in-ground reserves better and explore claim expansion opportunities.
On November 9, 2022, technical analyst Clive Maund opined that “with the company looking set to move forward, the move [up on Nov 8th, 2022] looks like the beginning of a new uptrend following the tedious downtrend from the highs of last April, and it is viewed as a speculative Buy here, and especially on any near-term dips.”
Ownership, Coverage, and Share Structure
Source: Slave Lake Zinc Corp.
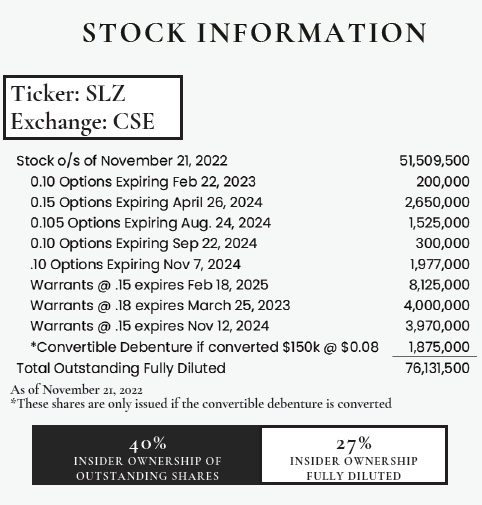
Company management owns approximately 20.8 million shares — 40% of outstanding shares, or 27% on a fully diluted basis. There are no institutional investors on record, and all of the outstanding stock is retail except for the CA$150,000.00 balance of the debenture outstanding.
Technical analyst Clive Maund of Clivemaund.com follows this stock. Click See More Live Data” to view more of what he is saying.
The company has roughly CA$300,000 in the bank and is burning CA$25,000/month at current operating levels.
Slave Lake also has 6,652,000 options in the CA$0.10 to CA$0.15 price range expiring between Feb 22, 2023, and Nov 7, 2024, as well as 16,095,000 warrants ranging from CA$0.15 to CA$0.18 expiring between March 25, 2023, and Feb 18, 2025.
An additional CA$150,000 in CA$0.08 convertible debenture financing adds another 1,875,000 potential claims. The total outstanding fully diluted share count is 76,131,500.
Slave Lake Zinc Corp. has a market cap of around US$3.153 million, with 51,509,500 shares outstanding, and it trades in the 52-week range of US$0.0115 and US$0.1429.
Disclosures: 1) Owen Ferguson wrote this article for Streetwise Reports LLC and provides services to Streetwise Reports as an independent contractor. He or members of his household own securities of the following companies mentioned in the article: None. He or members of his household are paid by the following companies mentioned in this article: None.
2) The following companies mentioned in this article are billboard sponsors of Streetwise Reports: None. Click here for important disclosures about sponsor fees. The information provided above is for informational purposes only and is not a recommendation to buy or sell any security. As of the date of this article, an affiliate of Streetwise Reports has a consulting relationship with Slave Lake Zinc Corp. Please click herefor more information.
3) Statements and opinions expressed are the opinions of the author and not of Streetwise Reports or its officers. The author is wholly responsible for the validity of the statements. The author was not paid by Streetwise Reports for this article. Streetwise Reports was not paid by the author to publish or syndicate this article. Streetwise Reports requires contributing authors to disclose any shareholdings in, or economic relationships with, companies that they write about. Streetwise Reports relies upon the authors to accurately provide this information and Streetwise Reports has no means of verifying its accuracy.
4) This article does not constitute investment advice. Each reader is encouraged to consult with his or her individual financial professional and any action a reader takes as a result of information presented here is his or her own responsibility. By opening this page, each reader accepts and agrees to Streetwise Reports’ terms of use and full legal disclaimer. This article is not a solicitation for investment. Streetwise Reports does not render general or specific investment advice and the information on Streetwise Reports should not be considered a recommendation to buy or sell any security. Streetwise Reports does not endorse or recommend the business, products, services or securities of any company mentioned on Streetwise Reports.
5) From time to time, Streetwise Reports LLC and its directors, officers, employees or members of their families, as well as persons interviewed for articles and interviews on the site, may have a long or short position in securities mentioned. Directors, officers, employees or members of their immediate families are prohibited from making purchases and/or sales of those securities in the open market or otherwise from the time of the decision to publish an article until three business days after the publication of the article. The foregoing prohibition does not apply to articles that in substance only restate previously published company releases. As of the date of this article, officers and/or employees of Streetwise Reports LLC (including members of their household) own securities of Slave Lake Zinc Corp., a company mentioned in this article.
The currency pair completed an impulse of decline to 1.0460. Today a consolidation range is forming around this level. An escape downwards and further decline to 1.0388 is expected. After this level is reached, growth to 1.0460 may begin.
GBPUSD, “Great Britain Pound vs US Dollar”
The currency pair continues developing a wave of decline to 1.2095. After this level is reached, growth to 1.2205 should begin, followed by a decline to 1.2066.
USDJPY, “US Dollar vs Japanese Yen”
The currency pair continues growing to 137.85. After this level is reached, we expect a decline to 135.75, from where the trend might continue to 134.10.
USDCHF, “US Dollar vs Swiss Franc”
The currency pair continues developing the wave of growth to 0.9457. Then a decline to 0.9388 might start, from where the wave might continue to 0.9320.
AUDUSD, “Australian Dollar vs US Dollar”
The currency pair completed a structure of decline to 0.6699. Today the market is forming a consolidation range around this level. With an escape upwards, a pathway for a correction to 0.6755 will open. With an escape downwards, a pathway to 0.6654 will open.
BRENT
Crude oil performed an impulse of decline to 79.00. At the moment, the market is forming a consolidation range above this level. Next, the quotes might escape the range upwards to 83.20, fall to 78.20, and grow again to 84.00, from where the trend may continue to 89.50.
XAUUSD, “Gold vs US Dollar”
Gold is forming a consolidation range around 1773.00. With an escape upwards, a pathway to 1782.00 will open, from where the quotes should decline to 1755.00. With an escape downwards, a pathway directly to 1755.00 should open.
S&P 500
The stock index is forming a consolidation range around 3972.2. An escape downwards and trend continuation to 3862.7 are expected. After this level is reached, a link of correction to 3972.2 is not excluded. Then a decline to 3840.8 is expected.
Attention! Forecasts presented in this section only reflect the author’s private opinion and should not be considered as guidance for trading. RoboForex LP bears no responsibility for trading results based on trading recommendations described in these analytical reviews.
The BTC is being dragged down again. On Wednesday, the leading crypto is declining to 16,827 USD. And while yesterday there was a good chance to return above the resistance level of 17,200 USD, today this scenario just has no reason to be considered realistic.
There is no correlation with the US stock markets, neither there is any connection to the real situation around. The crypto market is in a standby mode.
The risk factor is the same: trust and safety issues. After the epic crash of the FXT exchange and some problems with Genesis, investors tend to doubt everything they see.
Capitalisation of the crypto market today is 837.97 billion USD; the BTC takes up 38.5%, the ETH — 17.9%.
Director general of ICE: crypto must be regulated as securities
Jeffrey Sprecher, director general of ICE, the operator of the NYSE, thinks that cryptocurrencies need to be regulated like securities are. This method would provide optimum protection to clients. Moreover, nothing has to be developed from scratch: all the legislation already exists.
Amber Group: new layoffs
A crypto broker from Hong Kong, the Amber Group, initiated new layoffs again. It had to run to decreasing the financial load and stopped looking for new investors due to the sudden death of its head. It was reported earlier that the company planned to attract 3 billion USD.
Bitwave attracted 15 million USD
The Bitwave platform (Crypto accounting, tax and compliance) gathered 15 million USD in a serious A round of financing. The project needs finance to launch new products, including Bitwave Institutional. It is aimed for helping organisations that store and carry out transactions and use digital assets.
Attention! Forecasts presented in this section only reflect the author’s private opinion and should not be considered as guidance for trading. RoboForex LP bears no responsibility for trading results based on trading recommendations described in these analytical reviews.