At the close of the US stock market yesterday, the Dow Jones Index (US30) increased by 0.40%, and the S&P 500 Index (US500) added 0.75%. The Technology Index NASDAQ (US100) gained 0.69% on Wednesday. All three indices closed the day in positive territory.
The Open Market Committee (FOMC) raised its rate target to a range of 5% to 5.25%. The markets expect the Fed to raise the rate by 0.25% at its next meeting on February 1. The probability of such a scenario is 84%. Goldman Sachs analysts expect three rate hikes of 25 bps in February, March, and May, with a peak funds rate of 5-5.25%.
The ISM Manufacturing Index has long been considered one of the best indicators of the health of the US economy. The December report showed that the manufacturing PMI fell to 48.4 from 49.0. This is the second consecutive month of contraction and the fourth consecutive month below the level of 50. Export orders are down, and new orders are unacceptably low, so there seems little chance of a quick manufacturing recovery.
Equity markets in Europe were mostly up yesterday. Germany’s DAX (DE30) gained 2.18%, France’s CAC 40 (FR40) added 2.30%, Spain’s IBEX 35 (ES35) jumped by 1.89%, and the British FTSE 100 (UK100) closed up by 0.41% on Wednesday.
Consulting firm KPMG predicts that UK real GDP will contract by 1.3% in 2023. KPMG expects the UK Central Bank to raise the bank rate to 4% during the first quarter of this year before taking a pause. The labor market will begin to deteriorate in the first half of 2023, with the unemployment rate reaching 5.6% by mid-2024, meaning an increase of about 680,000 unemployed people. The jump in food and energy prices and higher overall inflation have already reduced the purchasing power of households.
Switzerland’s annual inflation rate has fallen from 3% to 2.8%. Although the inflation rate has declined, this is the highest inflation rate the country has experienced in decades. From 2008 to 2022, the annual average inflation in Switzerland was between 0.6 and 0.7%.
Global growth problems, along with growing COVID-19 problems in China (the biggest oil importer), have caused the price of “black gold” to fall by another 5%. In addition, leading oil exporter Saudi Arabia may further reduce the price of its flagship Arab Light crude to Asia. The US WTI crude decreased by 5.3% to $72.84 a barrel. British benchmark Brent Crude fell by 5.2% to $77.84 a barrel. The total decline in quotes was almost 10% during the last two days. Considering the fact that China increased export quotas for oil products in the first batch for 2023, which indicates the expectations of low domestic demand, oil quotes may fall even more.
Asian indices traded flat yesterday. Japan’s Nikkei 225 (JP225) decreased by 1.45%, China’s FTSE China A50 (CHA50) gained 0.25%, Hong Kong’s Hang Seng (HK50) ended the day up 3.22%, India’s NIFTY 50 (IND50) decreased by 1.04%, and Australia’s S&P/ASX 200 (AU200) ended Wednesday with a 1.63% gain.
The World Health Organization (WHO) criticized China’s definition of COVID-19 deaths and warned that official statistics do not show the true impact of the outbreak. China’s eagerness to move away from a zero-COVID policy is also alarming in the financial markets. Data on Tuesday showed that manufacturing activity in China contracted for the fifth straight month in December.
S&P 500 (F) (US500) 3,852.97 +28.83 (+0.75%)
Dow Jones (US30) 33,269.77 +133.40 (+0.40%)
DAX (DE40) 14,490.78 +309.11 (+2.18%)
FTSE 100 (UK100) 7,585.19 +31.10 (+0.41%)
USD Index 104.24 −0.28 (−0.27%)
Important events for today:
– China Caixin Services PMI (m/m) at 03:45 (GMT+2);
– UK Services PMI (m/m) at 11:30 (GMT+2);
– Italian Consumer Price Index (m/m) at 12:00 (GMT+2);
– US ADP Non-Farm Employment Change (m/m) at 15:15 (GMT+2);
– US Initial Jobless Claims (w/w) at 15:30 (GMT+2);
This article reflects a personal opinion and should not be interpreted as an investment advice, and/or offer, and/or a persistent request for carrying out financial transactions, and/or a guarantee, and/or a forecast of future events.
The GBPUSD on the D1 time frame was in a prolonged uptrend until 14 December when a last higher top was recorded at 1.24454.
A closer look at the Momentum Oscillator reveals a negative divergence between points “a” and “b” when comparing the tops at 1.23435 and 1.24454. This could have warned technical traders that the bullish trend was losing momentum.
After the higher top at 1.24454, the price dropped through the 15 and 34 Simple Moving Averages and the Momentum Oscillator followed suit by moving into bearish terrain. This confirmed that the bears are making their presence felt.
A possible critical support level formed when a lower bottom was recorded on 3 January at 1.18998. The bulls are currently trying to press the price higher but a resistance level that formed on 28 December at 1.21254 might exert its influence on the market.
If the price of GBPUSD breaks through the critical support level at 1.18998, then three possible price targets may be projected from there. Attaching the Fibonacci tool to the lower bottom at 1.18998, and dragging it to the resistance level at 1.21254, the following targets may be anticipated. The first target can be estimated at 1.17604 (161.8%). The second price target may be calculated at 1.15348 (261.8%) and the third and final target can be expected at 1.11698 (423.6%).
If the resistance level at 1.21254 is broken, the above scenario is no longer valid and must be reassessed.
As long as sellers maintain their negative sentiment and supply continues overcoming demand, the outlook for the GBPUSD currency pair will remain bearish.
“The Federal Reserve is forging ahead with its balance sheet reduction”
By Elliott Wave International
I know — inflation has been grabbing all the headlines for a good while now — so you may wonder why the subject of deflation is relevant.
First, the definitions of inflation and deflation go beyond commonly accepted meanings.
As Robert Prechter’s Last Chance to Conquer the Crash says:
Inflation is an increase in the total amount of money and credit, and deflation is a decrease in the total amount of money and credit. …
The most common misunderstanding about inflation and deflation … is the idea that inflation is rising prices and deflation is falling prices. General price changes, though, are simply effects.
That said, let’s start off with an occurrence which is quite rare. Here’s a chart and commentary from the December Elliott Wave Theorist, a monthly publication which covers major financial and cultural trends:
The chart, published by the Fed, shows that absolute M2 has been declining on a month-by-month basis for the first time in many decades, probably since the 1930s or 1940s. This trend is deflationary.
Keep in mind that M2 is a measure of the U.S. money stock that includes M1 (currency and coins held by the non-bank public, checkable deposits, and travelers’ checks) plus savings deposits (including money market deposit accounts), small time deposits under $100,000, and shares in retail money market mutual funds.
Another factor regarding deflation has to do with the Fed.
The November Global Forecast Service, an Elliott Wave International publication which analyzes 50-plus worldwide financial markets, showed this chart and noted:
The Federal Reserve is forging ahead with its balance sheet reduction, as the chart shows. This reduction in the central bank’s assets which were paid for by money created out of thin air constitutes disinflation, and deflation (when the balance sheet is contracting on an annualized basis) will likely come by the end of the year.
So, now you see why deflation is very much on the radar screen of Elliott Wave International’s Global Forecast Service, which can help you to prepare for what may be next.
Understanding the Elliott wave price patterns of global stock market indexes can also be of help in anticipating what’s next for major economies around the globe.
You see, the economy tends to follow the stock market, in each country.
Getting back to the Wave Principle, here are some insights from Frost & Prechter’s book, Elliott Wave Principle: Key to Market Behavior:
The Wave Principle is governed by man’s social nature, and since he has such a nature, its expression generates forms. As the forms are repetitive, they have predictive value.
Sometimes the market appears to reflect outside conditions and events, but at other times it is entirely detached from what most people assume are causal conditions. The reason is that the market has a law of its own. It is not propelled by the external causality to which one becomes accustomed in the everyday experiences of life. The path of prices is not a product of news. Nor is the market the cyclically rhythmic machine that some declare it to be. Its movement reflects a repetition of forms that is independent both of presumed causal events and of periodicity.
The market’s progression unfolds in waves. Waves are patterns of directional movement.
Would you like to read the entire online version of this Wall Street classic — for free?
You may do so once you become a member of Club EWI, the world’s largest Elliott wave educational community.
A Club EWI membership is also free (no obligations whatsoever) and allows for complimentary access to a wealth of Elliott wave resources on investing and trading.
This article was syndicated by Elliott Wave International and was originally published under the headline Why the Threat of Deflation is Real. EWI is the world’s largest market forecasting firm. Its staff of full-time analysts led by Chartered Market Technician Robert Prechter provides 24-hour-a-day market analysis to institutional and private investors around the world.
Meta Materials Inc. wins an innovation award at the Consumer Electronics Show and shows off its tech giving a clearer view of the contents of your microwave.
Another new year means another chance for the tech industry to show off at the Consumer Electronics Show.
META was named a CES 2023 Innovation Awards Honoree for the NANOWEB® transparent EMI shielding film, which promises to make it easier to tell when your leftovers are ready in the microwave by clearing up the radiation shielding used on the window.
The technology is also used to de-ice auto sensors and manufacture antennas and electrochromic lenses for augmented reality and 5G reflector films.
The company will also demonstrate its electric vehicle (EV)-related products, like its NPORE® nanocomposite ceramic battery separator and current collectors, to reduce copper usage and improve safety at the show.
It promises to be a busy year for the company, analyst Graham Mattison of Water Tower Research wrote.
It promises to be a busy year for the company, analyst Graham Mattison of Water Tower Research wrote in a Dec. 19 research note.
“We expect that META will announce at least one production contract this year, delivering a major milestone in the company’s growth of commercial revenues,” Mattison wrote. “While META has yet to announce anything, we see NANOWEB® as the likely technology to be commercially incorporated into a product.”
The Catalyst: NANOWEB®
Source: META Materials Inc.
But it’s the microwave application of the technology that may attract crowds for META in Las Vegas. Mattison said an estimated 70 million microwaves are sold every year.
“All microwave ovens produce radiation, which is why windows within their doors have significant shielding,” wrote ROTH Capital Partners analyst Gerry Sweeney in a research note.
“But this also obscures visibility into the oven. MMAT EMI shielding uses nanostructures to divert radiation waves back into the oven, allowing for a clear window. Furthermore, initial testing indicates lower amounts of radiation escape. Initial testing, results, and NANOWEB® line production likely open the door to increasing conversations with OEMs in coming quarters.”
ROTH has a Buy rating on META with a target of US$2.
“META is at the early stage of what we expect will be a significant growth curve as its technologies are incorporated into many of today’s products in a range of industries,” Mattison wrote.
“The company’s growing portfolio of technologies, along with its production capabilities, partnerships, and deep patent portfolio, give META a competitive advantage as it works to penetrate addressable markets that are collectively well in excess of US$50 billion.”
META’s total revenue grew year-over-year (YOY) in the third quarter by 329% to US$2.5 million and 388% to US$8.8 million over the first nine months versus the same period in 2021.
But operating expenses also doubled YOY to US$23.9 million following several important acquisitions, analyst MacMurray Whale of Cormark Securities pointed out.
The company’s Q3 net loss increased to US$24.5 million, or US$0.07 per share, on 362.2 million weighted average shares, compared to US$11.4 million, or US$0.04 per share, on 280 million weighted average shares in Q3 2021.
But operating expenses also doubled YOY to US$23.9 million following several important acquisitions, analyst MacMurray Whale of Cormark Securities pointed out.
“MMAT has many early-stage projects across a number of different verticals, most of which have not entered into commercial-scale production,” he wrote.
Hundreds of Patents
Metamaterials were first developed in the 1960s but only came into their own in the 2000s, when design and manufacturing capabilities caught up to the technology. The company is using them to develop nanotechnology products like self-deicing and defogging car and truck headlights and windows, see-through antennas, augmented reality glasses that look like regular glasses, and special eyewear that protects pilots’ eyes from laser strikes.
META is applying its futuristic technology to the communications, health and wellness, aerospace, automotive, and clean energy sectors.
ROTH has a Buy rating on META with a target of US$2.
The company has 472 active patent documents, of which 292 patents have been granted across all its technologies.
“META has been innovating over the last ten years,” President, Chief Executive Officer, and founder George Palikaras said in a video on META’s website. “We start with the design using computer algorithms that design the functions of the designed material . . . We can use a single computer with a single engineer and reduce the time to designing and innovating in the material space from six months down to a few hours.”
He said that reduces costs and makes META “a preferred partner and a preferred developer that enables a wide range of applications in the industry.”
Its NANOWEB® product is the “most transparent and conductive film available today on the market,” Palikaras said.
The global market for lithium-ion battery separators was estimated at US$5.1 billion in 2021 and is projected to reach US$9 billion by 2025, Yano Research Institute Ltd. said.
META also was granted U.S. patents for its second-generation NPORE® nanoporous ceramic separator and its third-generation NPORE® ECS (electrode-coated separator) for lithium-ion batteries.
The global market for lithium-ion battery separators was estimated at US$5.1 billion in 2021 and is projected to reach US$9 billion by 2025, Yano Research Institute Ltd. said.
META also has entered a memo of understanding with DuPont Teijin Films and Mitsubishi Electric Europe to use Meta’s PLASMAfusion to scale a high-volume manufacturing system for film-based, coated copper current collectors. The process reduces the amount of the red metal needed for EV batteries.
Ownership and Share Structure
Major shareholders include Thomas Gordon Welch, with 6.64% or 24 million shares; Anne Barber Lambert, with 6.39% or 23.14 million shares; Lamda Guard Technologies Ltd., with 6.35% or 22.98 million shares; Nova Scotia Innovation Corp., with 3.45% or 12.5 million shares; and Georgios Palikaras, with 1.92% or 6.96 million shares. About 14% of META is held institutionally held.
The stock is covered by numerous analysts, including SingularResearch’s Christopher J. Sakai, ROTH Capital Partners’ Gerry Sweeney, as well as Cormark Securities’ MacMurray Whale, and newsletter writer Clive Maund of Clivemaund.com. Click “See More Live Data” in the data box above to review more.
The company has a market cap of $419.84 million with 361.9 million shares outstanding, 267 million of them free-floating. It trades in a 52-week range of US$2.95 and US$0.63.
Disclosures: 1) Steve Sobek wrote this article for Streetwise Reports LLC. He or members of his household own securities of the following companies mentioned in the article: None. He or members of his household are paid by the following companies mentioned in this article: None. His/her company has a financial relationship with the following companies referred to in this article: None.
2) The following companies mentioned in this article are billboard sponsors of Streetwise Reports: Meta Materials Inc. Click here for important disclosures about sponsor fees. The information provided above is for informational purposes only and is not a recommendation to buy or sell any security.
3) The article does not constitute investment advice. Each reader is encouraged to consult with his or her individual financial professional and any action a reader takes as a result of information presented here is his or her own responsibility. By opening this page, each reader accepts and agrees to Streetwise Reports’ terms of use and full legal disclaimer. This article is not a solicitation for investment. Streetwise Reports does not render general or specific investment advice and the information on Streetwise Reports should not be considered a recommendation to buy or sell any security. Streetwise Reports does not endorse or recommend the business, products, services or securities of any company mentioned on Streetwise Reports.
4) From time to time, Streetwise Reports LLC and its directors, officers, employees or members of their families, as well as persons interviewed for articles and interviews on the site, may have a long or short position in securities mentioned. Directors, officers, employees or members of their immediate families are prohibited from making purchases and/or sales of those securities in the open market or otherwise from the time of the decision to publish an article until three business days after the publication of the article. The foregoing prohibition does not apply to articles that in substance only restate previously published company releases. As of the date of this article, officers and/or employees of Streetwise Reports LLC (including members of their household) own securities of Meta Materials Inc., a company mentioned in this article.
Preliminary data showed that inflation in Germany slowed to an annualized rate of 8.6% in December from 10% as one-time government payments came into effect to help consumers pay their heating and gas bills. In recent months, many German unions have successfully advocated above-average wage increases to offset the impact of inflation. Meanwhile, unemployment rates in Europe’s largest economy rose slightly in December to 2.45 million, or 5.5%.
Trading recommendations
Support levels: 1.0528, 1.0483, 1.0361, 1.0332, 1.0284, 1.0193
Resistance levels: 1.0612, 1.0664, 1.0695
The EUR/USD currency pair trend on the hourly time frame is still bullish. The price is still trading in a wide price corridor. The MACD indicator has become negative. Volatility remains low. Under such market conditions, buy trades are best considered from the support level of 1.0638 on intraday time frames. Sell deals can be considered from the resistance level of 1.0689, but better with confirmation in the form of a reverse initiative or a false breakout since the level has already been tested.
Alternative scenario: if the price breaks down through the support level of 1.0549 and fixes below it, the downtrend will likely resume.
News feed for 2023.01.04:
– French Consumer Price index (m/m) at 09:45 (GMT+2);
– Spanish Services PMI (m/m) at 10:00 (GMT+2);
– Italian Services PMI (m/m) at 10:45 (GMT+2);
– French Services PMI (m/m) at 10:50 (GMT+2);
– Germany Services PMI (m/m) at 10:55 (GMT+2);
– Eurozone Services PMI (m/m) at 11:00 (GMT+2);
– US ISM Manufacturing PMI (m/m) at 17:00 (GMT+2);
– US JOLTs Job Openings (m/m) at 17:00 (GMT+2);
– US FOMC minutes at 21:00 (GMT+2).
The GBP/USD currency pair
Technical indicators of the currency pair:
Prev Open: 1.2042
Prev Close: 1.1966
% chg. over the last day: -0.64 %
The UK manufacturing sector ended 2022 on a weak footing, with output, new orders, and employment declining faster. Domestic and foreign demand remained lackluster as customers faced rising costs, increased market volatility, and Brexit-related complications. The seasonally adjusted Purchasing Managers’ Index for the UK manufacturing sector fell to a 31-month low of 45.3 in December, down from 46.5 in November. The PMI has remained below the neutral 50.0 mark for five months in a row. All five PMI sub-indices point to a weakening operating environment for the UK manufacturing economy.
From the technical point of view, the trend on the GBP/USD currency pair on the hourly time frame is bearish. The MACD indicator is in the negative zone, but there is a divergence on several timeframes, indicating a limited further decline. Under such market conditions, buy trades are better to look for on intraday time frames from the support level of 1.1893, but with confirmation. Sell trades are best sought from the resistance level of 1.2056 but also better with confirmation.
Alternative scenario: if the price breaks out through the 1.2100 resistance level and fixes above it, the uptrend will likely resume.
There is no news feed for today.
The USD/JPY currency pair
Technical indicators of the currency pair:
Prev Open: 130.77
Prev Close: 130.97
% chg. over the last day: +0.16 %
The Japanese yen rose to a seven-month high against the US dollar on Tuesday, crossing the 130 mark. The strengthening of the yen was triggered by the Bank of Japan’s (BOJ) decision to loosen control over the yield curve and allow holders of certain government bonds to move within a wider range. The US Federal Reserve and other central banks are seeking to slow the pace of interest rate hikes, while the BOJ will only begin to move toward policy normalization this year. Analysts believe the first half of 2023 may pass under the strengthening of the Japanese yen.
From the technical point of view, the medium-term trend on the currency pair USD/JPY is bearish. The price is now trading at the level of the moving averages, while the MACD indicator has become inactive, but the divergence on several time frames indicates that further decline is limited. Buy trades are best considered on intraday time frames from the support level of 129.65, but only with confirmation. Sell deals be looked at from the resistance level of 132.92, provided there is a reversal.
Alternative scenario: If the price fixes above 133.58, the uptrend will likely resume.
News feed for 2023.01.04:
– Japan Manufacturing PMI (m/m) at 02:30 (GMT+2).
The USD/CAD currency pair
Technical indicators of the currency pair:
Prev Open: 1.3569
Prev Close: 1.3668
% chg. over the last day: +0.72 %
Canada’s manufacturing economy remains in a moderate contraction zone, characterized by further declines in production, new orders, and buying activity. The seasonally adjusted Manufacturing PMI registered 49.2 in December, down from 49.6 in November and below the 50.0 mark for the fifth consecutive month. This is the longest decline since August 2015. The main reason for the decline is a drop in new orders due to continuing high inflation and uncertainty in sales.
Trading recommendations
Support levels: 1.3627, 1.3570, 1.3530, 1.3437, 1.3386, 1.3360, 1.3281, 1.3212
Resistance levels: 1.3700, 1.3776, 1.3855
From the point of view of technical analysis, the trend on the USD/CAD currency pair is bullish. The price is trading above the moving averages and forming provocation zones along the move, which do not allow the price to go down. The MACD indicator is in the positive zone. Within the day, buying prevails. Buy trades should be considered from the support at 1.3570, but with confirmation. Sell deals are better to look for on the intraday time frames from the resistance level of 1.3700, but with a confirmation in the form of a reverse initiative on the lower time frames or a false breakout, since the level has already been tested.
Alternative scenario: if the price breaks down and consolidates below the support level of 1.3529, the downtrend will likely resume.
This article reflects a personal opinion and should not be interpreted as an investment advice, and/or offer, and/or a persistent request for carrying out financial transactions, and/or a guarantee, and/or a forecast of future events.
As the stock market closed yesterday, the Dow Jones Index (US30) decreased by 0.04%, and the S&P 500 Index (US500) fell by 0.41%. The Technology Index NASDAQ (US100) lost 0.76% on Tuesday. At the end of the day, all three indices closed with losses.
Apple (AAPL) lost more than 4%, approaching a $2 trillion market value for the first time since 2021. Shares of electric carmaker Tesla Inc (TSLA) fell more than 13% Tuesday after the company reported lower-than-expected deliveries for the quarter and year.
The US stocks ended 2022 with their worst performance since 2008, as interest rates rose throughout the year, putting pressure on once-high growth rates and shares of large tech companies.
In the United States, this week’s focus will be on Friday’s US Nonfarm Payrolls report for December. The jobs report is crucial as the Federal Reserve faces the dilemma of whether to continue tightening monetary policy to bring inflation to desired levels or to abandon aggressive rate hikes to protect the economy from slowing. Higher inflation and rising interest rates have hit the housing sector and could next hit the labor market.
The FOMC minutes will also be released today. Given Powell’s hawkish tone after the last meeting and the general market expectation that the Fed will now level rates, there is speculation that the minutes may be more dovish this time. The market is currently pricing in a final rate below 5.0%, while the Fed is pushing for a final rate above 5.0%.
Equity markets in Europe were mostly up yesterday. Germany’s DAX (DE30) gained 0.80%, France’s CAC 40 (FR40) added 0.44%, Spain’s IBEX 35 (ES35) jumped by 0.42%, Britain’s FTSE 100 (UK100) closed Tuesday in plus 1.37%.
European Central Bank Governing Council spokesman Martins Kazaks expects interest rates to rise significantly in February and March 2023. We are talking about a 0.5% ECB rate hike at each of the meetings. Kazaks, who heads Latvia’s Central Bank, is considered one of the hawkish officials.
Oil starts in 2023 with declining 4%. The US West Texas Intermediate (WTI) crude for February delivery fell by 4.1% to $76.93 a barrel. Brent Crude oil of British origin for delivery in February dropped by 4.4% to $82.10 per barrel. Decreasing activity at factories in China (the biggest oil importer) and IMF warnings about global recession put pressure on oil quotes. The outlook for crude oil remains very uncertain, so high volatility will persist.
Gold showed a strong start in the new year as concerns about an impending recession and a potential slowdown in US interest rates led to increased demand for safe-haven assets other than the dollar.
Asian indices traded flat yesterday. Japan’s Nikkei 225 (JP225) did not trade yesterday, China’s FTSE China A50 (CHA50) fell by 0.69%, Hong Kong’s Hang Seng (HK50) ended the day up by 1.84%, India’s NIFTY 50 (IND50) added 0.19%, and Australia’s S&P/ASX 200 (AU200) ended Tuesday with a minus 1.31%.
China’s repeal of strict antivirus controls last month caused COVID-19 to spread to 1.4 billion people. Funeral companies are reporting a surge in demand for their services, and international health experts are predicting that at least a million people in China will die from COVID-19 this year. But officially, China reports few COVID-19 deaths and downplays concerns about the disease.
S&P 500 (F) (US500) 3,823.95 −15.55 (−0.41%)
Dow Jones (US30) 33,134.79 −12.46 (−0.038%)
DAX (DE40) 14,181.67 +112.41 (+0.80%)
FTSE 100 (UK100) 7,554.09 +102.35 (+1.37%)
USD Index 104.61 +1.09 (+1.05%)
Important events for today:
– Japan Manufacturing PMI (m/m) at 02:30 (GMT+2);
– Switzerland Consumer Price index (m/m) at 09:30 (GMT+2);
– French Consumer Price index (m/m) at 09:45 (GMT+2);
– Spanish Services PMI (m/m) at 10:00 (GMT+2);
– Italian Services PMI (m/m) at 10:45 (GMT+2);
– French Services PMI (m/m) at 10:50 (GMT+2);
– Germany Services PMI (m/m) at 10:55 (GMT+2);
– Eurozone Services PMI (m/m) at 11:00 (GMT+2);
– US ISM Manufacturing PMI (m/m) at 17:00 (GMT+2);
This article reflects a personal opinion and should not be interpreted as an investment advice, and/or offer, and/or a persistent request for carrying out financial transactions, and/or a guarantee, and/or a forecast of future events.
The ECB is expected to go against the trend of most other major central banks early this year and continue its aggressive pace of rate hikes, even though inflationary pressures across Europe are forecast to ease this week. The ECB was the last of the big central banks to start raising rates, which means Europe’s Central Bank has more “room” to continue tightening. Moreover, the index of business activity in the manufacturing sector indicates that the European industry has already adapted to high prices, the recession in manufacturing activity in the euro area is probably over, and supply chains are recovering.
Trading recommendations
Support levels: 1.0638, 1.0589, 1.0483, 1.0361, 1.0332, 1.0284, 1.0193
Resistance levels: 1.0689
The EUR/USD currency pair trend on the hourly time frame is still bullish. The price is still trading in a wide price corridor. The MACD indicator has become negative. Volatility remains low. Under such market conditions, buy trades are best considered from the support level of 1.0638 on intraday time frames. Sell deals can be considered from the resistance level of 1.0689, but better with confirmation in the form of a reverse initiative or a false breakout since the level has already been tested.
Alternative scenario: if the price breaks down through the support level of 1.0549 and fixes below it, the downtrend will likely resume.
News feed for 2023.01.02:
– German Unemployment Rate (m/m) at 10:55 (GMT+2);
– German Consumer Price index (m/m) at 15:00 (GMT+2);
– US Manufacturing PMI (m/m) at 16:45 (GMT+2).
The GBP/USD currency pair
Technical indicators of the currency pair:
Prev Open: 1.2061
Prev Close: 1.2044
% chg. over the last day: -0.14 %
The Bank of England is expected to start slowing the pace of rate hikes as inflation declines, as UK economic indicators point to a recessionary scenario. The Resolution Foundation has warned that the cost-of-living crisis, which has led to a sharp drop in living standards, will continue into the new year. Income is expected to fall another 3.8%, and households will continue to struggle with soaring energy prices and tax increases.
Trading recommendations
Support levels: 1.2057, 1.1999, 1.1979, 1.1684, 1.1476, 1.1418
From the technical point of view, the trend on the GBP/USD currency pair on the hourly time frame is bearish. The MACD indicator has become inactive, and the price is trading in a narrow price corridor, but there are signs of buying strength inside the day. Under such market conditions, it is better to look for buy trades on intraday time frames from the support level of 1.2057, but with confirmation. Sell trades are best sought from the resistance level of 1.2167 but also better with confirmation.
Alternative scenario: if the price breaks out through the 1.2308 resistance level and fixes above it, the uptrend will likely resume.
News feed for 2023.01.03:
– UK Manufacturing PMI (m/m) at 11:30 (GMT+2).
The USD/JPY currency pair
Technical indicators of the currency pair:
Prev Open: 130.91
Prev Close: 130.61
% chg. over the last day: -0.23 %
The Japanese yen has strengthened by about 16% from its October low amid Bank of Japan intervention, as well as hopes of a slowdown in US interest rate hikes and speculation about possible Bank of Japan policy changes this year. The Bank of Japan’s unexpected December decision to change the parameters for managing the yield curve is still seen by many as a sign that ultra-easy monetary policy may soon come to an end. But traders should not expect any changes before the spring of 2023.
From the technical point of view, the medium-term trend on the currency pair USD/JPY is bearish. The price is now trading below the moving averages, while the MACD indicator is in the negative zone, but there is a divergence. There is selling pressure inside the day. Buy trades are best considered on intraday time frames from support at 129.65, but only with confirmation. Sell deals can be sought from the resistance level of 131.22, provided there is a reversal.
Alternative scenario: If the price fixes above 133.58, the uptrend will likely resume.
There is no news feed for today.
The USD/CAD currency pair
Technical indicators of the currency pair:
Prev Open: 1.3550
Prev Close: 1.3570
% chg. over the last day: +0.14 %
The USD/CAD currency pair gained 7% over 2022 primarily due to the US Federal Reserve’s tightening of monetary policy, which led to a 7.61% rise in the dollar index. WTI crude oil price rose by 4.57% over the year, which helped keep the Canadian dollar from plummeting. It should also be noted that the Bank of Canada was one of the first to begin tightening monetary policy but did it less aggressively than the US Fed, so now the US Fed rate (4.5%) is slightly higher than the Bank of Canada rate (4.25%). The Bank of Canada is projected to schedule another 0.25% rate hike in January and then keep rates at 4.5% through the end of 2023. With the US Fed starting to slow the rate hikes and Canada’s economic outlook now more optimistic, this could play for the Canadian currency’s strength in the first half of 2023.
Trading recommendations
Support levels: 1.3437, 1.3386, 1.3360, 1.3281, 1.3212
From the point of view of technical analysis, the trend on the USD/CAD currency pair is still bullish. The price forms a wide price corridor. The MACD indicator is in the positive zone, but sales prevail during the day. Buy trades should be considered from the support level of 1.3537, but with confirmation. Sell deals are best to look for on intraday time frames from the resistance level of 1.3583, but with confirmation in the form of reverse initiative on the lower time frames.
Alternative scenario: if the price breaks down and consolidates below the support level of 1.3529, the downtrend will likely resume.
News feed for 2023.01.03:
– OPEC+ Meeting (m/m) at 12:00 (GMT+2);
– Canada Manufacturing PMI (m/m) at 16:30 (GMT+2).
This article reflects a personal opinion and should not be interpreted as an investment advice, and/or offer, and/or a persistent request for carrying out financial transactions, and/or a guarantee, and/or a forecast of future events.
The transformational acquisition of interests in various oilfield-holding licenses is expected to generate “substantial free cash flow,” noted a Research Capital Corp. report.
Valeura Energy Inc. (VLE:TSX; PNWRF:OTCMKTS) will acquire offshore oil assets in the Gulf of Thailand, “a transformational action that provides a huge boost to cash flow,” reported Research Capital Corp. analyst Bill Newman in a Dec. 6 research note.
To reflect the deal, Research Capital increased its target price on the Canadian oil and gas company to CA$8.25 per share from CA$1.45, its current share price. From here, the target represents a possible 469% return for investors.
“We expect the assets will generate substantial free cash flow to fund development and appraisal projects to extend the life of the reserves, help to fund the company’s other Thailand assets, and provide capital for additional acquisitions,” wrote Newman.
Research Capital Corp. maintains its Speculative Buy rating on Valeura.
Valeura’s management team forecasts 2023 pretax annual cash flow of US$360 million (US$360M) from the new assets, Newman noted; Research Capital estimates funds flow forecast next year to be US$206M.
The three assets Valeura is to acquire, relayed Newman, are:
an operated 100% interest in the B5/27 license holding the Jasmine and Ban Yen oilfields
an operated 90% working interest in the G11/48 license holding the Nong Yao oilfield
a 70% interest in the G1/48 license holding the Manora oilfield
Newman noted these concessions have a current combined net oil production of about 21,200 barrels per day.
“The oilfields are midlife to mature assets but with additional development opportunities that can significantly extend the life,” he added.
For the acquisition, Valeura will pay US$10.4M in cash plus a possible maximum contingent payment of US$50M, due only if oil prices are high. Specifically, this payment is based on average oil prices in 2022, 2023, and 2024 and kicks in when the Dubai benchmark average exceeds US$100 per barrel. The Calgary, Alberta-based company will make the purchase through Valeura Energy Asia Pte. Ltd., a subsidiary and special purpose vehicle.
“In our conservative scenario, which includes the max contingent payment and our estimated discounted decommission costs of US$168.4M, the transaction metrics remain compelling at US$9.47 per barrel and $10,774 per flowing barrel,” Newman highlighted.
Research Capital Corp. maintains its Speculative Buy rating on Valeura.
Disclosures: 1) Doresa Banning wrote this article for Streetwise Reports LLC and provides services to Streetwise Reports as an independent contractor. She or members of her household own securities of the following companies mentioned in the article: None. She or members of her household are paid by the following companies mentioned in this article: None.
2) The following companies mentioned in this article are billboard sponsors of Streetwise Reports: None. Click here for important disclosures about sponsor fees. The information provided above is for informational purposes only and is not a recommendation to buy or sell any security.
3) Statements and opinions expressed are the opinions of the author and not of Streetwise Reports or its officers. The author is wholly responsible for the validity of the statements. The author was not paid by Streetwise Reports for this article. Streetwise Reports was not paid by the author to publish or syndicate this article. Streetwise Reports requires contributing authors to disclose any shareholdings in, or economic relationships with, companies that they write about. Streetwise Reports relies upon the authors to accurately provide this information and Streetwise Reports has no means of verifying its accuracy.
4) This article does not constitute investment advice. Each reader is encouraged to consult with his or her individual financial professional and any action a reader takes as a result of information presented here is his or her own responsibility. By opening this page, each reader accepts and agrees to Streetwise Reports’ terms of use and full legal disclaimer. This article is not a solicitation for investment. Streetwise Reports does not render general or specific investment advice and the information on Streetwise Reports should not be considered a recommendation to buy or sell any security. Streetwise Reports does not endorse or recommend the business, products, services or securities of any company mentioned on Streetwise Reports.
5) From time to time, Streetwise Reports LLC and its directors, officers, employees or members of their families, as well as persons interviewed for articles and interviews on the site, may have a long or short position in securities mentioned. Directors, officers, employees or members of their immediate families are prohibited from making purchases and/or sales of those securities in the open market or otherwise from the time of the decision to publish an article until three business days after the publication of the article. The foregoing prohibition does not apply to articles that in substance only restate previously published company releases.
Disclosures For Research Capital Corp., Valeura Energy Inc.
Analyst Certification: I, Bill Newman, CFA, certify the views expressed in this report were formed by my review of relevant company data and industry investigation, and accurately reflect my opinion about the investment merits of the securities mentioned in the report. I also certify that my compensation is not related to specific recommendations or views expressed in this report. Research Capital Corporation publishes research and investment recommendations for the use of its clients. Information regarding our categories of recommendations, quarterly summaries of the percentage of our recommendations which fall into each category and our policies regarding the release of our research reports is available at www.researchcapital.com or may be requested by contacting the analyst. Each analyst of Research Capital Corporation whose name appears in this report hereby certifies that (i) the recommendations and opinions expressed in this research report accurately reflect the analyst’s personal views and (ii) no part of the research analyst’s compensation was or will be directly or indirectly related to the specific conclusions or recommendations expressed in this research report.
General Disclosures: The opinions, estimates and projections contained in all Research Reports published by Research Capital Corporation (“RCC”) are those of RCC as of the date of publication and are subject to change without notice. RCC makes every effort to ensure that the contents have been compiled or derived from sources believed to be reliable and that contain information and opinions that are accurate and complete; RCC makes no representation or warranty, express or implied, in respect thereof, takes no responsibility for any errors and omissions which may be contained therein and accepts no liability whatsoever for any loss arising from any use of or reliance on its Research Reports or its contents. Information may be available to RCC that is not contained therein. Research Reports disseminated by RCC are not a solicitation to buy or sell. All securities not available in all jurisdictions.
Potential Conflicts of Interest: All Research Capital Corporation (“RCC”) Analysts are compensated based in part on the overall revenues of RCC, a portion of which are generated by investment banking activities. RCC may have had, or seek to have, an investment banking relationship with companies mentioned in this report. RCC and/or its officers, directors and employees may from time to time acquire, hold or sell securities mentioned in our Research Reports as principal or agent. RCC makes every effort possible to avoid conflicts of interest, however readers should assume that a conflict might exist, and therefore not rely solely on this report when evaluating whether or not to buy or sell the securities of subject companies.
RCC USA: Information about Research Capital Corporation’s Rating System, the distribution of our research to clients and the percentage of recommendations which are in each of our rating categories is available on our website at www.researchcapital.ca. The information contained in this report has been drawn from sources believed to be reliable but its accuracy or completeness is not guaranteed, nor in providing it does Research Capital Corporation assume any responsibility or liability. Research Capital Corporation, its directors, officers and other employees may, from time to time, have positions in the securities mentioned herein. Contents of this report cannot be reproduced in whole or in part without the express permission of Research Capital Corporation. US Institutional Clients – Research Capital USA Inc., a wholly owned subsidiary of Research Capital Corporation, accepts responsibility for the contents of this report subject to the terms and limitations set out above. US firms or institutions receiving this report should effect transactions in securities discussed in the report through Research Capital USA Inc., a Broker – Dealer registered with the Financial Industry Regulatory Authority (FINRA).
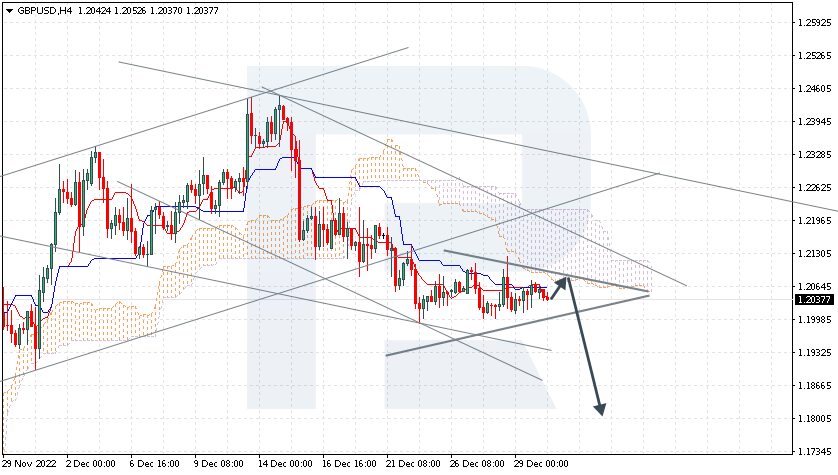
The currency pair is correcting by a Triangle pattern. The pair is going under the Ichimoku Cloud, which indicates prevalence of a downtrend. A test of the lower border of the Cloud is expected at 1.2065, followed by falling to 1.1805. An additional signal confirming the decline will be a bounce off the upper border of the Triangle pattern. The scenario can be cancelled by a breakaway of the upper border of the Cloud and securing above 1.2265, which will mean further growth to 1.2355. The decline can be confirmed by a breakaway of the lower border of the Triangle pattern and securing under 1.1975.
XAUUSD, “Gold vs US Dollar”
Gold is testing the resistance level. The instrument is going above the Ichimoku Cloud, which indicates an uptrend. A test of the lower border of the Cloud is expected at 1805, followed by growth to 1860. An additional signal confirming the growth will be a bounce off the lower border of the bullish channel. The scenario can be cancelled by a breakaway of the lower border of the Cloud and securing under 1790, which will mean further falling to 1755.
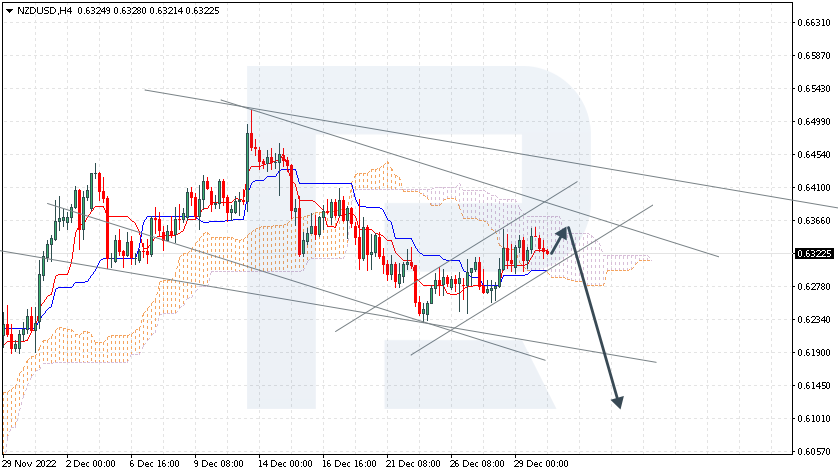
NZDUSD, “New Zealand Dollar vs US Dollar”
The currency pair is declining in a bullish correction channel. The instrument is going inside the Ichimoku Cloud, which means a flat. A test of the upper border of the Cloud at 0.6355 is expected, followed by falling to 0.6105. An signal confirming the decline will be a bounce off the upper border of the descending channel. The scenario can be cancelled by a breakaway of the upper border of the Cloud and securing above 0.6405, which will mean further growth to 0.6505. The decline can be confirmed by a breakaway of the lower border of the bullish channel and securing under 0.6270.
Attention! Forecasts presented in this section only reflect the author’s private opinion and should not be considered as guidance for trading. RoboForex LP bears no responsibility for trading results based on trading recommendations described in these analytical reviews.
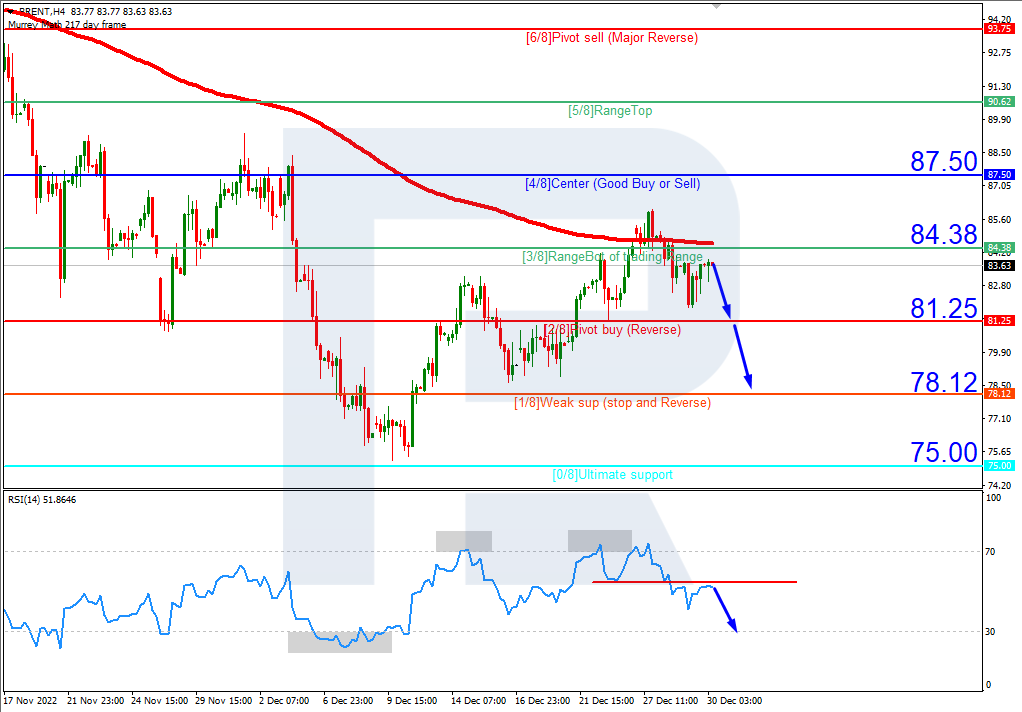
On H4, Brent quotes are under the 200-day Moving Average, which indicates prevalence of a downtrend. The RSI is testing the resistance line. A test of 2/8 (81.25) should be expected, followed by a breakaway and falling to the support level of 1/8 (78.12). The scenario can be cancelled by rising over the resistance level of 3/8 (84.38), which might lead to a trend reversal and growth of the quotes to the resistance level of 4/8 (87.50).
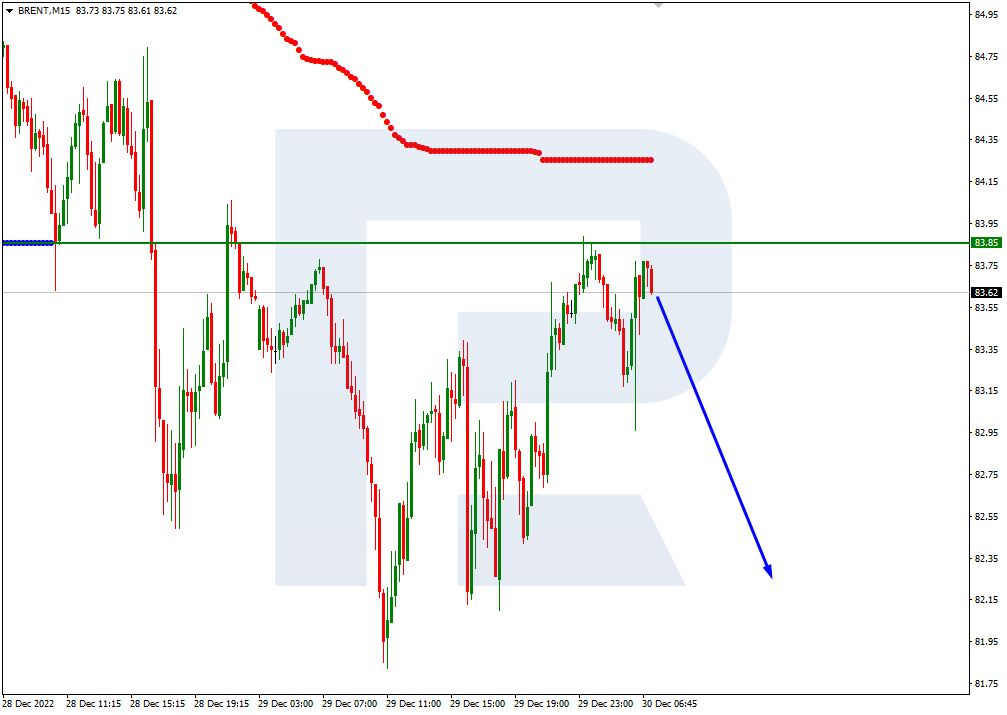
On M15, the lower line of VoltyChannel is broken away, which confirms the downtrend and increases the probability of further falling.
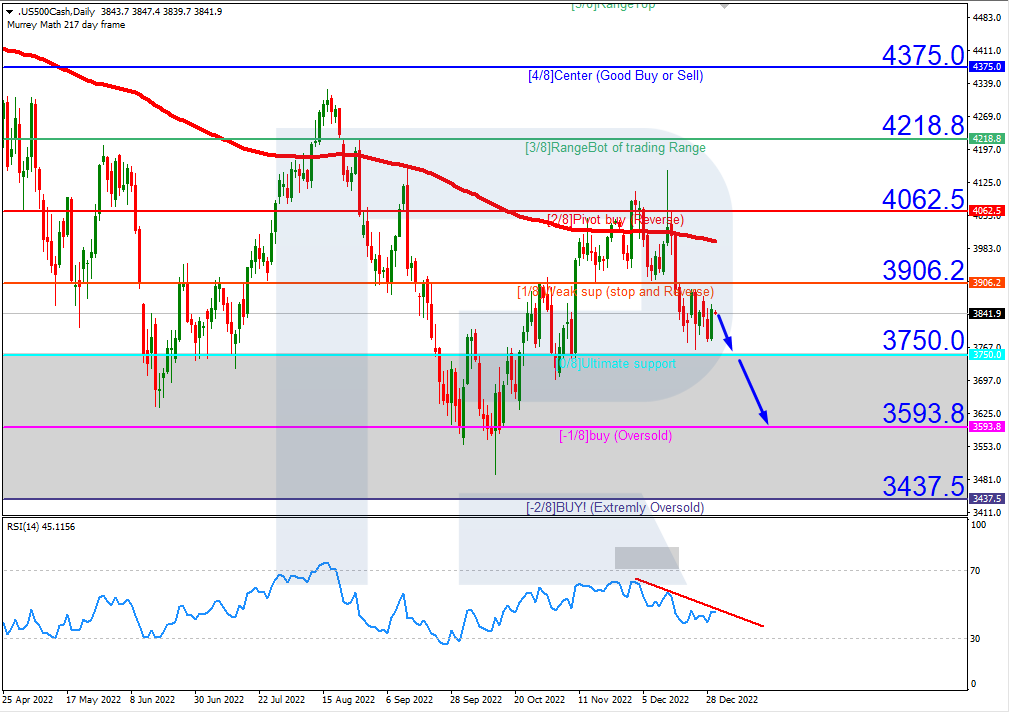
S&P 500
On H4, the quotes are under the 200-day Moving Average, which indicates prevalence of a downtrend. The RSI is testing the descending trendline that acts as a resistance level for the price. As a result, a breakaway of 0/8 (3750.0) is expected, followed by falling to the support level of -1/8 (3593.8). The scenario can be cancelled by rising over the resistance level of 1/8 (3906.2). In this case, the S&P 500 index may rise to 2/8 (4062.5).
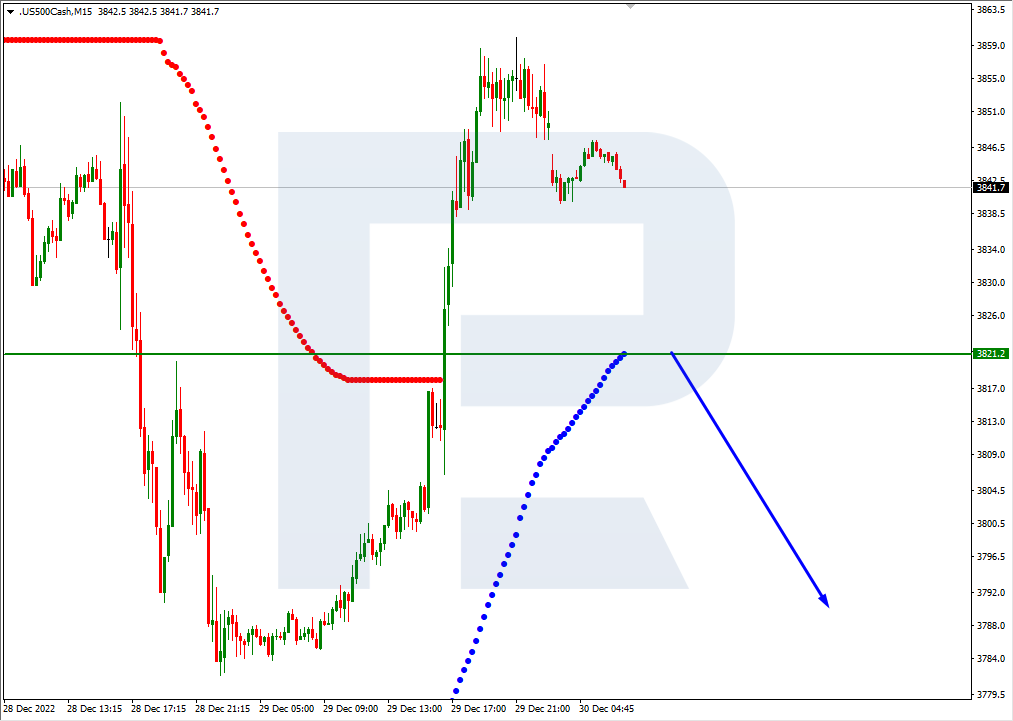
On M15, an additional signal confirming the decline will be a breakaway of the lower line of VoltyChannel.
Attention! Forecasts presented in this section only reflect the author’s private opinion and should not be considered as guidance for trading. RoboForex LP bears no responsibility for trading results based on trading recommendations described in these analytical reviews.