By JustMarkets
The EUR/USD currency pair
- Prev Open: 1.0727
- Prev Close: 1.0733
- % chg. over the last day: +0.06 %
In his speech at the banking symposium in Sweden, Federal Reserve Chairman Jerome Powell did not provide any new information on monetary policy but pointed to the central bank’s resolve, saying unpopular decisions may be needed to reduce inflation. At the same time, ECB spokeswoman Ms. Schnabel indicated yesterday that the ECB’s restrictive monetary policy stance would benefit society in the medium to long term by restoring price stability. As a result, economists expect the US Federal Reserve to reduce the pace of rate hikes to 0.25%, while the ECB will raise the rate by 0.5% at its next meeting amid declining inflationary pressures in the United States.
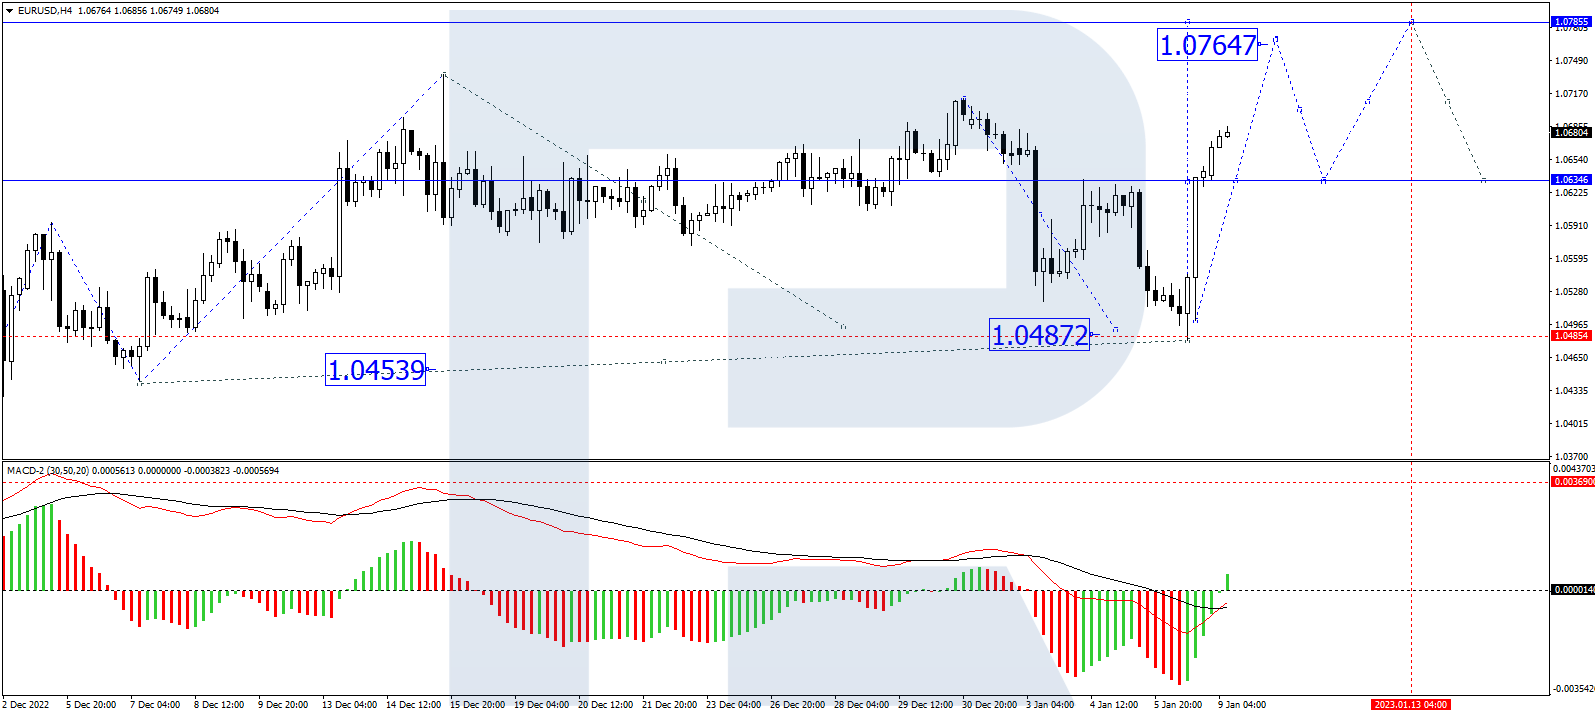
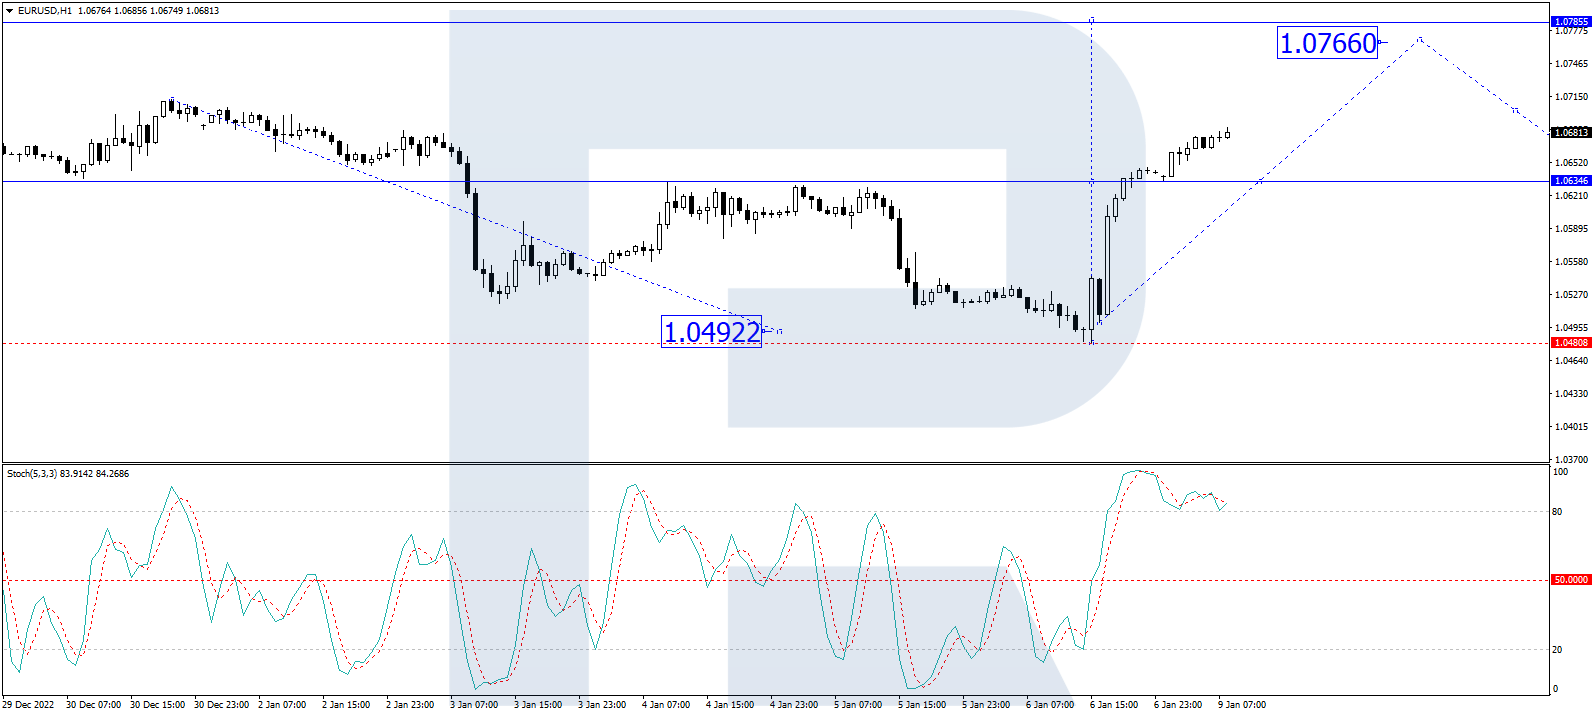
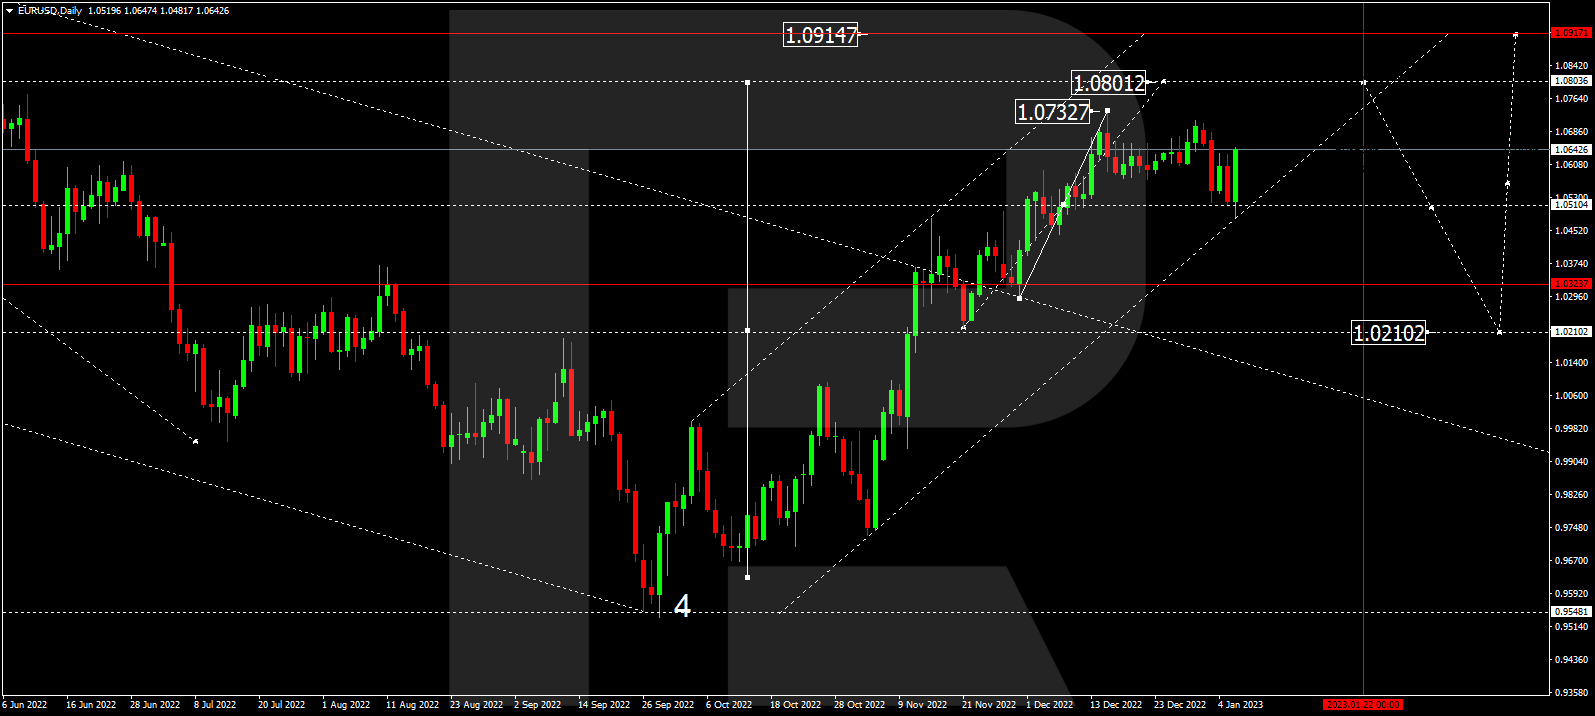
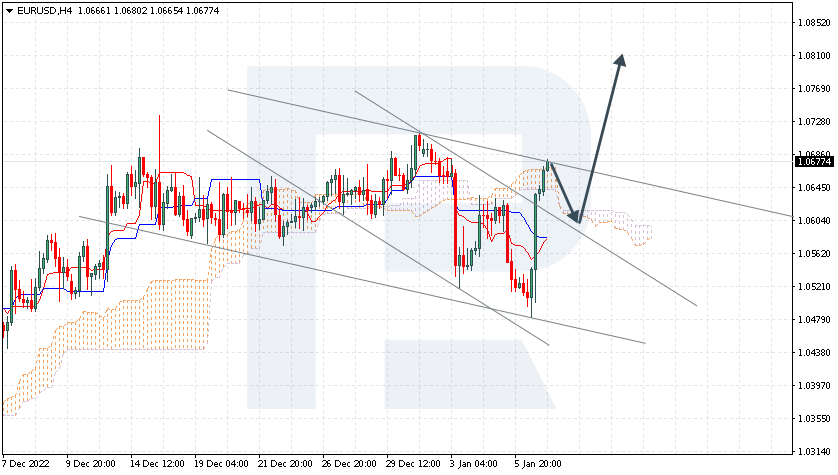
- Support levels: .0650, 1.0597, 1.0535, 1.0497, 1.0480, 1.0361, 1.0332, 1.0284
- Resistance levels: 1.0799, 1.0844
The trend on the EUR/USD currency pair on the hourly time frame is still bullish. The price is trading above the moving averages and forming a narrow price balance. The MACD indicator is in the positive zone, but there are signs of overbought, so it is worth waiting for a correction to find good entry points. Under such market conditions, buy trades are best considered from the support level of 1.0650 or 1.0597 with confirmation on intraday time frames. Sell deals can be considered from the daily resistance level of 1.0799, but better with a confirmation in the form of a reverse initiative or a false breakout.
Alternative scenario: if the price breaks down through the support level of 1.0535 and fixes below it, the downtrend will likely resume.

The GBP/USD currency pair
- Prev Open: 1.2176
- Prev Close: 1.2149
- % chg. over the last day: -0.22 %
Economists are betting on a fall in GBP/USD quotes ahead of important US inflation data and UK GDP data on Friday. The economic outlook for the United Kingdom remains bleak. The Bank of England will raise the rate in minimal steps so as not to put even more pressure on the economy.
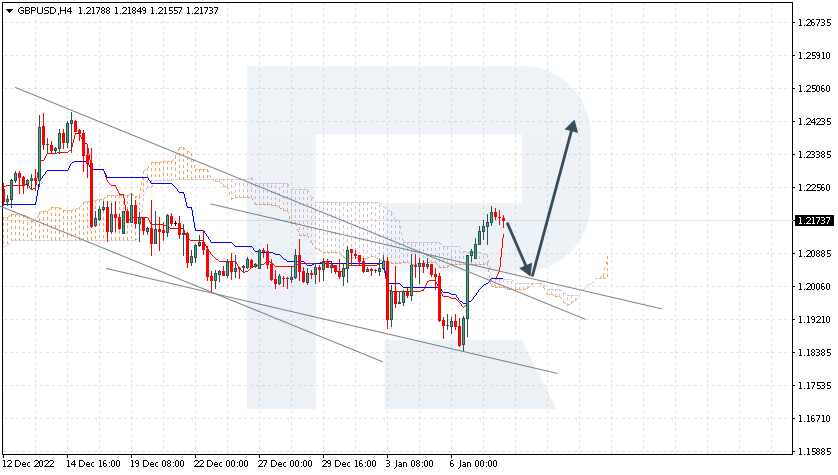
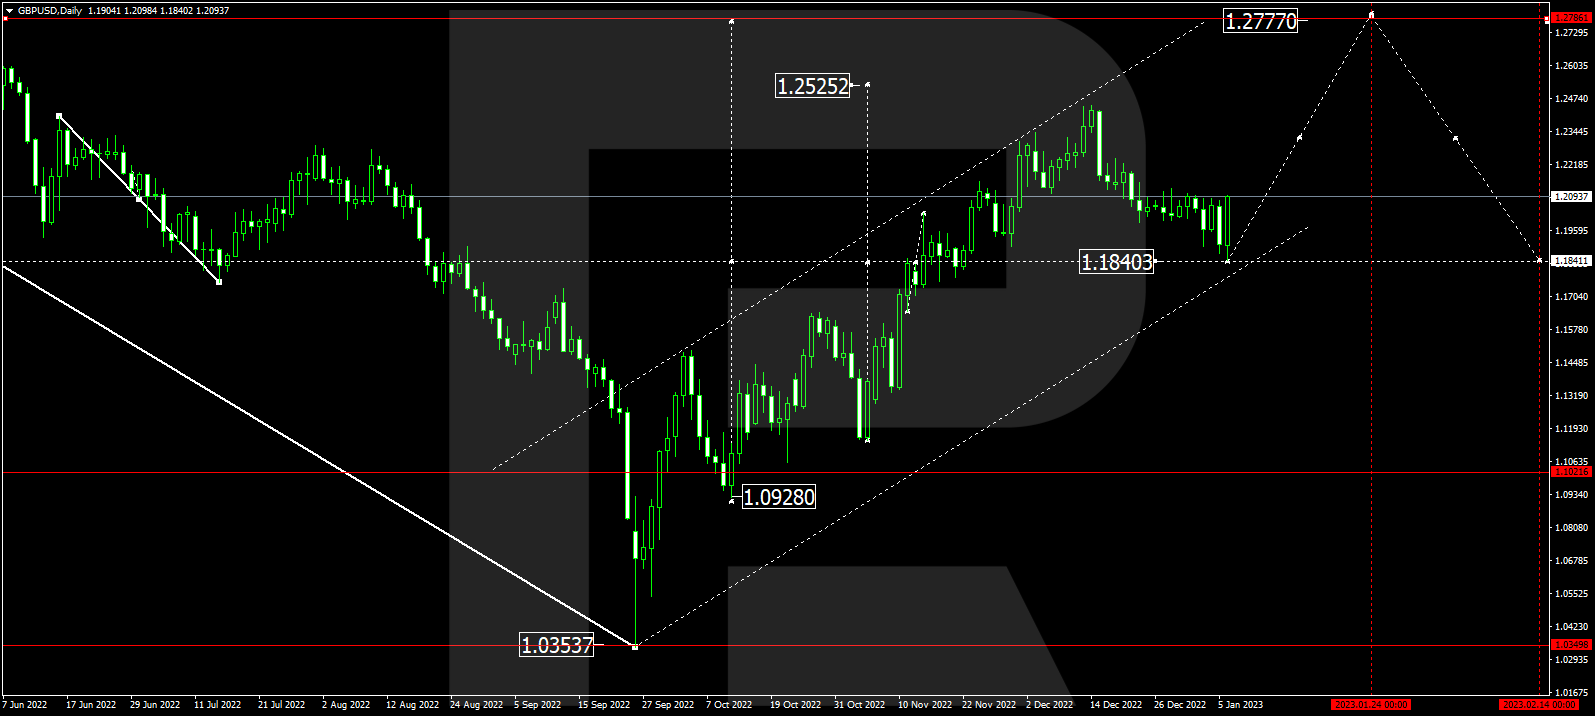
- Support levels: 1.2080, 1.2000, 1.1928, 1.1875, 1.1684, 1.1476, 1.1418
- Resistance levels: 1.2193, 1.2308, 1.2431, 1.2519
From the technical point of view, the trend on the GBP/USD currency pair on the hourly time frame is bullish. The price is trading in a narrow range above the moving averages. The MACD indicator has become inactive, and volatility on the eve of the US inflation data has decreased. Under such market conditions, it is better to look for buy trades on intraday time frames from the support level of 1.2080, but with confirmation. Sell trades are best looked for from the resistance level of 1.2193 or the stronger level of 1.2238, but also better with confirmation in the form of a false breakout or a change of structure on the lower timeframes.
Alternative scenario: if the price breaks down through the 1.1875 support level and fixes above it, the downtrend will likely resume.

The USD/JPY currency pair
- Prev Open: 131.82
- Prev Close: 132.23
- % chg. over the last day: +0.31 %
The Japanese yen has changed little against the US dollar this week. Investors are trying to predict the next moves of the Bank of Japan and the US Federal Reserve. The US Fed plans to raise the rate to a final point of 5% to 5.25%. But when the Bank of Japan starts to change its monetary policy is an open question. At the moment, experts are inclined to believe that the Bank of Japan will “reverse” when the governor is re-elected in April 2023. However, it should be noted that the difference in interest rates between the central banks of the US and Japan is still huge. Until this difference starts decreasing, traders should not expect anything “abnormal” from the Japanese Yen.
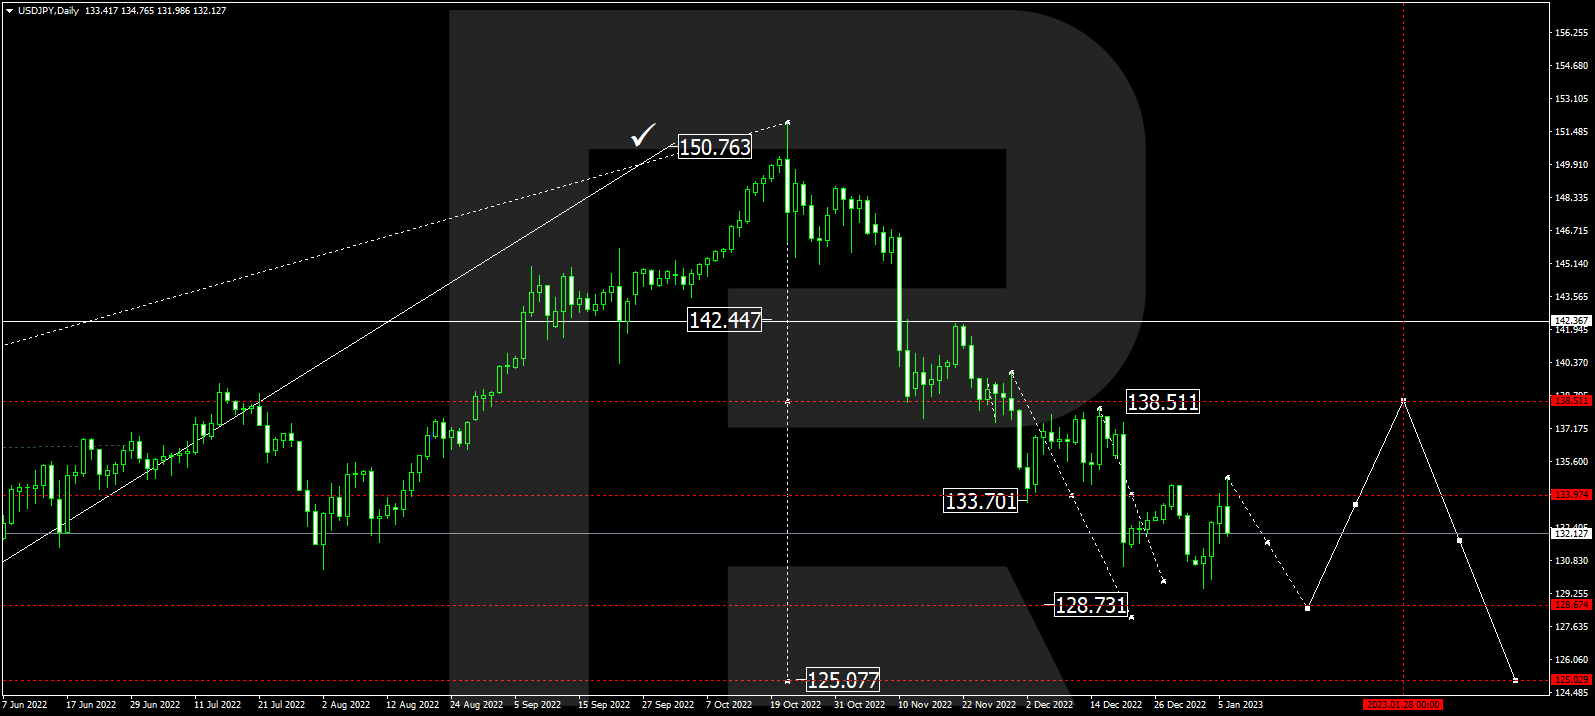
- Support levels: 131.12, 130.58, 129.65
- Resistance levels: 133.23, 134.45, 135.88, 137.03, 138.00, 139.09
From the technical point of view, the medium-term trend on the currency pair USD/JPY is bullish. The price is now trading at the level of the moving averages, while the MACD indicator has become inactive. The correctional wave is approaching its end. Buy trades are best viewed from the support levels of 131.12 or 130.58, but only with intraday confirmation. Sell deals can be searched for from the resistance level of 133.23 on the condition of a reverse reaction or false breakout.
Alternative scenario: If the price fixes below the support level of 130.58, the downtrend will likely resume.

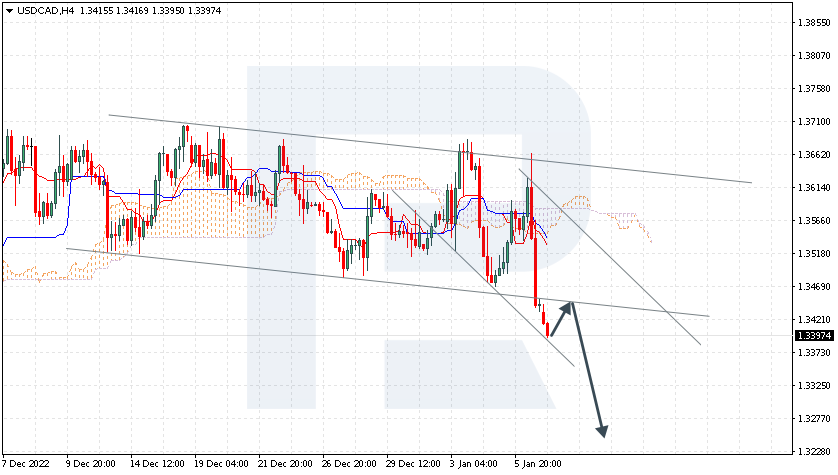
The USD/CAD currency pair
- Prev Open: 1.3380
- Prev Close: 1.3426
- % chg. over the last day: -0.34 %
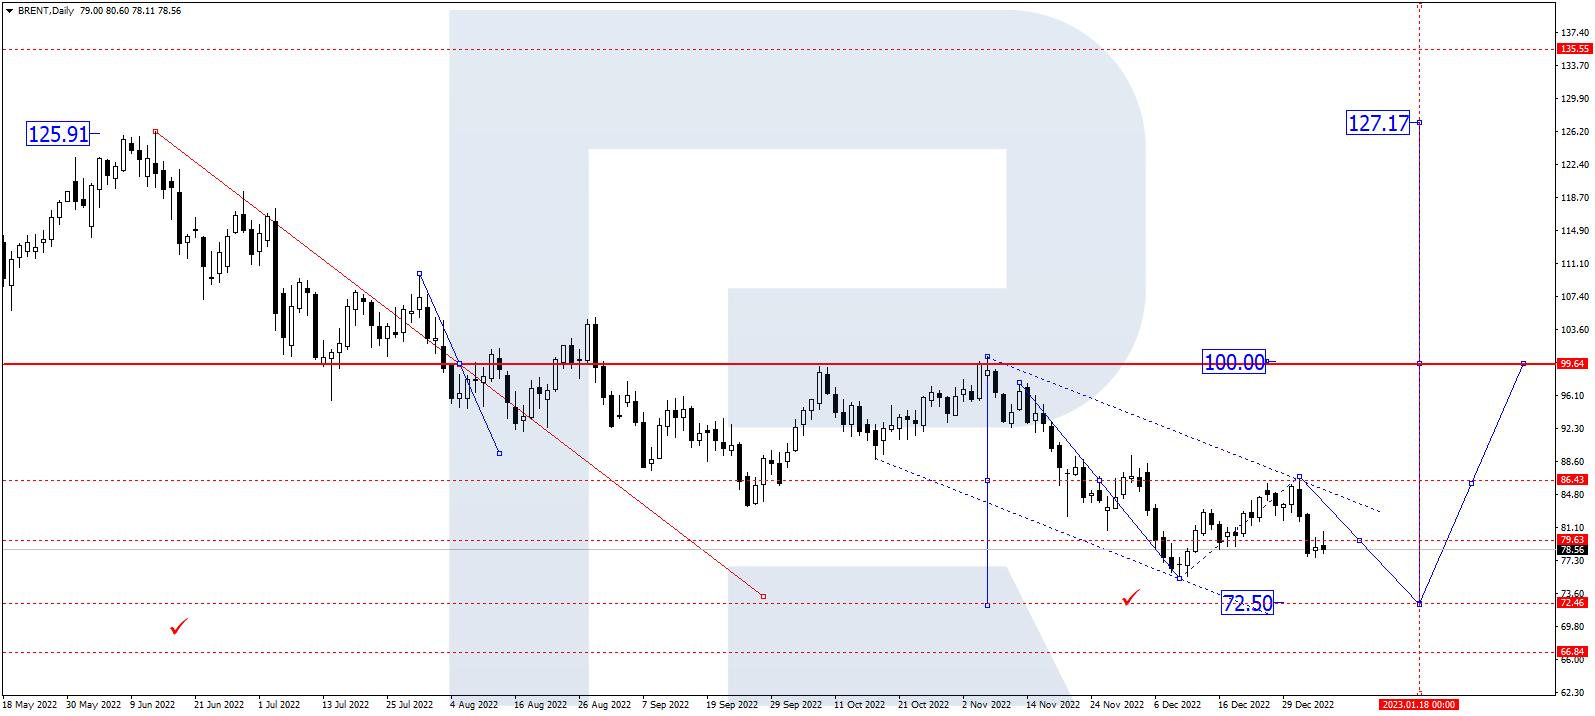
Data from the American Petroleum Institute showed that US crude oil inventories more than quadrupled in the first week of 2023 compared to the previous week. Rising inventories tend to put downward pressure on oil prices, which in turn weakens the Canadian dollar, which is a commodity currency. Another, more important, report on crude oil inventories will be released today, where a decline in inventories is expected.
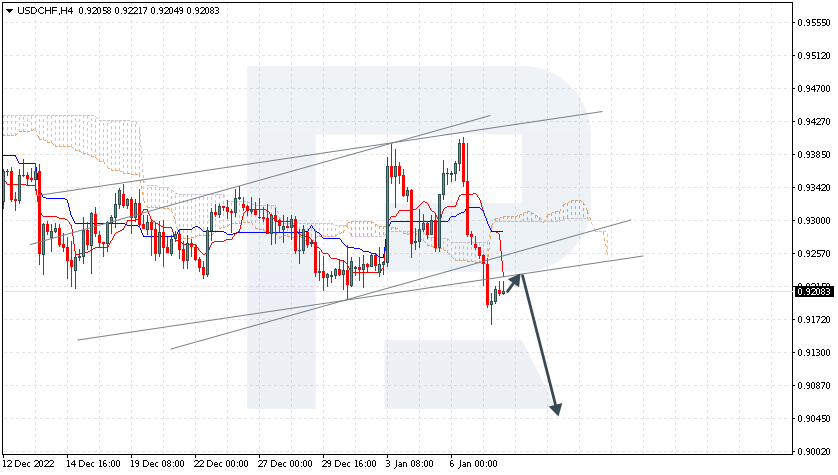
- Support levels: 1.3362, 1.3212
- Resistance levels: 1.3492, 1.3513, 1.3561, 1.3594, 1.3632, 1.3700
From the point of view of technical analysis, the trend on the USD/CAD currency pair is bearish. The price is trading at the level of moving averages. The MACD indicator has become inactive, but buyer pressure is very weak. Buy trades should be considered from the support level of 1.3362, but only with short targets and confirmation in the form of a false breakdown since the level has been tested before. Sells deals are better to look for on the intraday time frames from the resistance level of 1.3492 or 1.3513, but with a confirmation in the form of a reverse initiative on the lower time frames.
Alternative scenario: if the price breaks out and consolidates above the resistance level of 1.3632, the uptrend will likely resume.

- – US Crude Oil Reserves (w/w) at 17:30 (GMT+2).
By JustMarkets
This article reflects a personal opinion and should not be interpreted as an investment advice, and/or offer, and/or a persistent request for carrying out financial transactions, and/or a guarantee, and/or a forecast of future events.