By InvestMacro
Here are the latest charts and statistics for the Commitment of Traders (COT) data published by the Commodities Futures Trading Commission (CFTC).
The latest COT data is updated through Tuesday January 10th and shows a quick view of how large traders (for-profit speculators and commercial entities) were positioned in the futures markets.
Weekly Speculator Changes led by Russell-Mini & DowJones-Mini
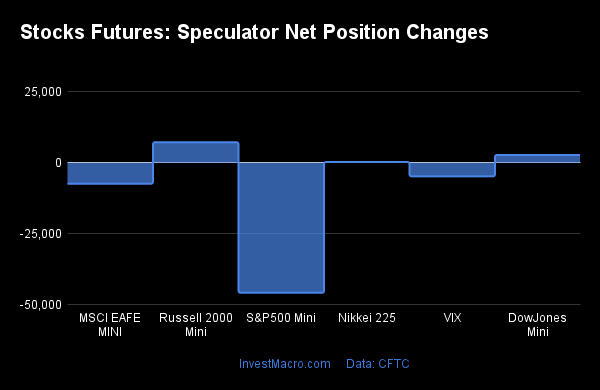
The COT stock markets speculator bets were higher this week as four out of the seven stock markets we cover had higher positioning while the other four markets had lower speculator contracts.
Leading the gains for the stock markets was Russell-Mini (7,233 contracts) with the DowJones-Mini (2,749 contracts) and the Nikkei 225 (255 contracts) also showing positive weeks.
The markets with the declines in speculator bets this week were S&P500-Mini (-45,873 contracts), Nasdaq-Mini (-9,513 contracts), MSCI EAFE-Mini (-7,413 contracts) and the VIX (-4,807 contracts) also registering lower bets on the week.
| Jan-10-2023 | OI | OI-Index | Spec-Net | Spec-Index | Com-Net | COM-Index | Smalls-Net | Smalls-Index |
|---|
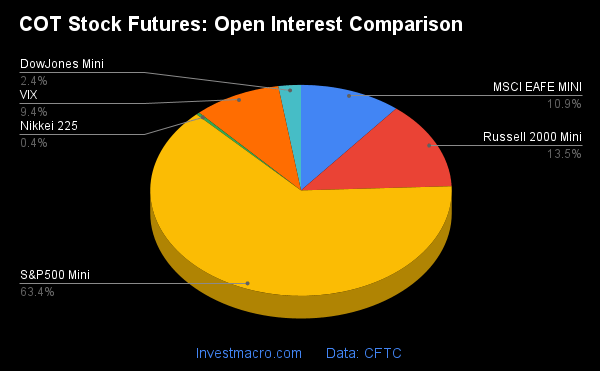
| S&P500-Mini | 2,032,566 | 3 | -213,174 | 17 | 202,933 | 77 | 10,241 | 29 |
| Nikkei 225 | 11,991 | 4 | -2,719 | 65 | 2,717 | 43 | 2 | 28 |
| Nasdaq-Mini | 253,625 | 44 | -8,151 | 70 | 13,928 | 35 | -5,777 | 41 |
| DowJones-Mini | 77,628 | 39 | -9,142 | 29 | 12,647 | 74 | -3,505 | 23 |
| VIX | 301,215 | 34 | -72,807 | 64 | 79,810 | 38 | -7,003 | 57 |
| Nikkei 225 Yen | 41,161 | 23 | 9,085 | 62 | -901 | 8 | -8,184 | 64 |
Strength Scores led by Nasdaq-Mini & Nikkei 225
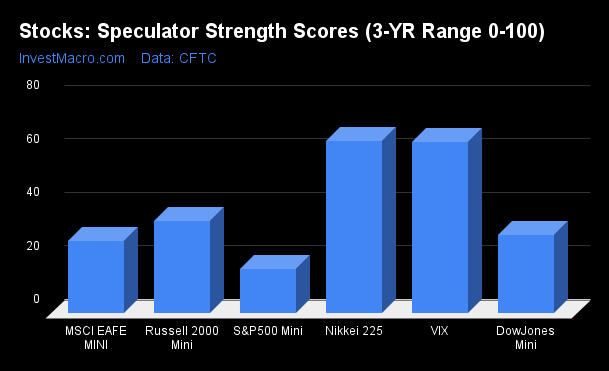
COT Strength Scores (a normalized measure of Speculator positions over a 3-Year range, from 0 to 100 where above 80 is Extreme-Bullish and below 20 is Extreme-Bearish) showed that the Nasdaq-Mini (70 percent) and the Nikkei 225 (65 percent) lead the stock markets this week. The VIX (64 percent) comes in as the next highest in the weekly strength scores.
On the downside, the S&P500-Mini (17 percent) comes in at the lowest strength level currently and is in Extreme-Bearish territory (below 20 percent). The next lowest strength score is the MSCI EAFE-Mini (27 percent).
Strength Statistics:
VIX (64.1 percent) vs VIX previous week (67.3 percent)
S&P500-Mini (16.7 percent) vs S&P500-Mini previous week (25.2 percent)
DowJones-Mini (29.3 percent) vs DowJones-Mini previous week (25.2 percent)
Nasdaq-Mini (70.5 percent) vs Nasdaq-Mini previous week (75.8 percent)
Russell2000-Mini (34.7 percent) vs Russell2000-Mini previous week (30.6 percent)
Nikkei USD (64.6 percent) vs Nikkei USD previous week (63.3 percent)
EAFE-Mini (27.2 percent) vs EAFE-Mini previous week (36.1 percent)
MSCI EAFE-Mini tops the 6-Week Strength Trends
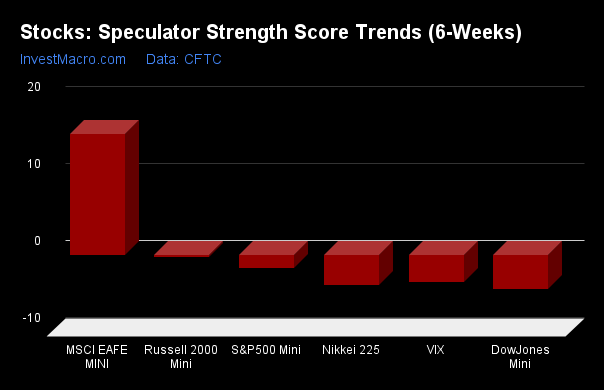
COT Strength Score Trends (or move index, calculates the 6-week changes in strength scores) showed that the MSCI EAFE-Mini (16 percent) leads the past six weeks trends for the stock markets and is the only positive mover this week.
The Nasdaq-Mini (-10 percent) leads the downside trend scores currently with the DowJones-Mini (-4.5 percent) coming in as the next market with lower trend scores.
Strength Trend Statistics:
VIX (-3.5 percent) vs VIX previous week (-3.1 percent)
S&P500-Mini (-1.7 percent) vs S&P500-Mini previous week (4.5 percent)
DowJones-Mini (-4.5 percent) vs DowJones-Mini previous week (-8.2 percent)
Nasdaq-Mini (-10.0 percent) vs Nasdaq-Mini previous week (-0.9 percent)
Russell2000-Mini (-0.3 percent) vs Russell2000-Mini previous week (-0.2 percent)
Nikkei USD (-3.9 percent) vs Nikkei USD previous week (-5.0 percent)
EAFE-Mini (15.7 percent) vs EAFE-Mini previous week (26.9 percent)
Individual Stock Market Charts:
VIX Volatility Futures:
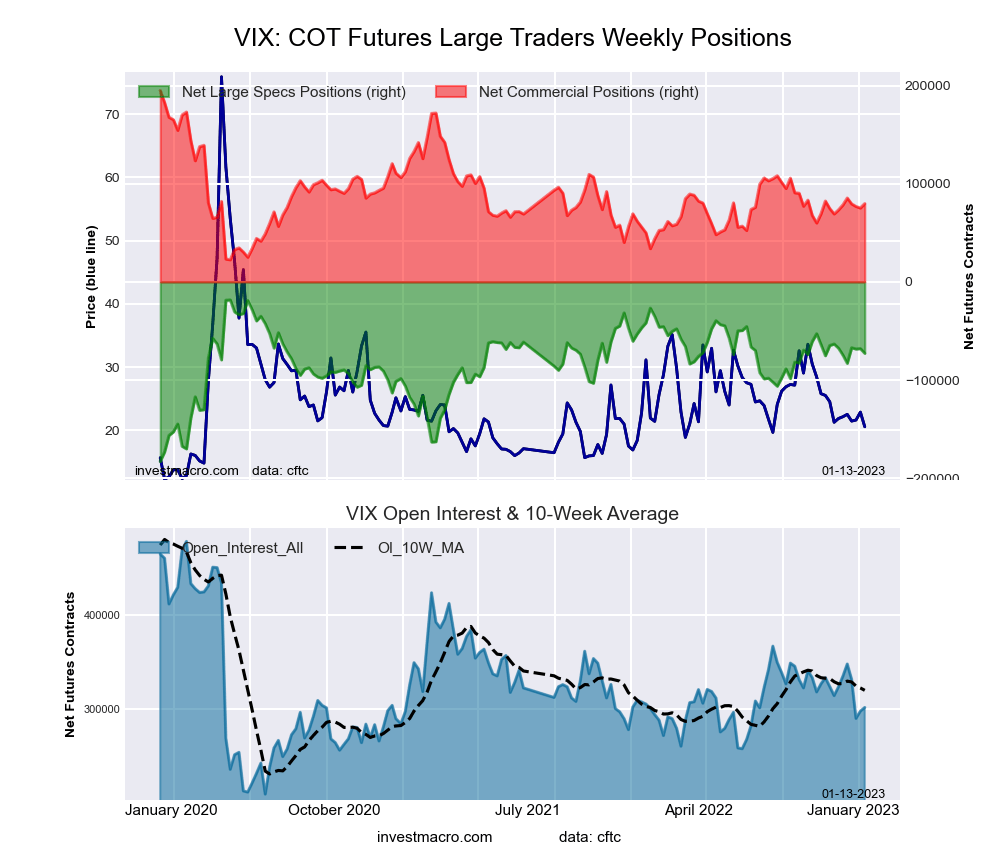 The VIX Volatility large speculator standing this week equaled a net position of -72,807 contracts in the data reported through Tuesday. This was a weekly reduction of -4,807 contracts from the previous week which had a total of -68,000 net contracts.
This week’s current strength score (the trader positioning range over the past three years, measured from 0 to 100) shows the speculators are currently Bullish with a score of 64.1 percent. The commercials are Bearish with a score of 38.0 percent and the small traders (not shown in chart) are Bullish with a score of 57.4 percent.
| VIX Volatility Futures Statistics | SPECULATORS | COMMERCIALS | SMALL TRADERS |
| – Percent of Open Interest Longs: | 16.6 | 56.7 | 6.4 |
| – Percent of Open Interest Shorts: | 40.8 | 30.2 | 8.7 |
| – Net Position: | -72,807 | 79,810 | -7,003 |
| – Gross Longs: | 50,080 | 170,766 | 19,207 |
| – Gross Shorts: | 122,887 | 90,956 | 26,210 |
| – Long to Short Ratio: | 0.4 to 1 | 1.9 to 1 | 0.7 to 1 |
| NET POSITION TREND: | | | |
| – Strength Index Score (3 Year Range Pct): | 64.1 | 38.0 | 57.4 |
| – Strength Index Reading (3 Year Range): | Bullish | Bearish | Bullish |
| NET POSITION MOVEMENT INDEX: | | | |
| – 6-Week Change in Strength Index: | -3.5 | 4.3 | -5.5 |
S&P500 Mini Futures:
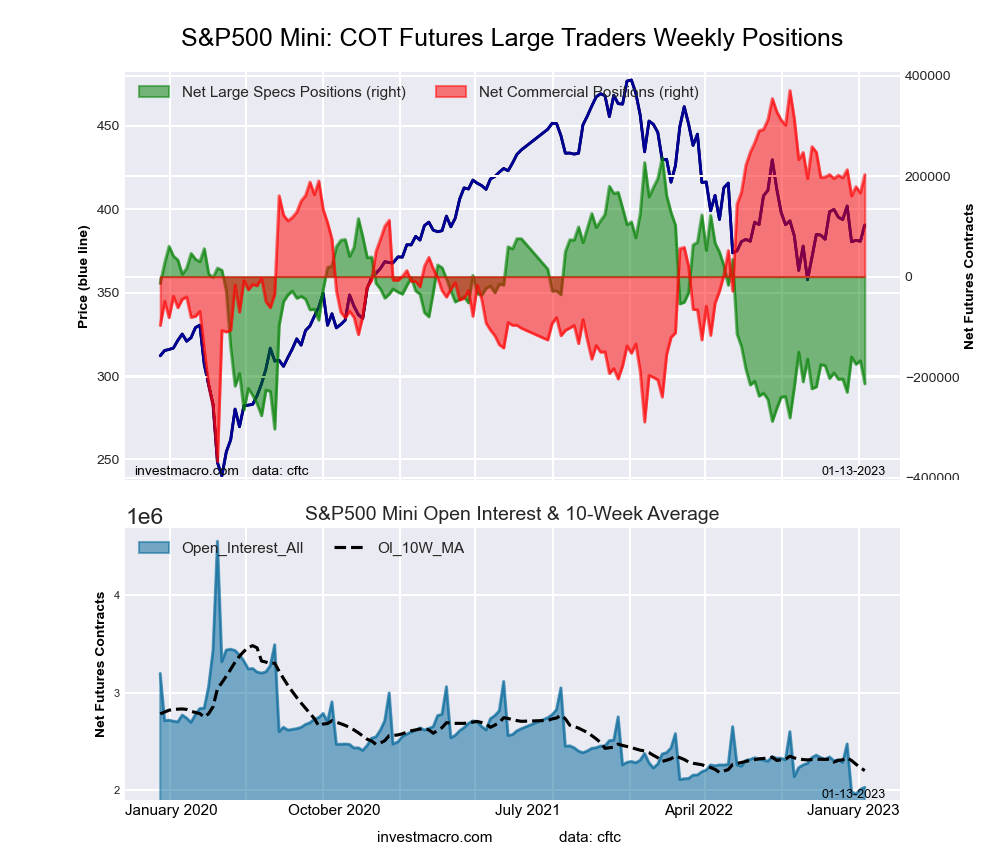 The S&P500 Mini large speculator standing this week equaled a net position of -213,174 contracts in the data reported through Tuesday. This was a weekly drop by -45,873 contracts from the previous week which had a total of -167,301 net contracts.
This week’s current strength score (the trader positioning range over the past three years, measured from 0 to 100) shows the speculators are currently Bearish-Extreme with a score of 16.7 percent. The commercials are Bullish with a score of 77.3 percent and the small traders (not shown in chart) are Bearish with a score of 28.5 percent.
| S&P500 Mini Futures Statistics | SPECULATORS | COMMERCIALS | SMALL TRADERS |
| – Percent of Open Interest Longs: | 12.0 | 74.4 | 11.7 |
| – Percent of Open Interest Shorts: | 22.5 | 64.5 | 11.2 |
| – Net Position: | -213,174 | 202,933 | 10,241 |
| – Gross Longs: | 243,503 | 1,512,933 | 236,946 |
| – Gross Shorts: | 456,677 | 1,310,000 | 226,705 |
| – Long to Short Ratio: | 0.5 to 1 | 1.2 to 1 | 1.0 to 1 |
| NET POSITION TREND: | | | |
| – Strength Index Score (3 Year Range Pct): | 16.7 | 77.3 | 28.5 |
| – Strength Index Reading (3 Year Range): | Bearish-Extreme | Bullish | Bearish |
| NET POSITION MOVEMENT INDEX: | | | |
| – 6-Week Change in Strength Index: | -1.7 | 0.2 | 1.6 |
Dow Jones Mini Futures:
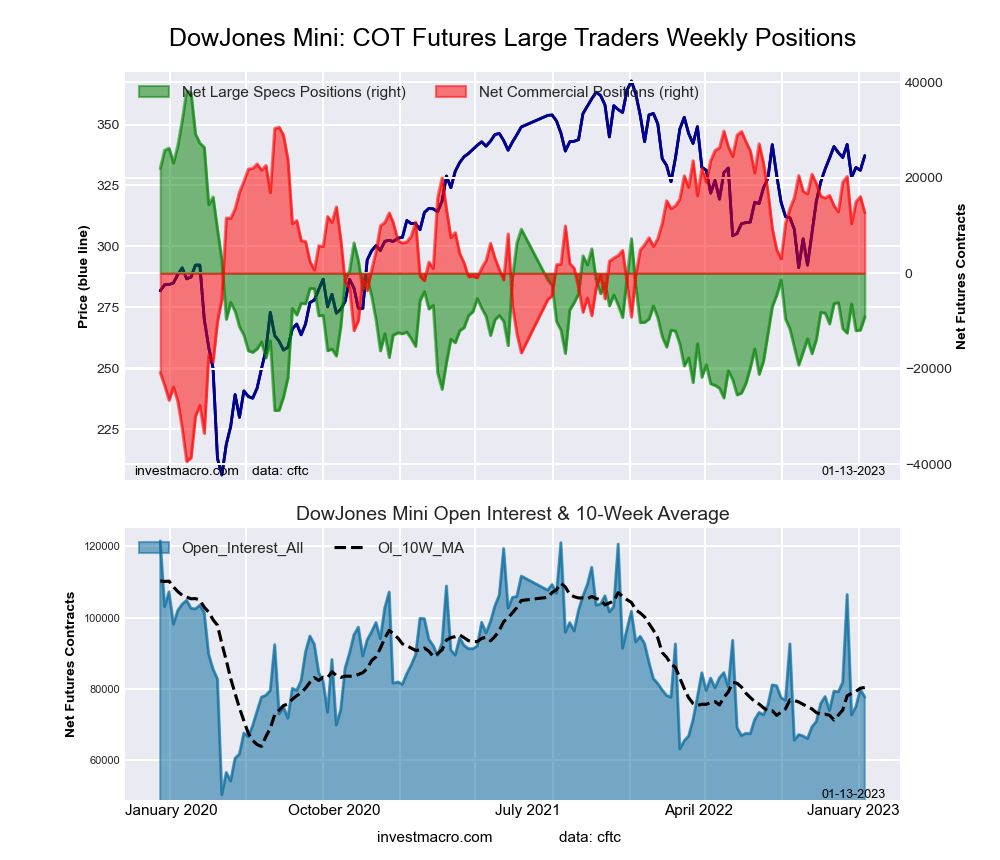 The Dow Jones Mini large speculator standing this week equaled a net position of -9,142 contracts in the data reported through Tuesday. This was a weekly lift of 2,749 contracts from the previous week which had a total of -11,891 net contracts.
This week’s current strength score (the trader positioning range over the past three years, measured from 0 to 100) shows the speculators are currently Bearish with a score of 29.3 percent. The commercials are Bullish with a score of 74.4 percent and the small traders (not shown in chart) are Bearish with a score of 22.8 percent.
| Dow Jones Mini Futures Statistics | SPECULATORS | COMMERCIALS | SMALL TRADERS |
| – Percent of Open Interest Longs: | 33.4 | 47.8 | 15.8 |
| – Percent of Open Interest Shorts: | 45.2 | 31.5 | 20.4 |
| – Net Position: | -9,142 | 12,647 | -3,505 |
| – Gross Longs: | 25,943 | 37,120 | 12,296 |
| – Gross Shorts: | 35,085 | 24,473 | 15,801 |
| – Long to Short Ratio: | 0.7 to 1 | 1.5 to 1 | 0.8 to 1 |
| NET POSITION TREND: | | | |
| – Strength Index Score (3 Year Range Pct): | 29.3 | 74.4 | 22.8 |
| – Strength Index Reading (3 Year Range): | Bearish | Bullish | Bearish |
| NET POSITION MOVEMENT INDEX: | | | |
| – 6-Week Change in Strength Index: | -4.5 | -0.3 | 16.6 |
Nasdaq Mini Futures:
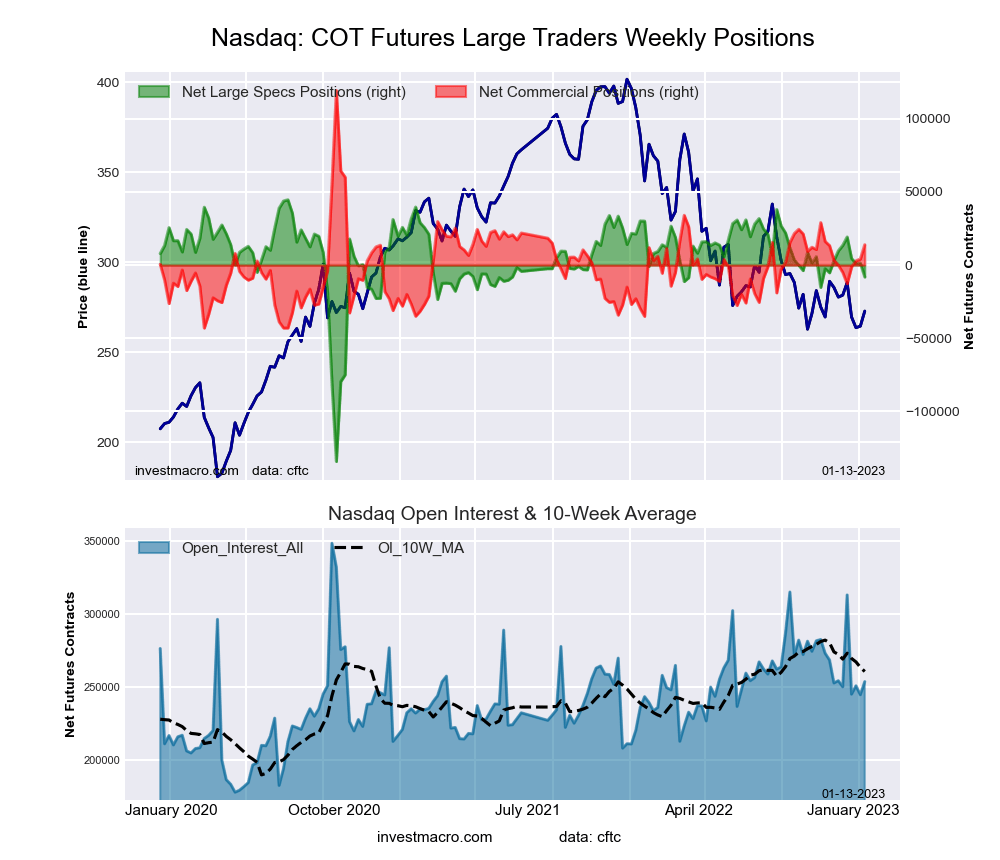 The Nasdaq Mini large speculator standing this week equaled a net position of -8,151 contracts in the data reported through Tuesday. This was a weekly decline of -9,513 contracts from the previous week which had a total of 1,362 net contracts.
This week’s current strength score (the trader positioning range over the past three years, measured from 0 to 100) shows the speculators are currently Bullish with a score of 70.5 percent. The commercials are Bearish with a score of 35.1 percent and the small traders (not shown in chart) are Bearish with a score of 41.2 percent.
| Nasdaq Mini Futures Statistics | SPECULATORS | COMMERCIALS | SMALL TRADERS |
| – Percent of Open Interest Longs: | 22.5 | 61.5 | 13.0 |
| – Percent of Open Interest Shorts: | 25.7 | 56.0 | 15.3 |
| – Net Position: | -8,151 | 13,928 | -5,777 |
| – Gross Longs: | 57,068 | 156,031 | 32,962 |
| – Gross Shorts: | 65,219 | 142,103 | 38,739 |
| – Long to Short Ratio: | 0.9 to 1 | 1.1 to 1 | 0.9 to 1 |
| NET POSITION TREND: | | | |
| – Strength Index Score (3 Year Range Pct): | 70.5 | 35.1 | 41.2 |
| – Strength Index Reading (3 Year Range): | Bullish | Bearish | Bearish |
| NET POSITION MOVEMENT INDEX: | | | |
| – 6-Week Change in Strength Index: | -10.0 | 8.6 | 7.5 |
Russell 2000 Mini Futures:
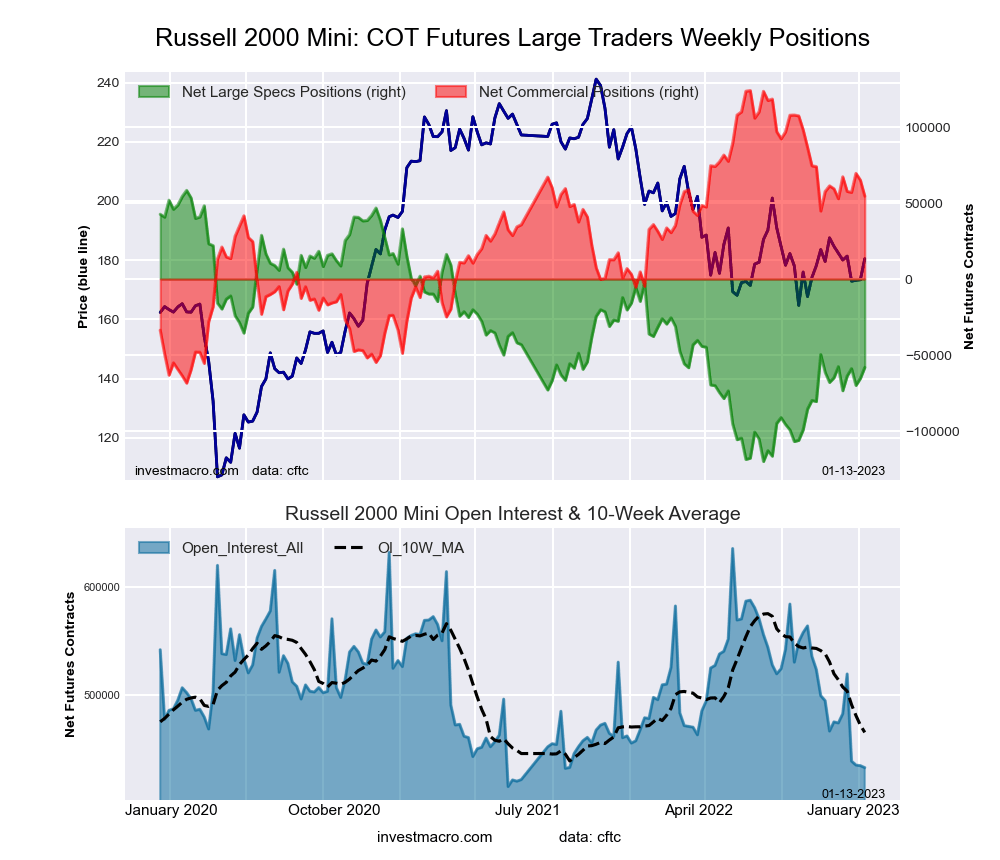 The Russell 2000 Mini large speculator standing this week equaled a net position of -58,128 contracts in the data reported through Tuesday. This was a weekly lift of 7,233 contracts from the previous week which had a total of -65,361 net contracts.
This week’s current strength score (the trader positioning range over the past three years, measured from 0 to 100) shows the speculators are currently Bearish with a score of 34.7 percent. The commercials are Bullish with a score of 63.9 percent and the small traders (not shown in chart) are Bearish with a score of 37.7 percent.
| Russell 2000 Mini Futures Statistics | SPECULATORS | COMMERCIALS | SMALL TRADERS |
| – Percent of Open Interest Longs: | 10.4 | 82.7 | 5.7 |
| – Percent of Open Interest Shorts: | 23.8 | 70.1 | 4.9 |
| – Net Position: | -58,128 | 54,539 | 3,589 |
| – Gross Longs: | 44,813 | 357,515 | 24,756 |
| – Gross Shorts: | 102,941 | 302,976 | 21,167 |
| – Long to Short Ratio: | 0.4 to 1 | 1.2 to 1 | 1.2 to 1 |
| NET POSITION TREND: | | | |
| – Strength Index Score (3 Year Range Pct): | 34.7 | 63.9 | 37.7 |
| – Strength Index Reading (3 Year Range): | Bearish | Bullish | Bearish |
| NET POSITION MOVEMENT INDEX: | | | |
| – 6-Week Change in Strength Index: | -0.3 | 0.9 | -3.5 |
Nikkei Stock Average (USD) Futures:
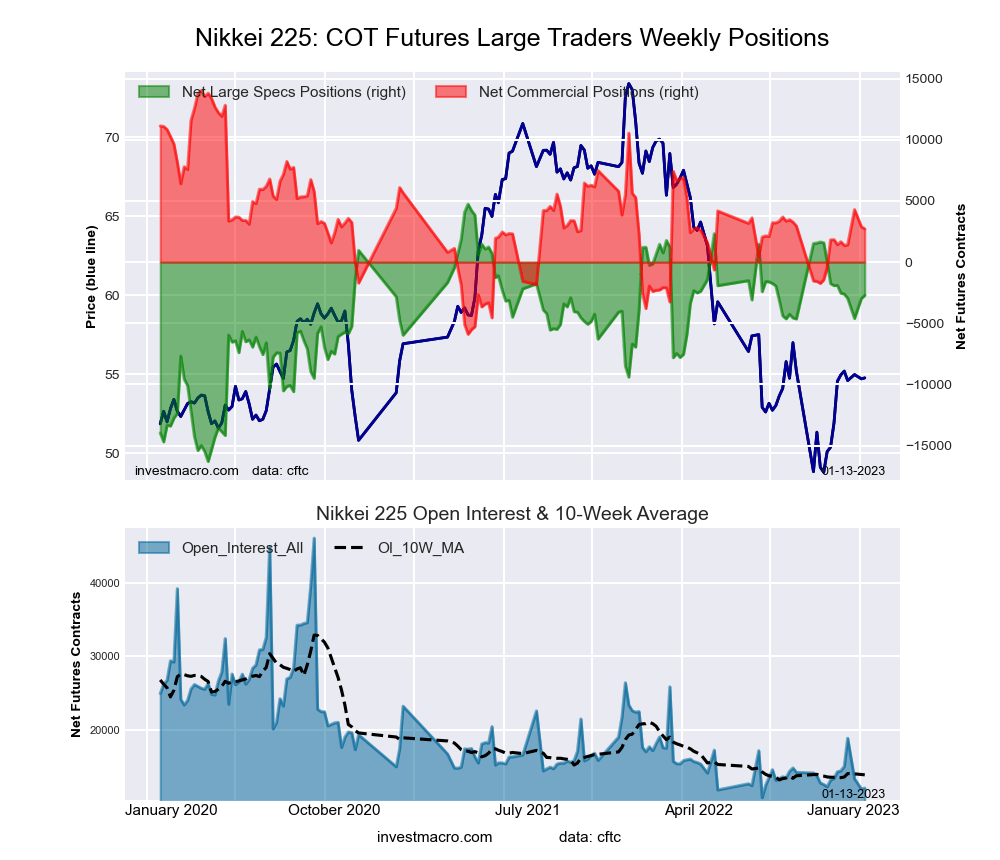 The Nikkei Stock Average (USD) large speculator standing this week equaled a net position of -2,719 contracts in the data reported through Tuesday. This was a weekly increase of 255 contracts from the previous week which had a total of -2,974 net contracts.
This week’s current strength score (the trader positioning range over the past three years, measured from 0 to 100) shows the speculators are currently Bullish with a score of 64.6 percent. The commercials are Bearish with a score of 43.2 percent and the small traders (not shown in chart) are Bearish with a score of 28.4 percent.
| Nikkei Stock Average Futures Statistics | SPECULATORS | COMMERCIALS | SMALL TRADERS |
| – Percent of Open Interest Longs: | 24.1 | 52.2 | 23.8 |
| – Percent of Open Interest Shorts: | 46.7 | 29.5 | 23.7 |
| – Net Position: | -2,719 | 2,717 | 2 |
| – Gross Longs: | 2,886 | 6,257 | 2,848 |
| – Gross Shorts: | 5,605 | 3,540 | 2,846 |
| – Long to Short Ratio: | 0.5 to 1 | 1.8 to 1 | 1.0 to 1 |
| NET POSITION TREND: | | | |
| – Strength Index Score (3 Year Range Pct): | 64.6 | 43.2 | 28.4 |
| – Strength Index Reading (3 Year Range): | Bullish | Bearish | Bearish |
| NET POSITION MOVEMENT INDEX: | | | |
| – 6-Week Change in Strength Index: | -3.9 | 6.5 | -6.0 |
MSCI EAFE Mini Futures:
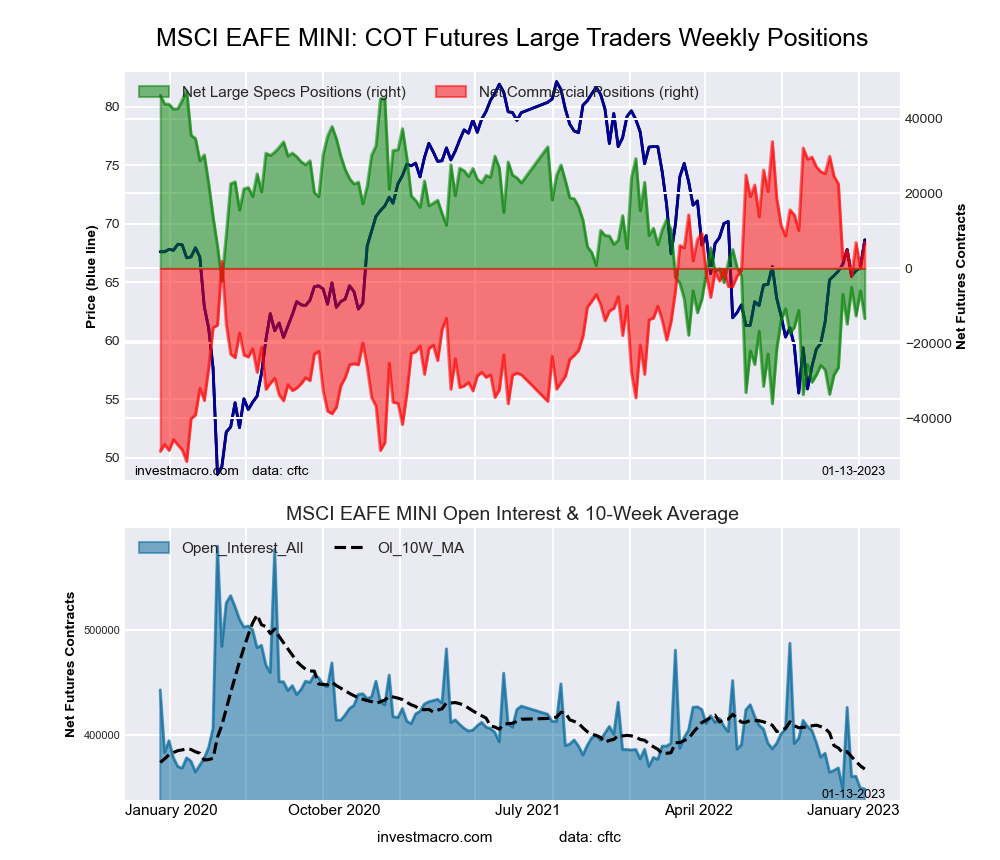 The MSCI EAFE Mini large speculator standing this week equaled a net position of -13,409 contracts in the data reported through Tuesday. This was a weekly fall of -7,413 contracts from the previous week which had a total of -5,996 net contracts.
This week’s current strength score (the trader positioning range over the past three years, measured from 0 to 100) shows the speculators are currently Bearish with a score of 27.2 percent. The commercials are Bullish with a score of 68.5 percent and the small traders (not shown in chart) are Bullish with a score of 73.7 percent.
| MSCI EAFE Mini Futures Statistics | SPECULATORS | COMMERCIALS | SMALL TRADERS |
| – Percent of Open Interest Longs: | 4.5 | 91.5 | 3.5 |
| – Percent of Open Interest Shorts: | 8.3 | 89.5 | 1.7 |
| – Net Position: | -13,409 | 6,968 | 6,441 |
| – Gross Longs: | 15,571 | 318,983 | 12,299 |
| – Gross Shorts: | 28,980 | 312,015 | 5,858 |
| – Long to Short Ratio: | 0.5 to 1 | 1.0 to 1 | 2.1 to 1 |
| NET POSITION TREND: | | | |
| – Strength Index Score (3 Year Range Pct): | 27.2 | 68.5 | 73.7 |
| – Strength Index Reading (3 Year Range): | Bearish | Bullish | Bullish |
| NET POSITION MOVEMENT INDEX: | | | |
| – 6-Week Change in Strength Index: | 15.7 | -18.2 | 18.4 |
Article By InvestMacro – Receive our weekly COT Newsletter
*COT Report: The COT data, released weekly to the public each Friday, is updated through the most recent Tuesday (data is 3 days old) and shows a quick view of how large speculators or non-commercials (for-profit traders) were positioned in the futures markets.
The CFTC categorizes trader positions according to commercial hedgers (traders who use futures contracts for hedging as part of the business), non-commercials (large traders who speculate to realize trading profits) and nonreportable traders (usually small traders/speculators) as well as their open interest (contracts open in the market at time of reporting). See CFTC criteria here.


