By JustMarkets
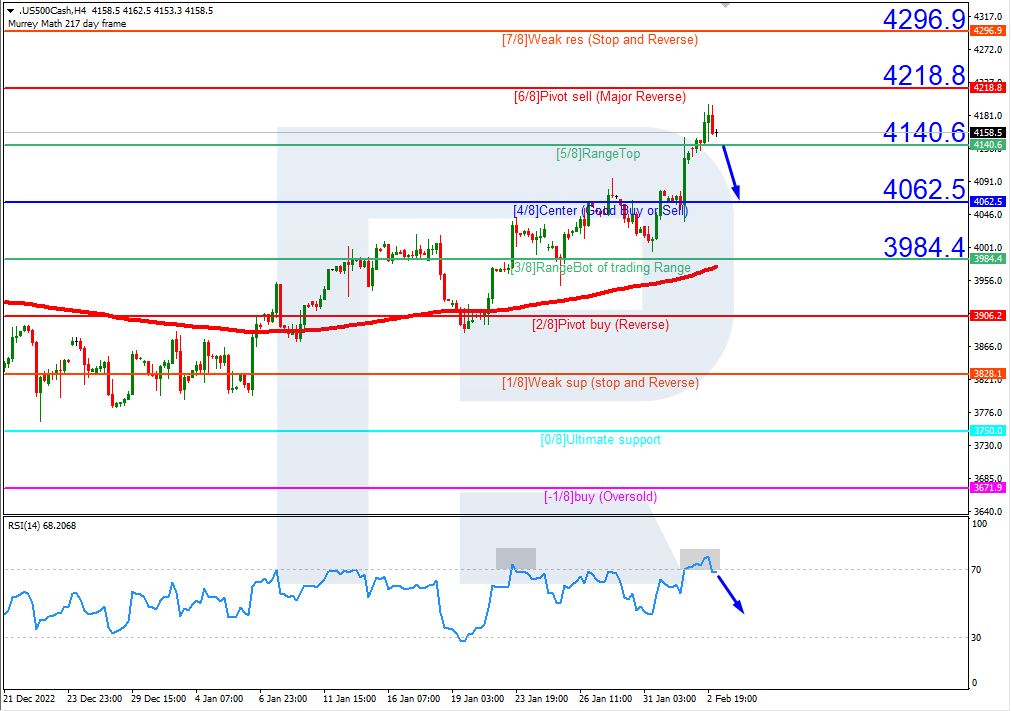
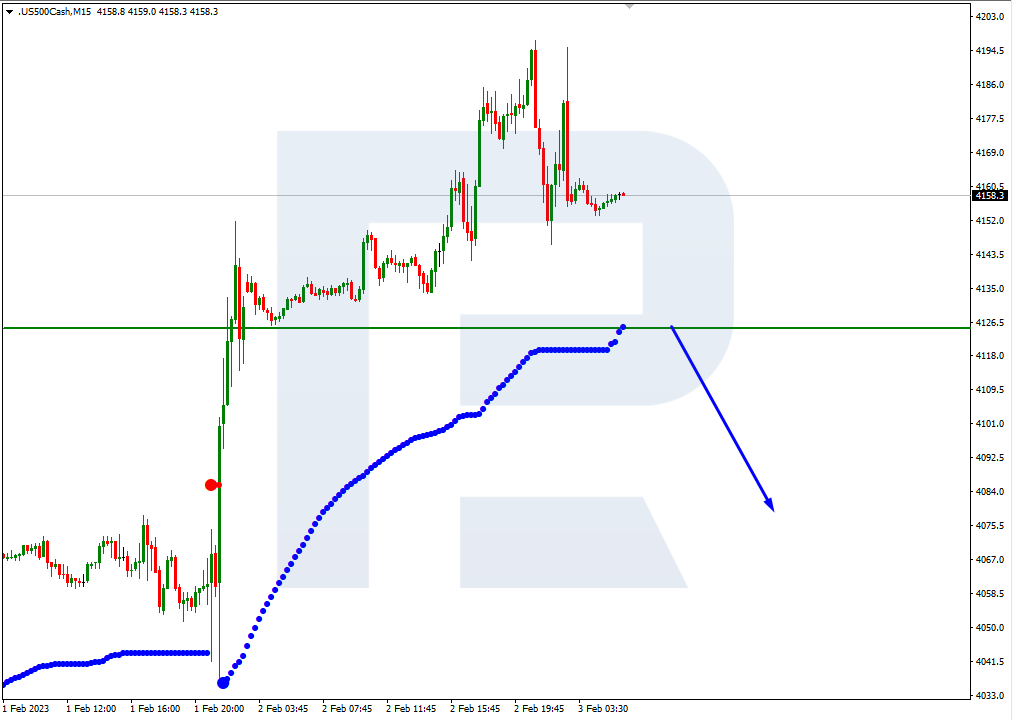
Friday’s US jobs report caused investors to revise their expectations of how hawkish the Fed might be in its efforts to rein in inflation. Nonfarm payrolls showed 517K (forecast 190K, previous 223K). The unemployment rate fell to 3.4% (forecast 3.6%, previous 3.5%). Very strong labor market data leaves the US Fed with more leeway to keep raising rates. Investors are concerned that excessive Fed rate hikes will cause a recession in the economy. That’s why such labor market data caused a sell-off in the stock market. At the close of the stock market on Friday, the Dow Jones Index (US30) decreased by 0.38% (+0.05% for the week), while the S&P 500 (US500) lost 1.04% (+2.15% for the week). The NASDAQ Technology Index (US100) fell by 1.59% (+4.30% for the week).
The earning season continues this week, and mainly consumer and industrial companies will report. The calendar includes such companies as Walt Disney (DIS), News Corp (NWSA), New York Times (NYT), Fox Corp A (FOXA), PepsiCo (PEP), Kellogg (K), Activision Blizzard (ATVI), Pinterest (PINS), BP (BP), TotalEnergies SE ADR (TTE), Uber Tech (UBER), Toyota Motor ADR (TM), AbbVie (ABBV), AstraZeneca ADR (AZN), Philip Morris (PM), PayPal Holdings Inc (PYPL), BNP Paribas ADR (BNPQY), L’Oreal ADR (LRLCY) and others. Refinitiv expects S&P 500 earnings to fall by 2.4% in the fourth quarter from a year ago, a sharper drop than the 1.6% forecast on January 1, after 190 companies reported.
Equity markets in Europe traded flat on Friday but closed the week on the plus side. German DAX (DE30) decreased by 0.21% (+2.69% for the week), French CAC 40 (FR40) gained 0.94% (+2.55% for the week), Spanish IBEX 35 (ES35) lost 0.04% (+1.94% for the week), British FTSE 100 (UK100) added 1.04% (+1.76% for the week).
The Bank of England raised its November GDP forecast for the fourth quarter from a slight decline of 0.1% (q/q) to a minimum growth of 0.1% (q/q). On the one hand, this is positive, indicating that this year’s recession is likely to be “much shallower” than previously forecast. But in the event of a negative GDP report this week, the UK economy will fall into a technical recession, which is defined as two consecutive quarters of negative economic growth.
Gold fell nearly 3% Friday after a strong US jobs report in January triggered profit-taking on the precious metal’s long rally. Gold has an inverse correlation to the dollar index and government bond yields, so a rise in the dollar is almost always negative for the precious metal.
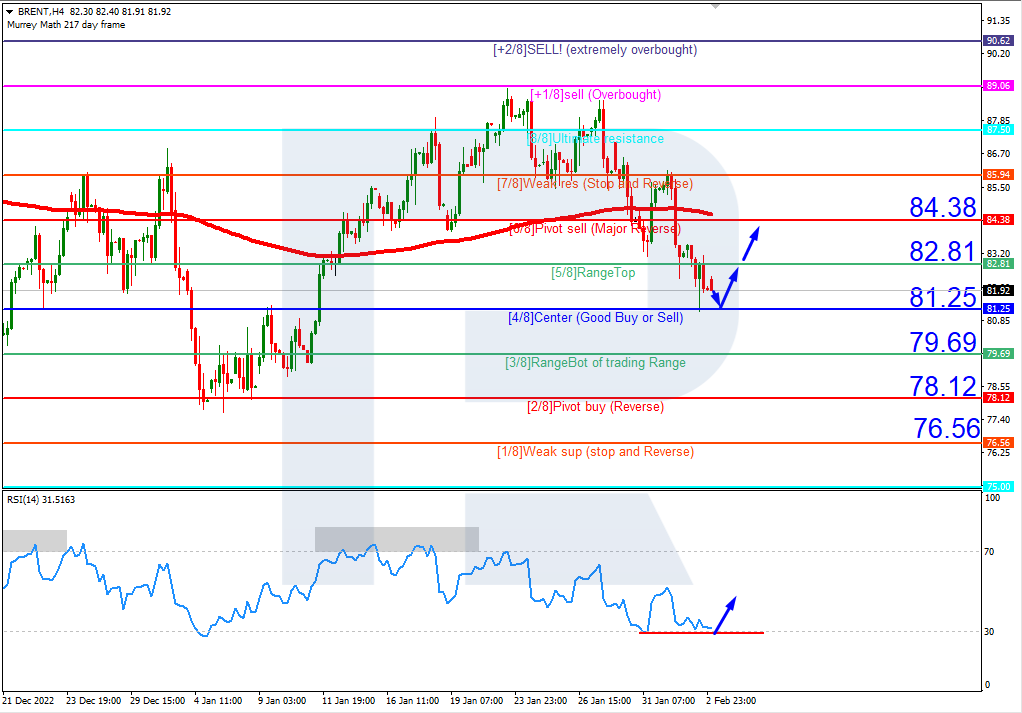
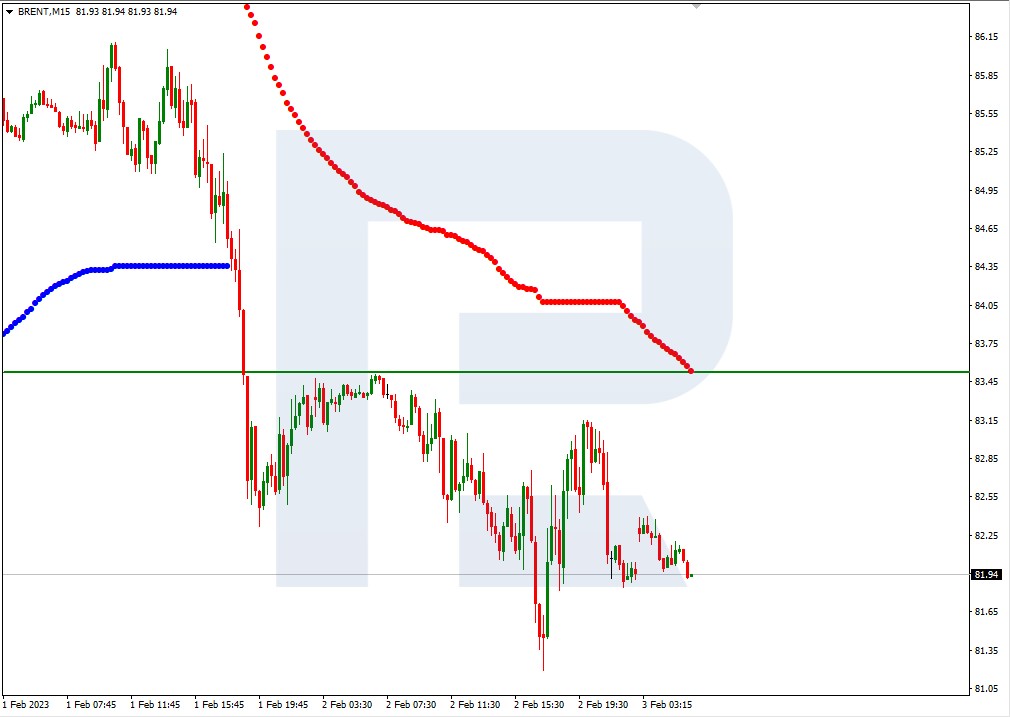
Crude oil prices decreased by 7% for the week. The benchmark Brent oil fell below $80 a barrel, and WTI (West Texas Intermediate) fell to $70 a barrel. This was caused by the growth of the dollar index, as well as by the excessive fuel in strategic reserves. The market was also pressured by the OPEC+ decision last week to leave production levels unchanged and uncertainty over how good demand from China will be in February. The US and European Union sanctions on Russian fuel products, which took effect on Sunday, should significantly hit Moscow’s oil revenues. However, analysts believe that, on the contrary, it may lead to an increase in oil prices because, considering the current level of demand to the level of oil production, the ban on Russian oil may lead to a shortage of “black gold” in the market.
Natural gas futures fell by 21% over the week despite the onset of frost in the key northeastern US region. An unusually warm start to the winter of 2022/23 resulted in a significant reduction in heating demand in the United States compared to the norm, leaving more gas in storage than originally anticipated. In Europe, the situation is similar. By all indicators, natural gas prices are extremely oversold, so analysts expect at least a short-term rebound.
Asian markets traded without a single dynamic last week. Japan’s Nikkei 225 (JP225) gained 0.46% over the week, China’s FTSE China A50 (CHA50) declined by 4.92%, Hong Kong’s Hang Seng (HK50) dropped 4.07%, India’s NIFTY 50 (IND50) gained 1.01%, and Australia’s S&P/ASX 200 (AU200) was positive by 0.86%.
Japan’s economy is likely to return to growth in the final quarter of 2022 as the country reopens to tourists, offsetting weakening corporate activity and exports amid worsening global conditions. Analysts expect GDP growth of 2% in the last quarter.
In the commodities market, futures on orange juice (+16.45%), coffee (+2.24%), and sugar (+1.57%) showed the biggest gains last week. Futures on natural gas (-16.29%), gasoline (-10.44%), WTI oil (-8.09%), Brent oil (-7.79%), silver (-5.19%), copper (-4.55%), platinum (-3.62%) and gold (-2.68%) showed the biggest drop.
S&P 500 (F) (US500) 4,136.48 −43.28 (−1.04%)
Dow Jones (US30) 33,926.01 −127.93 (−0.38%)
DAX (DE40) 15,476.43 −32.76 (−0.21%)
FTSE 100 (UK100) 7,901.80 +81.64 (+1.04%)
USD Index 102.99 +1.24 (+1.22%)
Important events for today:
- – Australia Retail Sales (m/m) at 02:30 (GMT+2);
- – UK Construction PMI (m/m) at 11:30 (GMT+2);
- – Eurozone Retail Sales (m/m) at 12:00 (GMT+2);
- – Canada Ivey PMI (m/m) at 17:00 (GMT+2);
- – ECB President Lagarde’s Speech at 20:00 (GMT+2).
By JustMarkets
This article reflects a personal opinion and should not be interpreted as an investment advice, and/or offer, and/or a persistent request for carrying out financial transactions, and/or a guarantee, and/or a forecast of future events.