By ForexTime
- UK100_m tracks FTSE 100 index which measures 100 largest UK stocks
- Lower-than-expected UK inflation = lowered bets for BOE rate hikes = Pound falls
- Weaker GBP improves earnings outlook for FTSE 100 companies, pushing UK100_m higher
- Technical analysis points to 4 potential upside targets for UK100_m
The UK100_m has resurfaced above the psychologically-important 7500 level after today’s UK inflation data came in below market expectations.
Looking at the price charts, the UK100_m index ascent is significant, given that it’s gone above several notable price levels:
- the upper bound of its downtrend since April (broken out of the multi-month downtrend)
- a key Fibonacci level from its October 2022 – February 2023 ascent
- its early-July cycle high of 7565.2

NOTE: The UK100_m tracks the FTSE 100 index (the benchmark used to measure the performance of blue-chip UK stocks).
Latest UK CPI: What you need to know
The UK’s consumer price index (CPI) measures headline inflation – the change in prices that UK consumers pay for goods and services.
The CPI rose by 7.9% in June 2023 compared to June 2022 (year-on-year).
This is the first time that the headline CPI number has dropped below the 8% mark since March 2022!
- June’s 7.9% figure was also lower than the market’s forecast of 8.2%.
- June’s CPI growth of 7.9% was also below May’s 8.7% year-on-year figure.
This shows that UK inflation is slowing noticeably, compared to the double-digit figures posted on most months between July 2022 till March 2023, a period when the CPI peaked at 11.1% last October.
What does the lower-than-expected CPI data mean for the BOE?
Markets have now greatly reduced their bets for future rate hikes by the Bank of England (BOE).
Note that the BOE has already raised its benchmark rate by 490 basis points since December 2021.
That’s the BOE’s most aggressive series of rate-hikes since the late-1980s: the same decade when UK CPI was also posting double-digit figures.
The aim for these rate hikes is to subdue UK inflation.
And judging by today’s data release, it appears to be working.
Looking ahead, here’s what markets are predicting at the time of writing as for the BOE’s next moves:
- a less-than-even (43.8%) chance of a larger 50-basis point (bp) hike at the upcoming BOE rate decision due August 3rd.
- a less-than-even (44.7%) chance that the BOE can even proceed with 100-bps in hikes before UK interest rates peak at around 5.8%.
Compare the above odds with what markets had predicted before today’s UK CPI data announcements:
- 69% chance of a 50-bps hike by the BOE in early August
- fully expected a total of 100-bps in hikes by the BOE by May 2024, with a 1-in-3 chance of the total remaining hikes being 125 basis points to send the benchmark rate above 6%!
Hence, with the slashing of the odds surrounding BOE rate hikes, no surprise that the British Pound is weaker today against all of its G10 peers, except for the Japanese Yen:

NOTE: A currency tends to weaken when markets expect that interest rates in that country won’t/can’t move much higher.
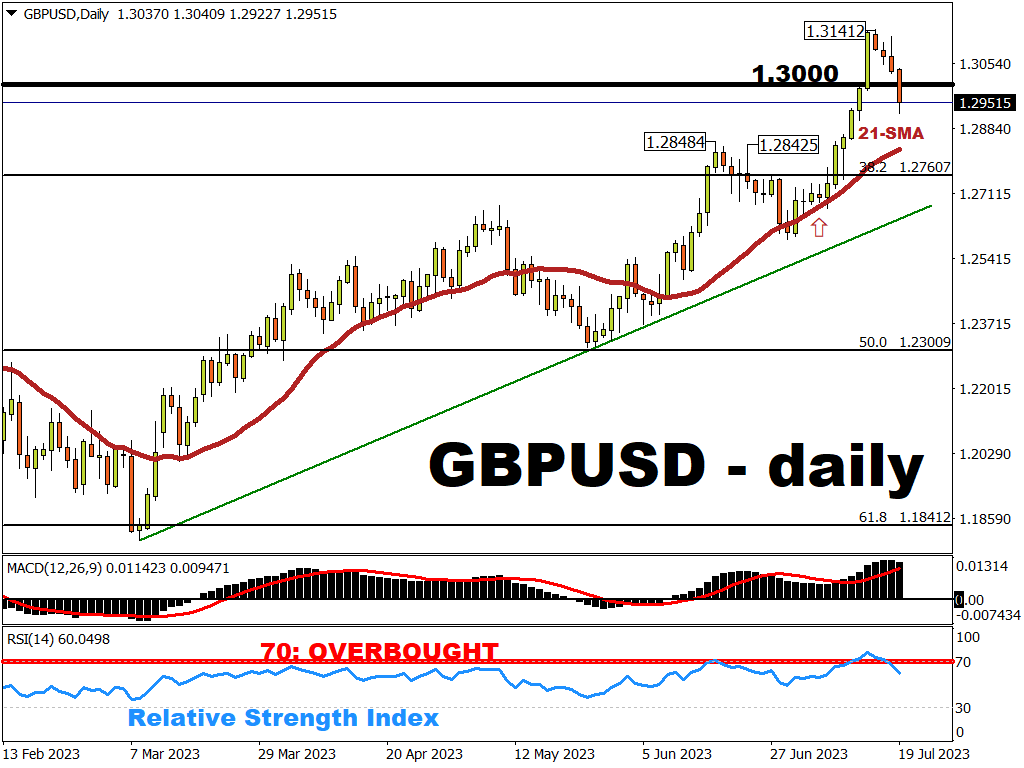
GBPUSD has returned below the psychologically-important 1.300 mark.
How does the Pound affect the UK100_m?
Note that British Pound has an inverse relationship with the UK100_m.
That means that when GBP weakens, then the UK100_m tends to strengthen, and vice versa.
Consider this:
- GBP is the second-best performing G10 currency against the US dollar so far in 2023.
GBPUSD has a year-to-date advance of over 7%, even after today’s declines. - On the other hand, the FTSE 100 index is a clear laggard among benchmark stock indices in developed markets.
The FTSE 100 has climbed a “mere” 8.7% so far this year, while the likes of the S&P 500, the Euro Stoxx 50, and the Nikkei 225 have all risen by double-digits so far this year!
Generally speaking, this inverse relationship between GBPUSD and the UK100_m has shown up 92% of the time on a 3-day rolling period over the past 30 years (according to Bloomberg’s correlation data).
This inverse relationship is due to the fact that companies listed on the FTSE 100 index gets more than 80% of their revenue collectively from outside of the UK, as of October 2022 according to FTSE Russell.
Hence, a weaker Sterling tends to translate into more earnings, in GBP terms, for these FTSE 100 companies.
No surprise then that the UK100_m is climbing higher as GBPUSD is falling.
Technical Perspective: What’s next for UK100_m?
With the forming of a new higher top today, four price targets can be calculated from there.
Attaching the Fibonacci tool to the top at 7565.3 price level and dragging it to a bottom that formed on 7 July at 7222.3, the following potential targets were established:
- Potential Target 1: 7702.5
- Potential Target 2: 7771.1
- Potential Target 3: 7908.3
- Potential Target 4: 8079.8
If the bearish momentum exceeds the bullish, this could cause the price to sharply depreciate below the critical support level that formed on 7 July at 7222.3, consequently invalidating the long setup and triggering a sell signal.
However, from a fundamental perspective, UK100_m bulls (those hoping prices will move higher) would need a drastically weakening GBP, perhaps by way of a shocking announcement by the BOE that its rate hikes are to be soon halted, in order for the UK100_m to attain the psychologically-important 8,000 mark.

The above scenario is based on the FXTM Signals that are posted twice a day (before the London and New York sessions) for all FXTM clients.
This can be accessed from the MyFXTM profile, within the Trading Services section (left-hand bar).
 Article by ForexTime
ForexTime Ltd (FXTM) is an award winning international online forex broker regulated by CySEC 185/12 www.forextime.com