The popularity of the lithium stocks was concentrated on the Australian deals, with the rush starting in 2015 and slowly gaining momentum throughout the 2020-2022 period, with many billions of dollars raised for and committed to lithium carbonate production.
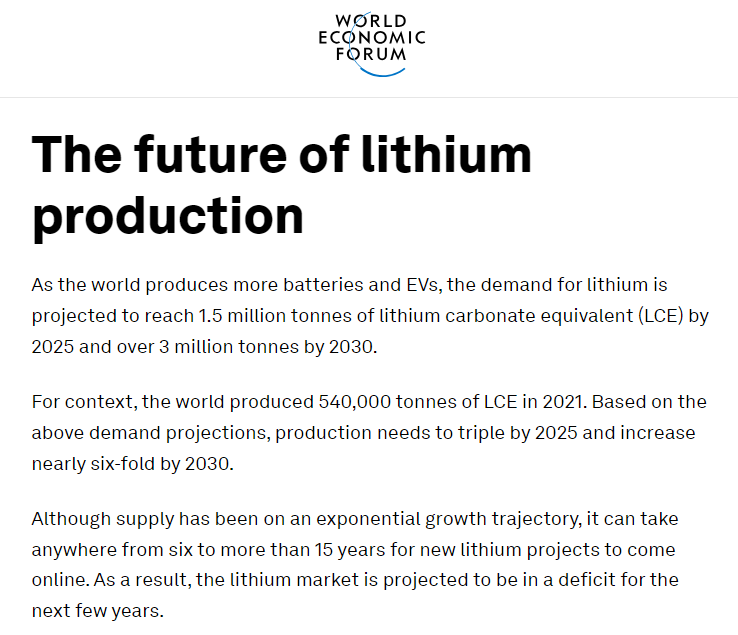
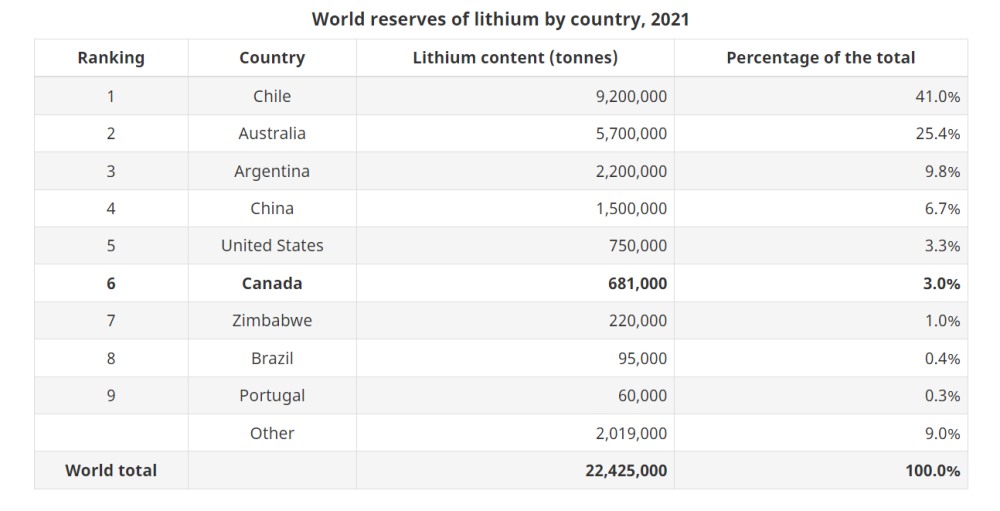
As can be seen from the graphic posted above, lithium demand is growing so rapidly that a tripling of global production will only just keep markets adequately balanced.
Furthermore, despite new discoveries in Canada and Australia, the 6-15 year development time means that companies that can meet demand quickly will be the prime beneficiaries of such demand, which rules out the “miners” but which quickly and dynamically includes the “briners.”
Within that category, those with immediate access to oilfield brines, where infrastructure is already in place, will be the first group to seize the spoils of the supply-demand imbalance, whereas the hard-rock pegmatite developers carry the risk of time in their feasibility studies.
Since stock charts can be quite revealing as to investment trends and prevailing sentiment, look at the chart of hard-rock pegmatite discoverer Patriot Battery Metals Inc. (PMET:CA) whose Corvette Property contains the largest lithium pegmatite deposit in the Americas and the 8th largest globally.
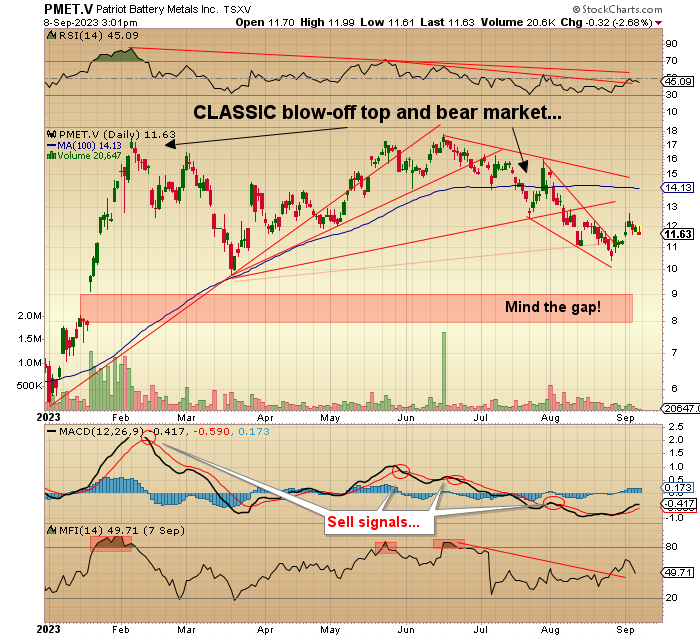
The stock price peaked in June at CA$17.74 and has since declined over 34% as the weight of a CA$1.8 billion market cap met face-to-face with a 6-15-year development window. In other words, no cash flow or similar return to shareholders would be seen until almost 2030 and possibly 2040. PMET is arguably the leader in the field for hard-rock lithium “miners,” and the stock chart suggests that it has peaked, at least on a near-term basis.
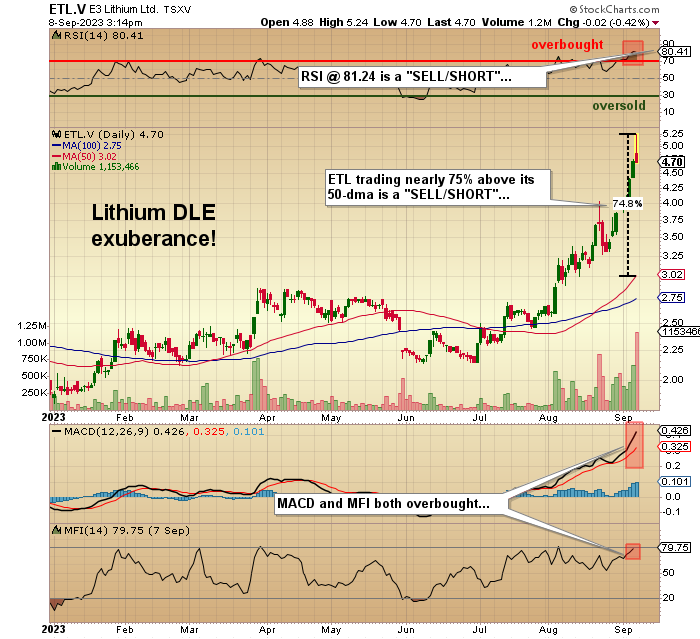
The leader in the oilfield brine extractors (“Direct Lithium Extraction” or “DLE”) is Canadian-based E3 Lithium Ltd. (ETL:TSXV;EEMMF:US), whose share price has seen a substantial leap since the July correction before peaking at CA$5.24 this morning in what appears to be a classic blow-off. However, the stock is the poster child for the “briners” and reached a market cap this morning at almost CA$400 million.
The major question regarding pricing revolves around the proximity to cash flow. Any of the “briners” will be able to produce lithium far more rapidly than will the “miners,” so when comparing the current CA$1.64 billion market cap for PMET to the CA$400 million market cap for ETL, do you assign a greater value on resource size than proximity to cash flow?
As was stated in the Goldman Sachs report, big money has seen how fast a spiking commodity price can attract new supply and how quickly that new supply can derail even the strongest of momentum stories. This, I believe, is why money is rotating out of the “miners” and into the “briners,” so looking at market caps of some of the Aussie lithium deals (all in the A$ billions) against market caps in North America, there is little surprise that money flow is shifting to the “briners.”
I was unable to pick off the lithium story until quite late in the global run in these stocks, so when I discovered that the former Allied Copper Corp. had joined forces with Volt Lithium Corp. (VLT:TSV;VLTLF:US), I was at once both delighted and fearful, as being late to a specific commodity-driven stock party always turns out in disaster.
I know more than a few stock players that got roasted in 2001 with internet stocks and, more recently, in 2018 with the cannabis craze.
Aurora Cannabis Inc. (ACB:NYSE; ACB:TSX) peaked in mid-2018 at nearly CA$200/share before falling out of favor (off the peak of Mt. Everest) today residing at a mere CA$0.71.
So, when I view the market cap of VLT/VLTLF at CAD $64 million versus ETL/EMMFF at CAD $400 million versus PMET at $1.64 billion, I am overwhelmed by the opportunity in front of us.
Could Volt see a market cap comparable to Patriot Battery Metals?
The company has a target of 20,000 tonnes of lithium hydroxide production by mid-2027, carrying a gross revenue (assuming CA$43,000/tonne Li) of CA$860 million against costs of CA$70 million. Pre-tax earnings of CA$790 million on a share count of 200,000,000 of CA$3.95 per share. Assume a 30 multiple, and you arrive at CA$118.50 per share. With 200m shares issued, the market cap would be CA$23.7 billion.
Now, could my projections be based upon either natural-born optimism or hope or well-aimed prayers at the deity of my choosing?
To a degree, yes, but I am also a realist and a trained finance major who understands the elasticity of valuations based on cash flow generation. Most of the more speculative deals I have done in my career have been a Getchell-type analysis where the in-ground metal value of the resource takes precedence over cash flow proximity. In the case of both PMET and ETL, they are promoting resource size over cash flow proximity. In the case of Volt, it is precisely its proximity to cash flow generation that sets it apart.
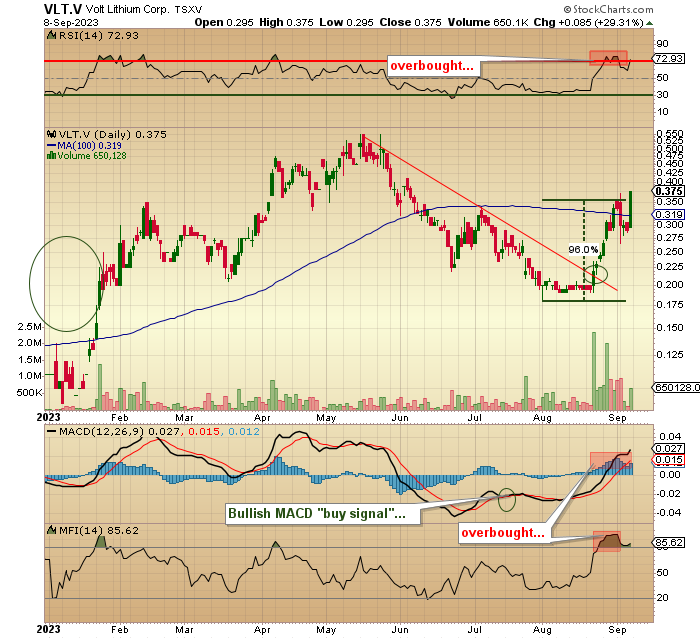
The stock went out at CA$0.375 tonight, which was up 41.5% from the weekly lows and remains up 172.73% year-to-date.
Volt Lithium Corp. remains a “Strong Buy” despite the “overbought” readings and based upon the relatively low comparative market capitalization.
Important Disclosures:
- Volt Lithium Corp. has a consulting relationship with an affiliate of Streetwise Reports, and pays a monthly consulting fee between US$8,000 and US$20,000.
- As of the date of this article, officers and/or employees of Streetwise Reports LLC (including members of their household) own securities of Volt Lithium Corp.
- Michael Ballanger: I, or members of my immediate household or family, own securities of: All. My company has a financial relationship with Volt Lithium Corp. I determined which companies would be included in this article based on my research and understanding of the sector.
- Statements and opinions expressed are the opinions of the author and not of Streetwise Reports or its officers. The author is wholly responsible for the validity of the statements. The author was not paid by Streetwise Reports for this article. Streetwise Reports was not paid by the author to publish or syndicate this article. Streetwise Reports requires contributing authors to disclose any shareholdings in, or economic relationships with, companies that they write about. Streetwise Reports relies upon the authors to accurately provide this information and Streetwise Reports has no means of verifying its accuracy.
- This article does not constitute investment advice. Each reader is encouraged to consult with his or her individual financial professional. By opening this page, each reader accepts and agrees to Streetwise Reports’ terms of use and full legal disclaimer. This article is not a solicitation for investment. Streetwise Reports does not render general or specific investment advice and the information on Streetwise Reports should not be considered a recommendation to buy or sell any security. Streetwise Reports does not endorse or recommend the business, products, services or securities of any company.
For additional disclosures, please click here
Michael Ballanger Disclosures
This letter makes no guarantee or warranty on the accuracy or completeness of the data provided. Nothing contained herein is intended or shall be deemed to be investment advice, implied or otherwise. This letter represents my views and replicates trades that I am making but nothing more than that. Always consult your registered advisor to assist you with your investments. I accept no liability for any loss arising from the use of the data contained on this letter. Options and junior mining stocks contain a high level of risk that may result in the loss of part or all invested capital and therefore are suitable for experienced and professional investors and traders only. One should be familiar with the risks involved in junior mining and options trading and we recommend consulting a financial adviser if you feel you do not understand the risks involved.