By InvestMacro
Here are the latest charts and statistics for the Commitment of Traders (COT) reports data published by the Commodities Futures Trading Commission (CFTC).
The latest COT data is updated through Tuesday September 5th and shows a quick view of how large traders (for-profit speculators and commercial entities) were positioned in the futures markets.
Weekly Speculator Changes led by Sugar & Cotton
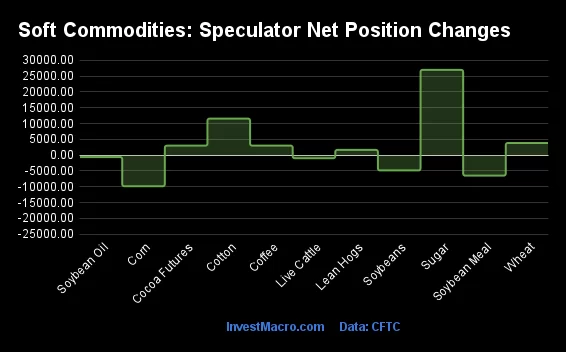
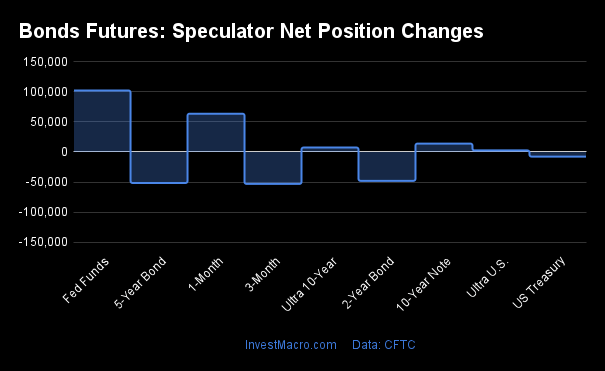
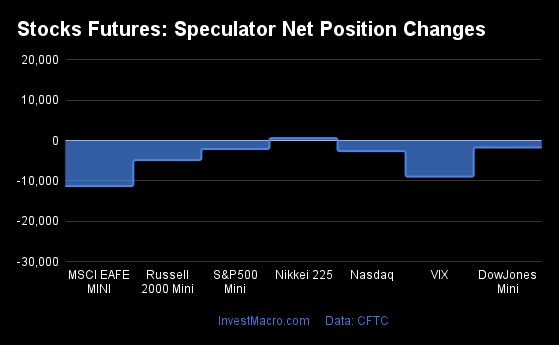
The COT soft commodities markets speculator bets were lower this week as five out of the eleven softs markets we cover had higher positioning while the other six markets had lower speculator contracts.
Leading the gains for the softs markets was Sugar (26,991 contracts) with Cotton (11,560 contracts), Wheat (3,847 contracts), Cocoa (2,999 contracts) and Lean Hogs (1,659 contracts) also showing positive weeks.
The markets with the declines in speculator bets this week were Coffee (-18,522 contracts) with Corn (-9,819 contracts), Soybean Meal (-6,481 contracts), Soybeans (-4,833 contracts), Soybean Oil (-619 contracts) and Live Cattle (-976 contracts) also registering lower bets on the week.
| Sep-05-2023 | OI | OI-Index | Spec-Net | Spec-Index | Com-Net | COM-Index | Smalls-Net | Smalls-Index |
|---|
| WTI Crude | 1,703,130 | 27 | 299,322 | 40 | -308,997 | 67 | 9,675 | 0 |
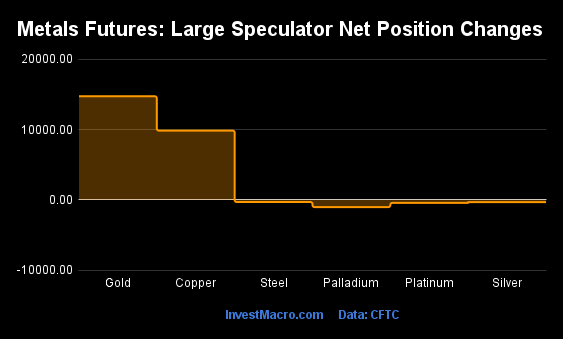
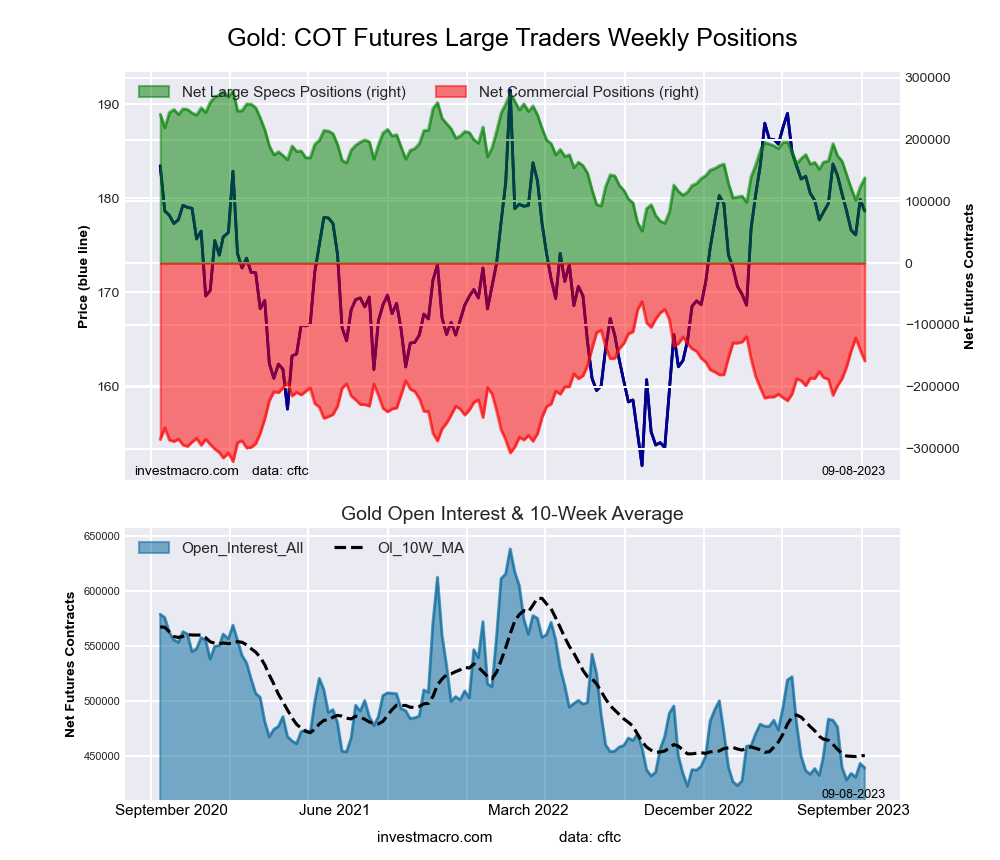
| Gold | 438,672 | 8 | 138,006 | 38 | -158,239 | 63 | 20,233 | 31 |
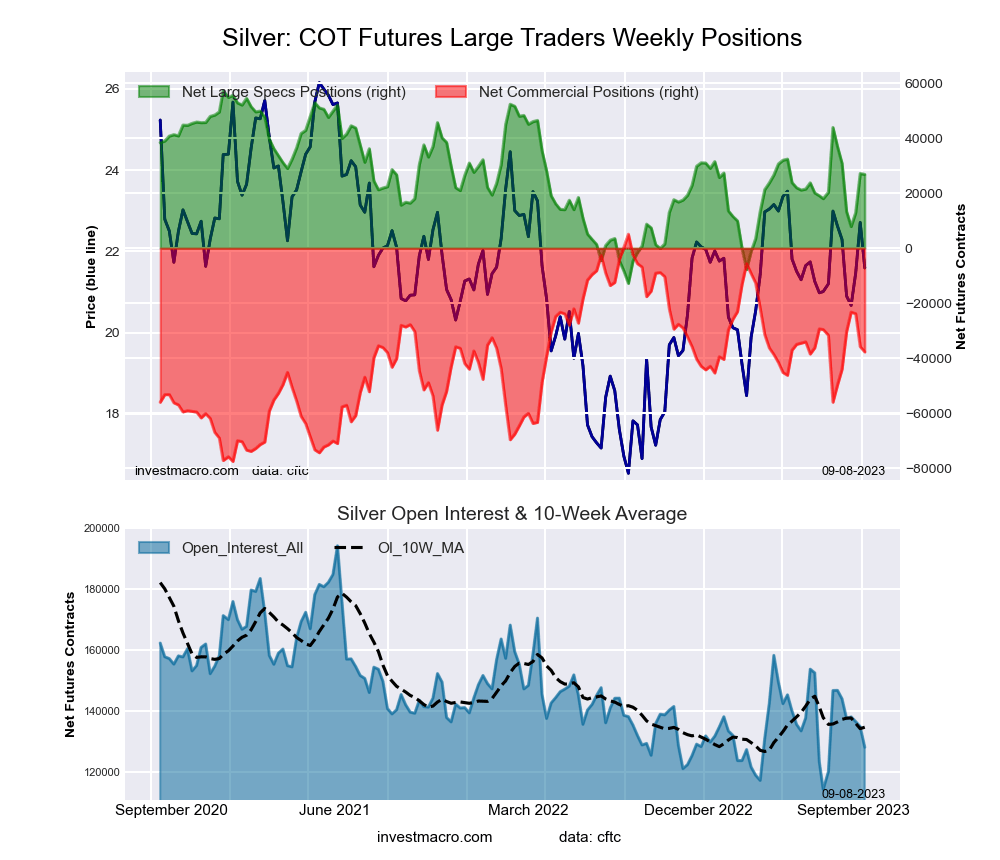
| Silver | 128,279 | 17 | 26,804 | 56 | -37,708 | 48 | 10,904 | 27 |
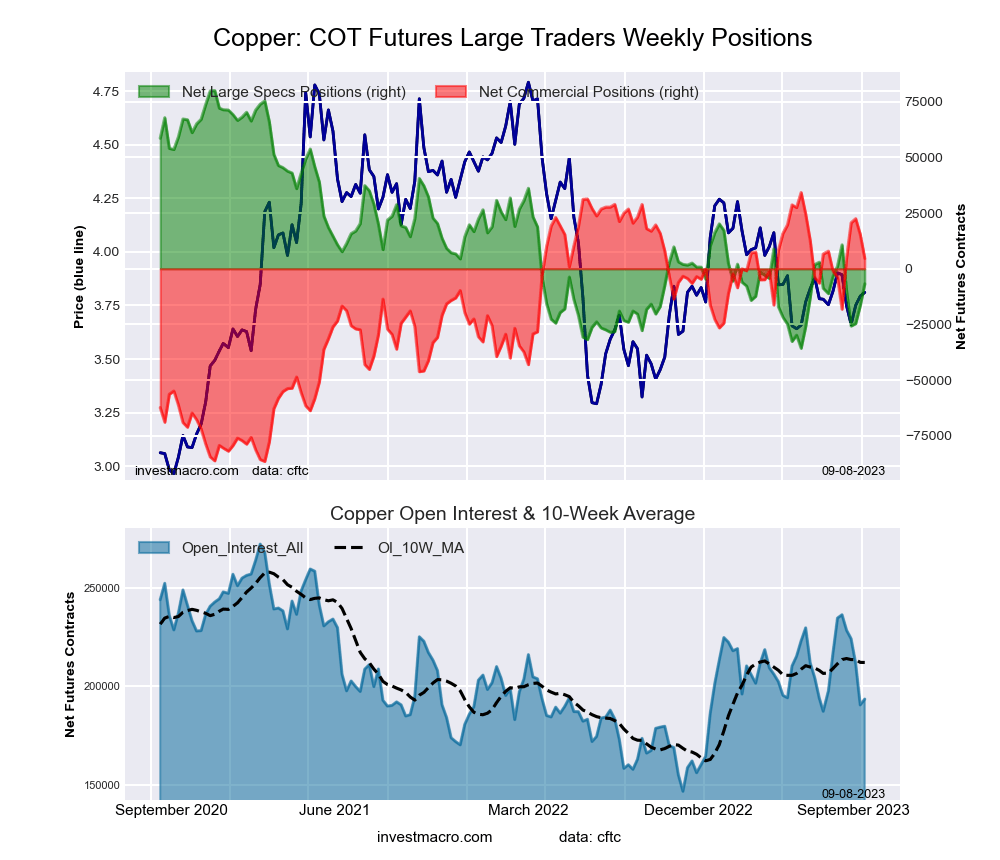
| Copper | 193,597 | 37 | -6,770 | 25 | 4,659 | 75 | 2,111 | 32 |
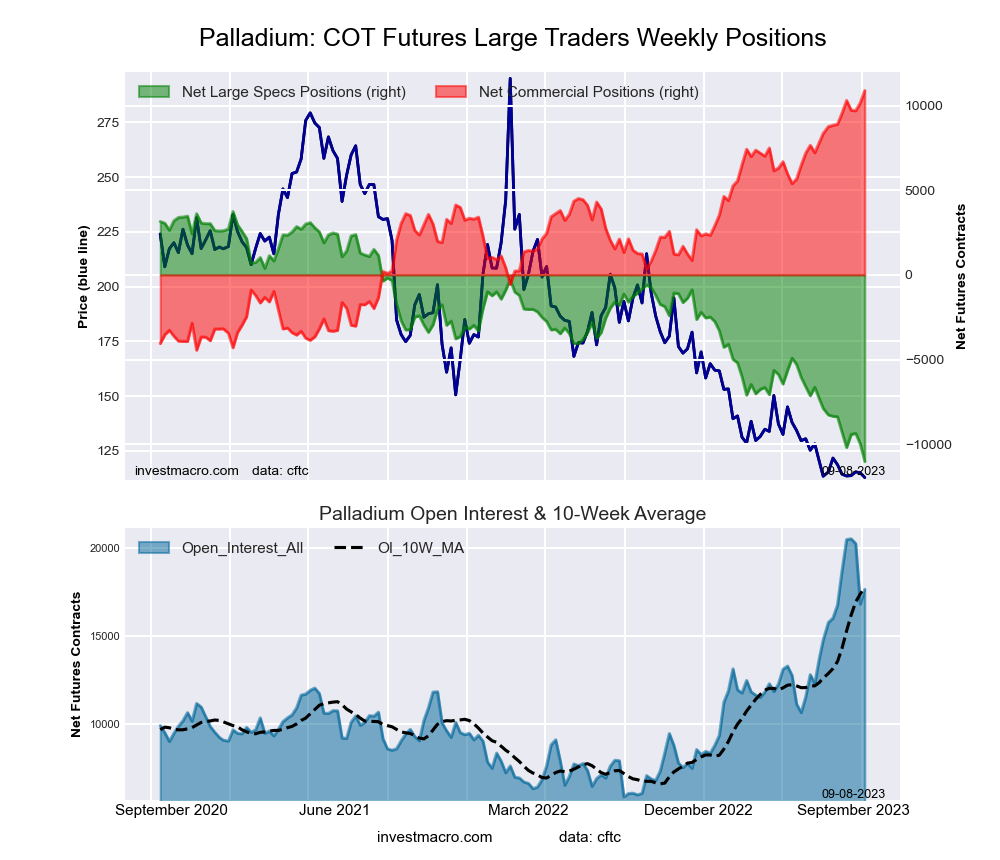
| Palladium | 17,644 | 80 | -11,021 | 0 | 10,888 | 100 | 133 | 50 |
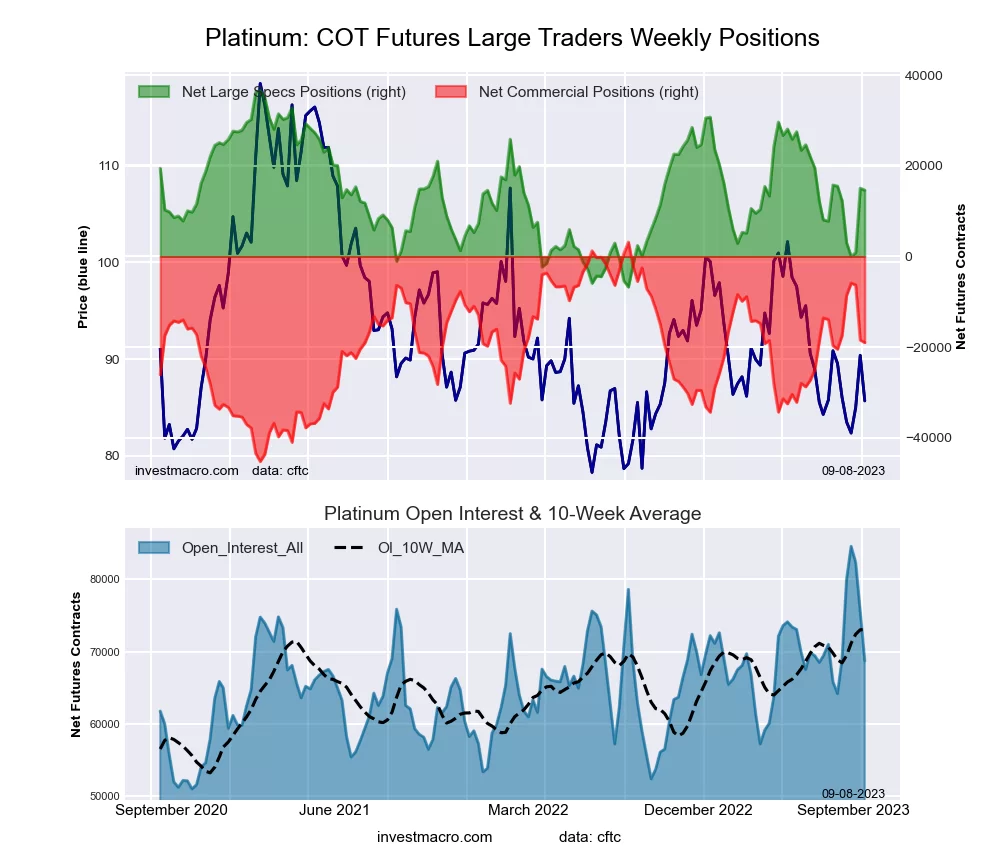
| Platinum | 68,721 | 53 | 14,602 | 49 | -19,001 | 54 | 4,399 | 27 |
| Natural Gas | 1,169,725 | 43 | -118,279 | 25 | 90,716 | 76 | 27,563 | 45 |
| Brent | 129,417 | 7 | -44,682 | 24 | 44,226 | 83 | 456 | 15 |
| Heating Oil | 319,491 | 44 | 38,737 | 96 | -67,126 | 0 | 28,389 | 97 |
| Soybeans | 716,200 | 31 | 87,329 | 23 | -68,843 | 73 | -18,486 | 60 |
| Corn | 1,229,700 | 5 | -45,632 | 3 | 79,965 | 94 | -34,333 | 84 |
| Coffee | 180,118 | 3 | 8,495 | 36 | -8,052 | 68 | -443 | 7 |
| Sugar | 966,992 | 63 | 235,421 | 74 | -289,805 | 21 | 54,384 | 73 |
| Wheat | 376,770 | 53 | -46,410 | 34 | 44,160 | 64 | 2,250 | 78 |
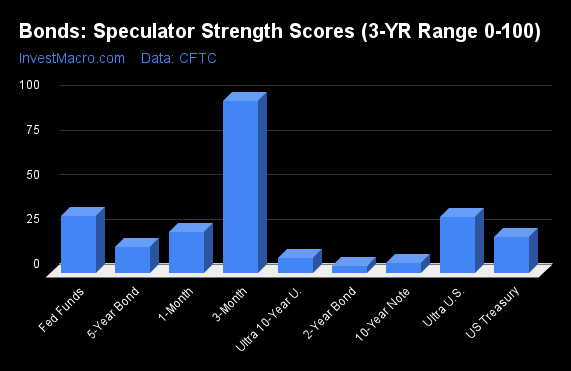
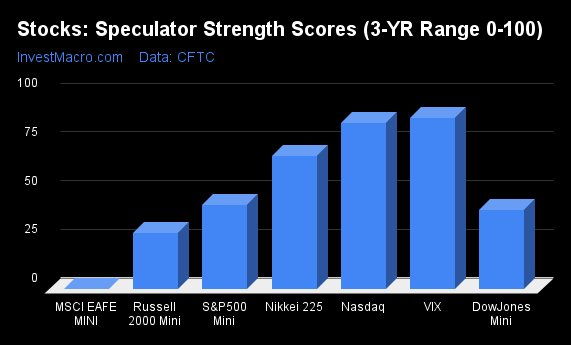
Strength Scores led by Cocoa & Sugar
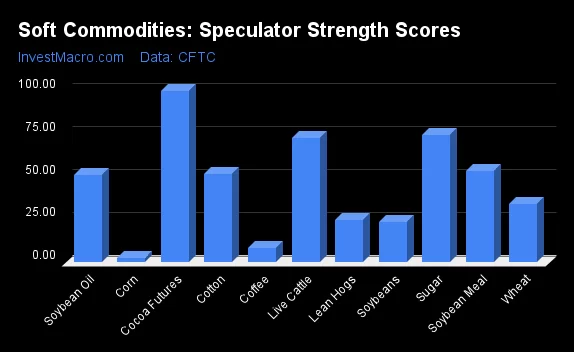
COT Strength Scores (a normalized measure of Speculator positions over a 3-Year range, from 0 to 100 where above 80 is Extreme-Bullish and below 20 is Extreme-Bearish) showed that Cocoa (100 percent) and Sugar (74 percent) lead the softs markets this week. Live Cattle (72 percent), Soybean Meal (53 percent) and Soybean Oil (51 percent) come in as the next highest in the weekly strength scores.
On the downside, Corn (3 percent) and Soybeans (23 percent) come in at the lowest strength levels currently and are in Extreme-Bearish territory (below 20 percent). The next lowest strength scores are the Lean Hogs (25 percent) and the Wheat (34 percent).
Strength Statistics:
Corn (2.7 percent) vs Corn previous week (4.3 percent)
Sugar (74.1 percent) vs Sugar previous week (64.6 percent)
Coffee (36.1 percent) vs Coffee previous week (61.8 percent)
Soybeans (23.5 percent) vs Soybeans previous week (25.4 percent)
Soybean Oil (50.6 percent) vs Soybean Oil previous week (50.9 percent)
Soybean Meal (53.1 percent) vs Soybean Meal previous week (56.7 percent)
Live Cattle (72.2 percent) vs Live Cattle previous week (73.3 percent)
Lean Hogs (24.6 percent) vs Lean Hogs previous week (23.3 percent)
Cotton (51.2 percent) vs Cotton previous week (42.5 percent)
Cocoa (100.0 percent) vs Cocoa previous week (96.9 percent)
Wheat (33.8 percent) vs Wheat previous week (31.1 percent)
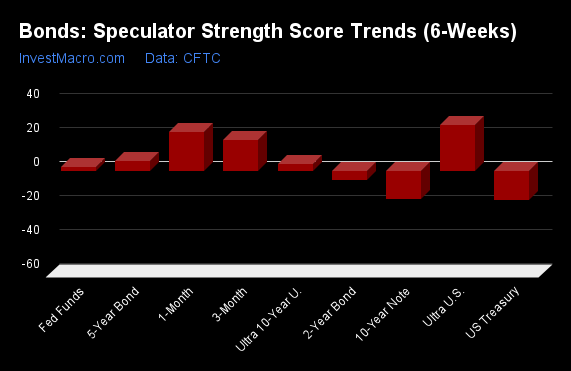
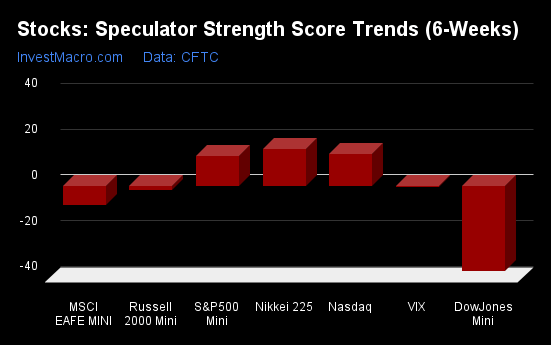
Cotton & Cocoa top the 6-Week Strength Trends
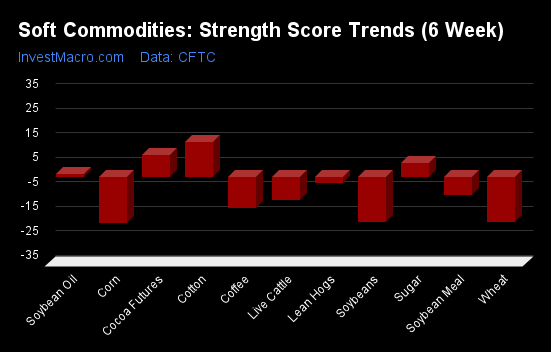
COT Strength Score Trends (or move index, calculates the 6-week changes in strength scores) showed that Cotton (14 percent) and Cocoa (9 percent) lead the past six weeks trends for soft commodities. Sugar (6 percent), Soybean Oil (1 percent) and Lean Hogs (-3 percent) are the next highest positive movers in the latest trends data.
Coffee (-23 percent) leads the downside trend scores currently with Corn (-19 percent), Soybeans (-19 percent) and Wheat (-18 percent) following next with lower trend scores.
Strength Trend Statistics:
Corn (-19.0 percent) vs Corn previous week (-9.1 percent)
Sugar (5.5 percent) vs Sugar previous week (4.3 percent)
Coffee (-23.1 percent) vs Coffee previous week (-0.0 percent)
Soybeans (-18.7 percent) vs Soybeans previous week (-5.9 percent)
Soybean Oil (1.1 percent) vs Soybean Oil previous week (8.7 percent)
Soybean Meal (-7.6 percent) vs Soybean Meal previous week (1.1 percent)
Live Cattle (-9.5 percent) vs Live Cattle previous week (-18.7 percent)
Lean Hogs (-2.6 percent) vs Lean Hogs previous week (-3.1 percent)
Cotton (13.9 percent) vs Cotton previous week (19.8 percent)
Cocoa (8.7 percent) vs Cocoa previous week (7.0 percent)
Wheat (-18.4 percent) vs Wheat previous week (-8.2 percent)
Individual Soft Commodities Markets:
CORN Futures:
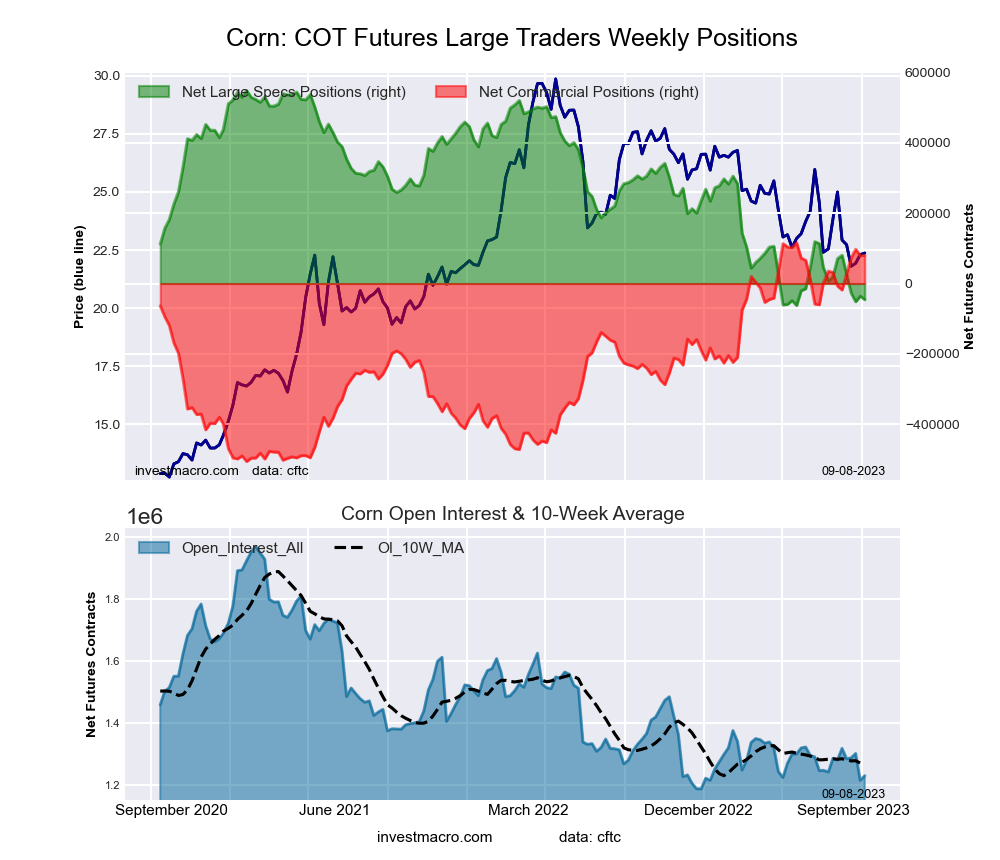 The CORN large speculator standing this week reached a net position of -45,632 contracts in the data reported through Tuesday. This was a weekly fall of -9,819 contracts from the previous week which had a total of -35,813 net contracts.
This week’s current strength score (the trader positioning range over the past three years, measured from 0 to 100) shows the speculators are currently Bearish-Extreme with a score of 2.7 percent. The commercials are Bullish-Extreme with a score of 94.2 percent and the small traders (not shown in chart) are Bullish-Extreme with a score of 83.6 percent.
Price Trend-Following Model: Strong Downtrend
Our weekly trend-following model classifies the current market price position as: Strong Downtrend. The current action for the model is considered to be: Hold – Maintain Short Position.
| CORN Futures Statistics | SPECULATORS | COMMERCIALS | SMALL TRADERS |
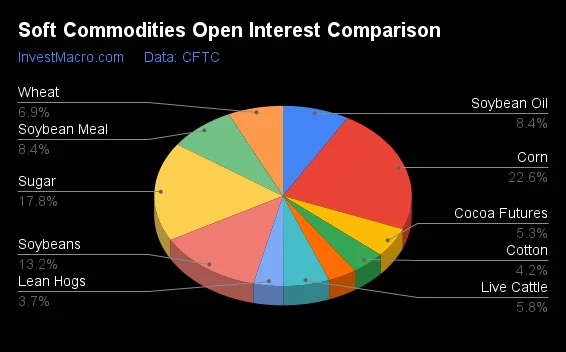
| – Percent of Open Interest Longs: | 22.6 | 48.9 | 10.2 |
| – Percent of Open Interest Shorts: | 26.3 | 42.4 | 13.0 |
| – Net Position: | -45,632 | 79,965 | -34,333 |
| – Gross Longs: | 278,322 | 601,098 | 125,742 |
| – Gross Shorts: | 323,954 | 521,133 | 160,075 |
| – Long to Short Ratio: | 0.9 to 1 | 1.2 to 1 | 0.8 to 1 |
| NET POSITION TREND: | | | |
| – Strength Index Score (3 Year Range Pct): | 2.7 | 94.2 | 83.6 |
| – Strength Index Reading (3 Year Range): | Bearish-Extreme | Bullish-Extreme | Bullish-Extreme |
| NET POSITION MOVEMENT INDEX: | | | |
| – 6-Week Change in Strength Index: | -19.0 | 14.0 | 52.2 |
SUGAR Futures:
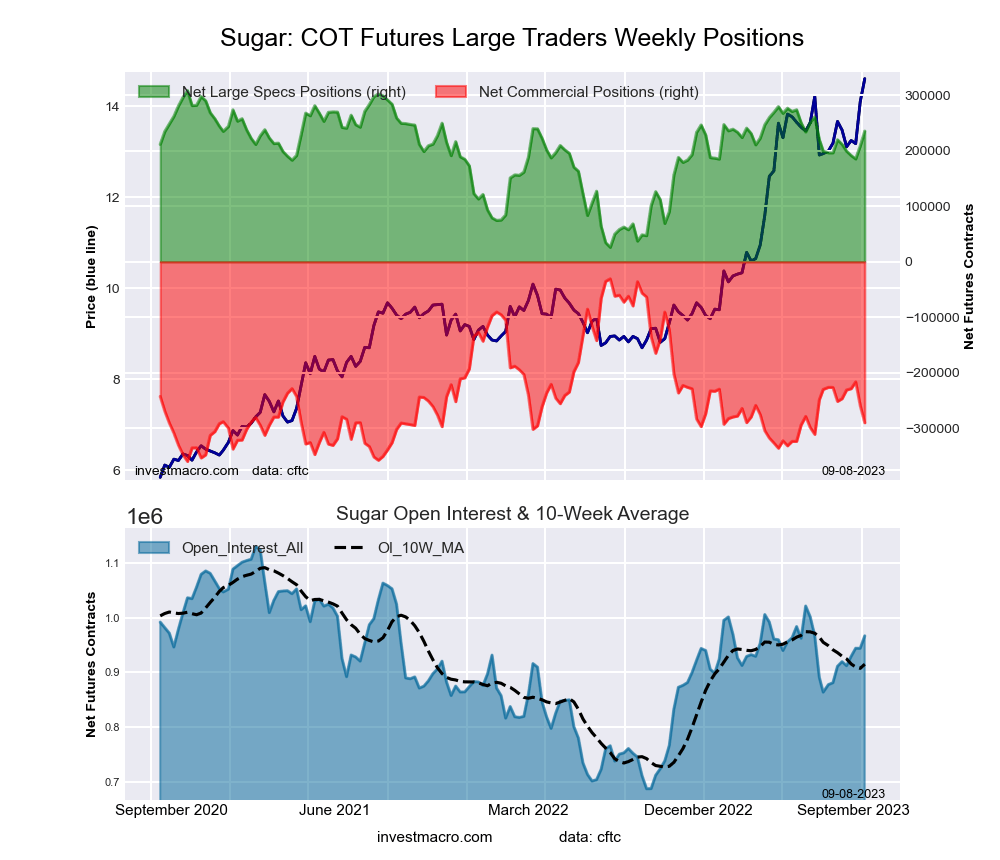 The SUGAR large speculator standing this week reached a net position of 235,421 contracts in the data reported through Tuesday. This was a weekly gain of 26,991 contracts from the previous week which had a total of 208,430 net contracts.
This week’s current strength score (the trader positioning range over the past three years, measured from 0 to 100) shows the speculators are currently Bullish with a score of 74.1 percent. The commercials are Bearish with a score of 21.2 percent and the small traders (not shown in chart) are Bullish with a score of 73.5 percent.
Price Trend-Following Model: Strong Uptrend
Our weekly trend-following model classifies the current market price position as: Strong Uptrend. The current action for the model is considered to be: Hold – Maintain Long Position.
| SUGAR Futures Statistics | SPECULATORS | COMMERCIALS | SMALL TRADERS |
| – Percent of Open Interest Longs: | 32.8 | 42.9 | 10.2 |
| – Percent of Open Interest Shorts: | 8.5 | 72.9 | 4.6 |
| – Net Position: | 235,421 | -289,805 | 54,384 |
| – Gross Longs: | 317,572 | 415,119 | 98,808 |
| – Gross Shorts: | 82,151 | 704,924 | 44,424 |
| – Long to Short Ratio: | 3.9 to 1 | 0.6 to 1 | 2.2 to 1 |
| NET POSITION TREND: | | | |
| – Strength Index Score (3 Year Range Pct): | 74.1 | 21.2 | 73.5 |
| – Strength Index Reading (3 Year Range): | Bullish | Bearish | Bullish |
| NET POSITION MOVEMENT INDEX: | | | |
| – 6-Week Change in Strength Index: | 5.5 | -11.7 | 30.0 |
COFFEE Futures:
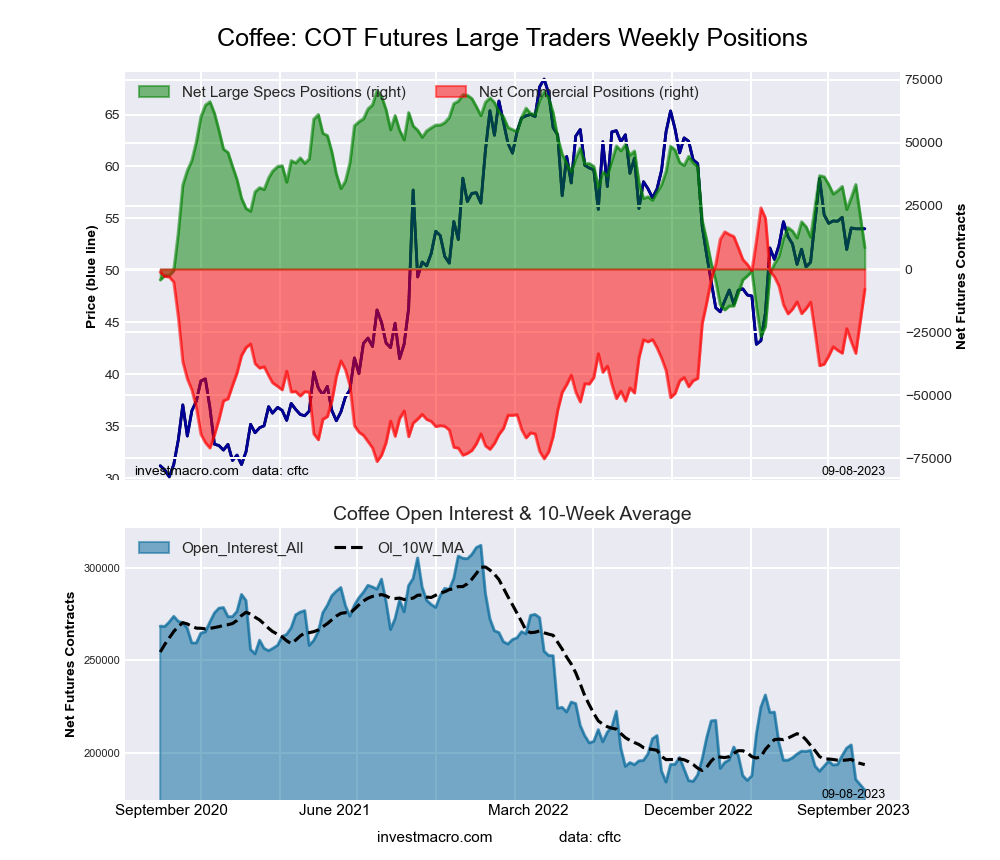 The COFFEE large speculator standing this week reached a net position of 8,495 contracts in the data reported through Tuesday. This was a weekly reduction of -18,522 contracts from the previous week which had a total of 33,494 net contracts.
This week’s current strength score (the trader positioning range over the past three years, measured from 0 to 100) shows the speculators are currently Bearish with a score of 36.1 percent. The commercials are Bullish with a score of 67.9 percent and the small traders (not shown in chart) are Bearish-Extreme with a score of 7.3 percent.
Price Trend-Following Model: Uptrend
Our weekly trend-following model classifies the current market price position as: Uptrend. The current action for the model is considered to be: Hold – Maintain Long Position.
| COFFEE Futures Statistics | SPECULATORS | COMMERCIALS | SMALL TRADERS |
| – Percent of Open Interest Longs: | 23.4 | 47.0 | 3.7 |
| – Percent of Open Interest Shorts: | 18.7 | 51.4 | 3.9 |
| – Net Position: | 8,495 | -8,052 | -443 |
| – Gross Longs: | 42,190 | 84,606 | 6,662 |
| – Gross Shorts: | 33,695 | 92,658 | 7,105 |
| – Long to Short Ratio: | 1.3 to 1 | 0.9 to 1 | 0.9 to 1 |
| NET POSITION TREND: | | | |
| – Strength Index Score (3 Year Range Pct): | 36.1 | 67.9 | 7.3 |
| – Strength Index Reading (3 Year Range): | Bearish | Bullish | Bearish-Extreme |
| NET POSITION MOVEMENT INDEX: | | | |
| – 6-Week Change in Strength Index: | -23.1 | 24.0 | -19.8 |
SOYBEANS Futures:
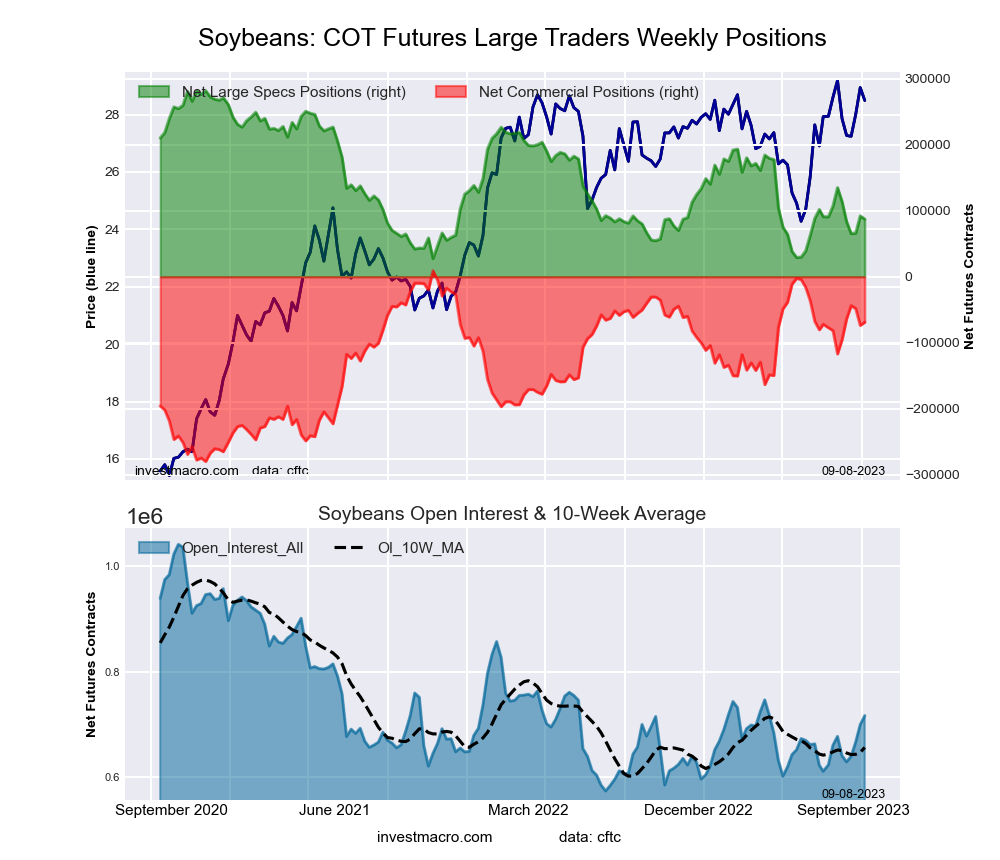 The SOYBEANS large speculator standing this week reached a net position of 87,329 contracts in the data reported through Tuesday. This was a weekly decrease of -4,833 contracts from the previous week which had a total of 92,162 net contracts.
This week’s current strength score (the trader positioning range over the past three years, measured from 0 to 100) shows the speculators are currently Bearish with a score of 23.5 percent. The commercials are Bullish with a score of 73.0 percent and the small traders (not shown in chart) are Bullish with a score of 59.5 percent.
Price Trend-Following Model: Uptrend
Our weekly trend-following model classifies the current market price position as: Uptrend. The current action for the model is considered to be: Hold – Maintain Long Position.
| SOYBEANS Futures Statistics | SPECULATORS | COMMERCIALS | SMALL TRADERS |
| – Percent of Open Interest Longs: | 22.5 | 51.4 | 6.8 |
| – Percent of Open Interest Shorts: | 10.4 | 61.0 | 9.4 |
| – Net Position: | 87,329 | -68,843 | -18,486 |
| – Gross Longs: | 161,468 | 368,024 | 48,992 |
| – Gross Shorts: | 74,139 | 436,867 | 67,478 |
| – Long to Short Ratio: | 2.2 to 1 | 0.8 to 1 | 0.7 to 1 |
| NET POSITION TREND: | | | |
| – Strength Index Score (3 Year Range Pct): | 23.5 | 73.0 | 59.5 |
| – Strength Index Reading (3 Year Range): | Bearish | Bullish | Bullish |
| NET POSITION MOVEMENT INDEX: | | | |
| – 6-Week Change in Strength Index: | -18.7 | 16.6 | -0.9 |
SOYBEAN OIL Futures:
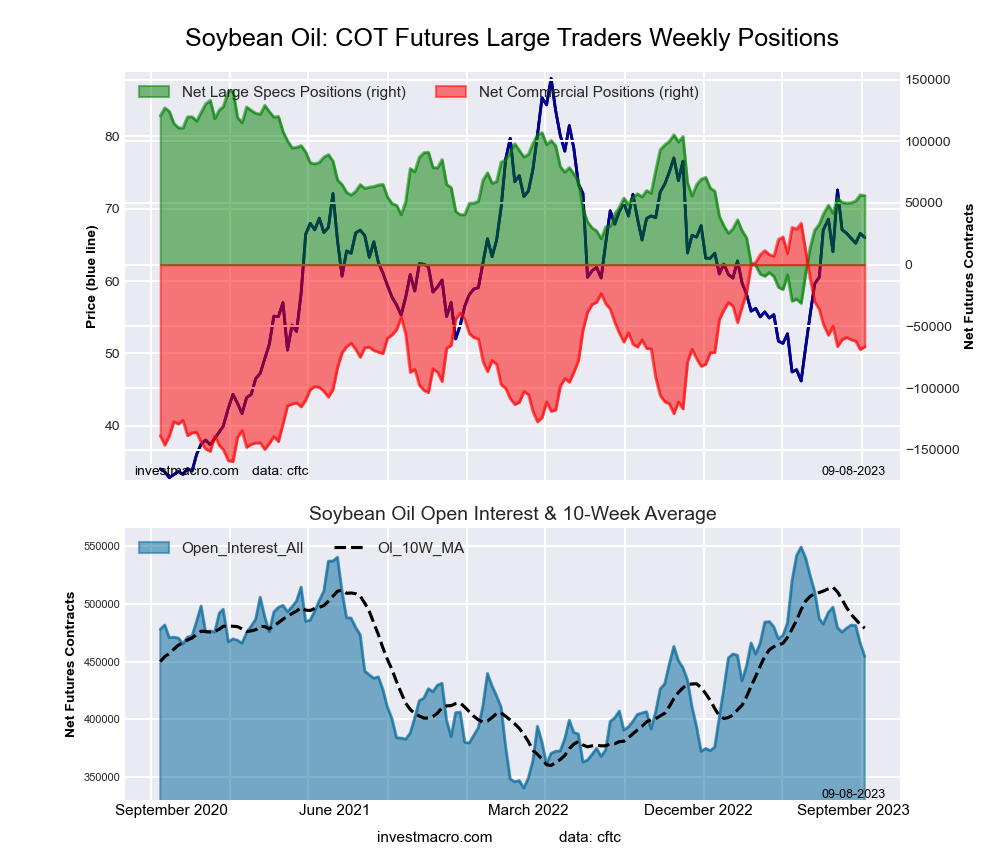 The SOYBEAN OIL large speculator standing this week reached a net position of 55,935 contracts in the data reported through Tuesday. This was a weekly decrease of -619 contracts from the previous week which had a total of 56,554 net contracts.
This week’s current strength score (the trader positioning range over the past three years, measured from 0 to 100) shows the speculators are currently Bullish with a score of 50.6 percent. The commercials are Bearish with a score of 48.2 percent and the small traders (not shown in chart) are Bullish with a score of 52.9 percent.
Price Trend-Following Model: Uptrend
Our weekly trend-following model classifies the current market price position as: Uptrend. The current action for the model is considered to be: Hold – Maintain Long Position.
| SOYBEAN OIL Futures Statistics | SPECULATORS | COMMERCIALS | SMALL TRADERS |
| – Percent of Open Interest Longs: | 23.3 | 50.6 | 7.5 |
| – Percent of Open Interest Shorts: | 11.0 | 65.2 | 5.2 |
| – Net Position: | 55,935 | -66,483 | 10,548 |
| – Gross Longs: | 105,904 | 229,775 | 34,049 |
| – Gross Shorts: | 49,969 | 296,258 | 23,501 |
| – Long to Short Ratio: | 2.1 to 1 | 0.8 to 1 | 1.4 to 1 |
| NET POSITION TREND: | | | |
| – Strength Index Score (3 Year Range Pct): | 50.6 | 48.2 | 52.9 |
| – Strength Index Reading (3 Year Range): | Bullish | Bearish | Bullish |
| NET POSITION MOVEMENT INDEX: | | | |
| – 6-Week Change in Strength Index: | 1.1 | -0.1 | -6.1 |
SOYBEAN MEAL Futures:
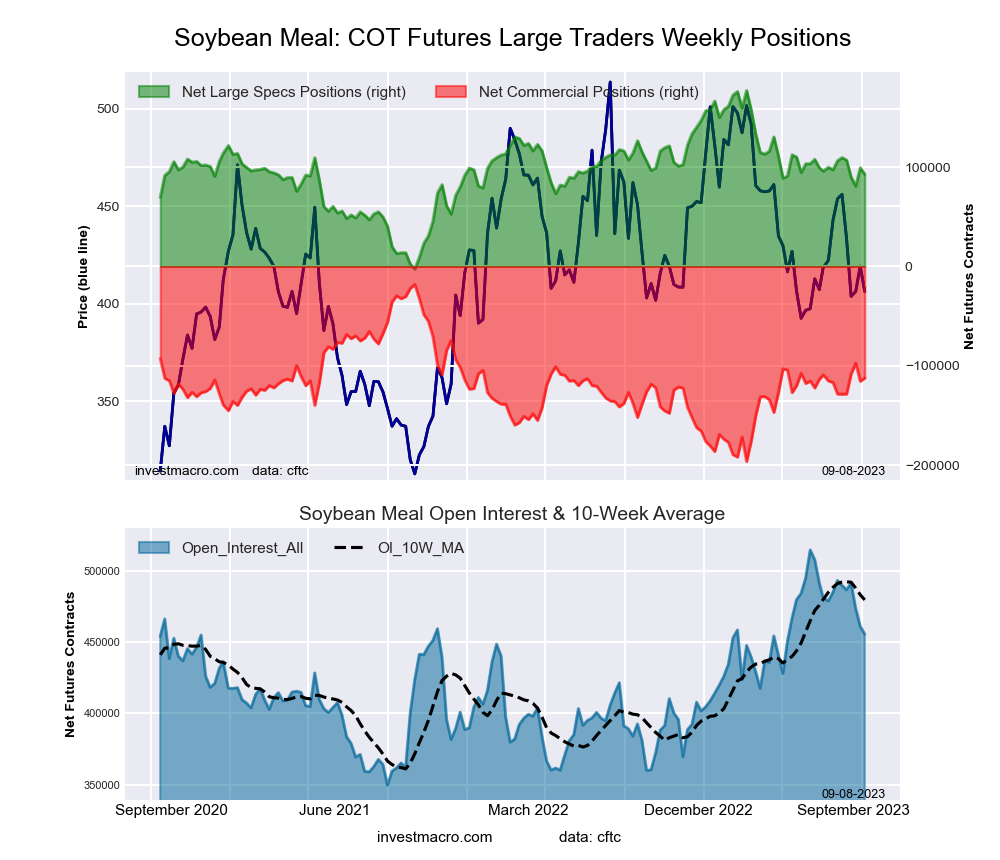 The SOYBEAN MEAL large speculator standing this week reached a net position of 92,750 contracts in the data reported through Tuesday. This was a weekly fall of -6,481 contracts from the previous week which had a total of 99,231 net contracts.
This week’s current strength score (the trader positioning range over the past three years, measured from 0 to 100) shows the speculators are currently Bullish with a score of 53.1 percent. The commercials are Bearish with a score of 47.1 percent and the small traders (not shown in chart) are Bearish with a score of 42.7 percent.
Price Trend-Following Model: Weak Uptrend
Our weekly trend-following model classifies the current market price position as: Weak Uptrend. The current action for the model is considered to be: New Buy – Long Position.
| SOYBEAN MEAL Futures Statistics | SPECULATORS | COMMERCIALS | SMALL TRADERS |
| – Percent of Open Interest Longs: | 24.1 | 39.1 | 9.9 |
| – Percent of Open Interest Shorts: | 3.8 | 63.8 | 5.6 |
| – Net Position: | 92,750 | -112,190 | 19,440 |
| – Gross Longs: | 109,916 | 178,230 | 44,988 |
| – Gross Shorts: | 17,166 | 290,420 | 25,548 |
| – Long to Short Ratio: | 6.4 to 1 | 0.6 to 1 | 1.8 to 1 |
| NET POSITION TREND: | | | |
| – Strength Index Score (3 Year Range Pct): | 53.1 | 47.1 | 42.7 |
| – Strength Index Reading (3 Year Range): | Bullish | Bearish | Bearish |
| NET POSITION MOVEMENT INDEX: | | | |
| – 6-Week Change in Strength Index: | -7.6 | 9.1 | -11.4 |
LIVE CATTLE Futures:
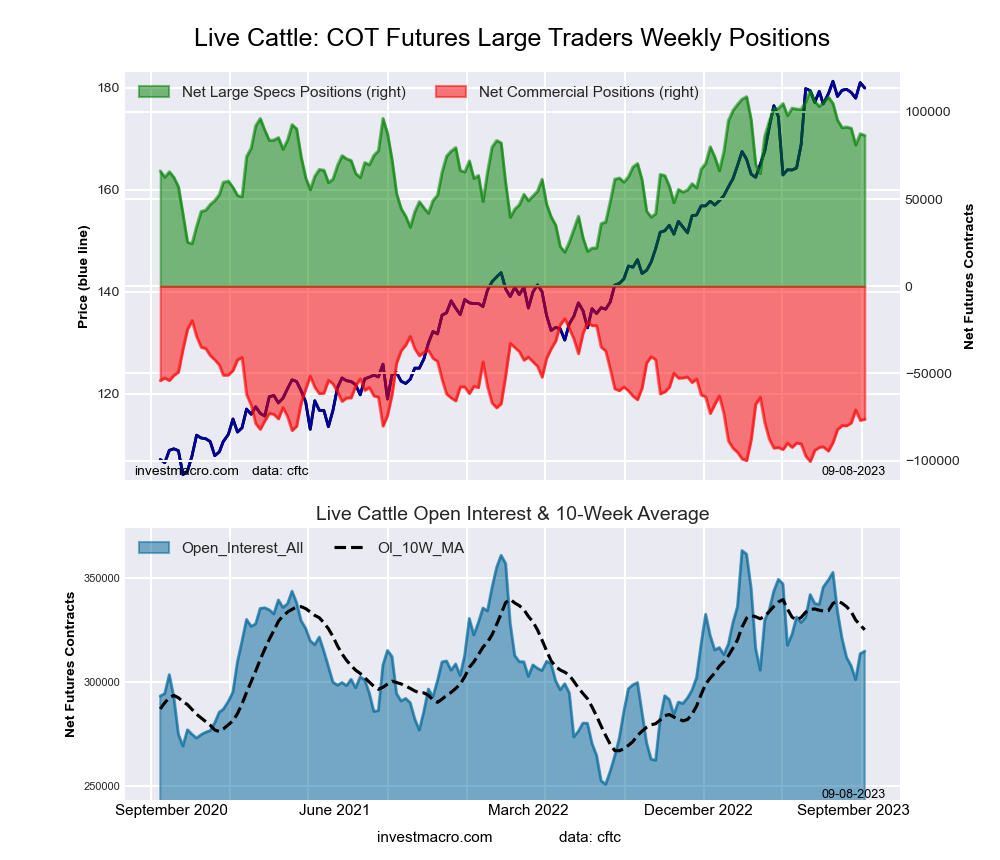 The LIVE CATTLE large speculator standing this week reached a net position of 86,489 contracts in the data reported through Tuesday. This was a weekly lowering of -976 contracts from the previous week which had a total of 87,465 net contracts.
This week’s current strength score (the trader positioning range over the past three years, measured from 0 to 100) shows the speculators are currently Bullish with a score of 72.2 percent. The commercials are Bearish with a score of 29.5 percent and the small traders (not shown in chart) are Bearish with a score of 32.7 percent.
Price Trend-Following Model: Uptrend
Our weekly trend-following model classifies the current market price position as: Uptrend. The current action for the model is considered to be: Hold – Maintain Long Position.
| LIVE CATTLE Futures Statistics | SPECULATORS | COMMERCIALS | SMALL TRADERS |
| – Percent of Open Interest Longs: | 42.6 | 28.5 | 9.1 |
| – Percent of Open Interest Shorts: | 15.2 | 52.7 | 12.3 |
| – Net Position: | 86,489 | -76,291 | -10,198 |
| – Gross Longs: | 134,205 | 89,585 | 28,644 |
| – Gross Shorts: | 47,716 | 165,876 | 38,842 |
| – Long to Short Ratio: | 2.8 to 1 | 0.5 to 1 | 0.7 to 1 |
| NET POSITION TREND: | | | |
| – Strength Index Score (3 Year Range Pct): | 72.2 | 29.5 | 32.7 |
| – Strength Index Reading (3 Year Range): | Bullish | Bearish | Bearish |
| NET POSITION MOVEMENT INDEX: | | | |
| – 6-Week Change in Strength Index: | -9.5 | 7.1 | 16.6 |
LEAN HOGS Futures:
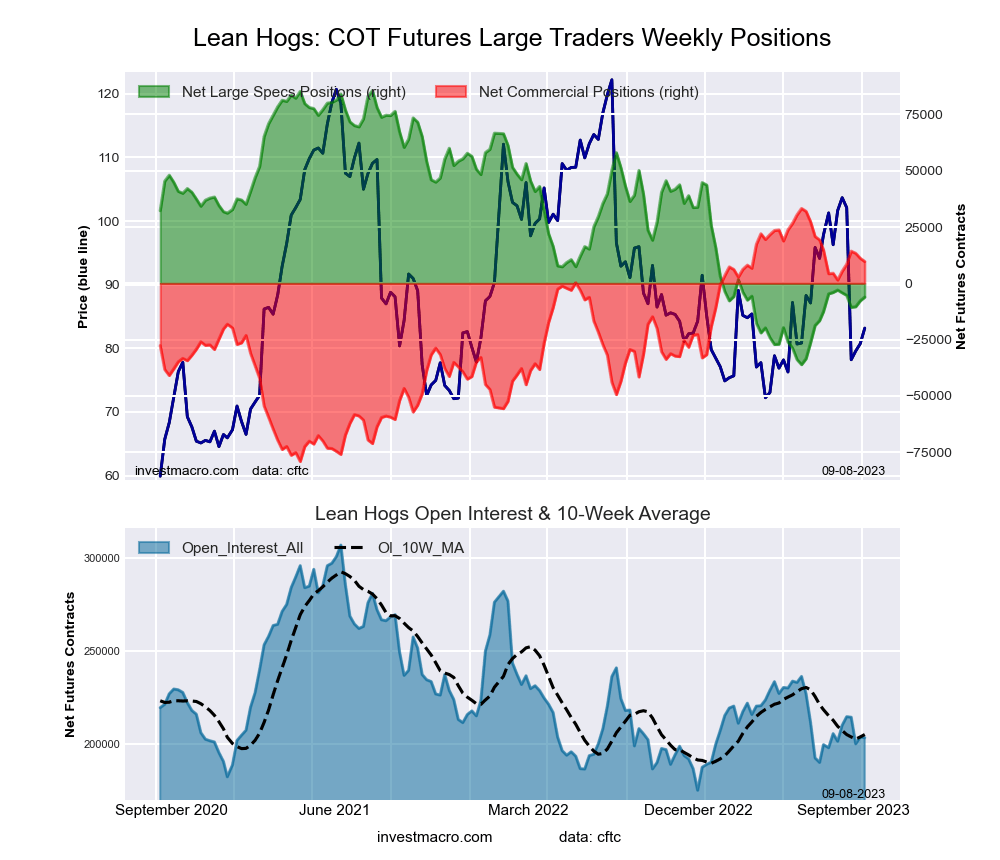 The LEAN HOGS large speculator standing this week reached a net position of -6,132 contracts in the data reported through Tuesday. This was a weekly boost of 1,659 contracts from the previous week which had a total of -7,791 net contracts.
This week’s current strength score (the trader positioning range over the past three years, measured from 0 to 100) shows the speculators are currently Bearish with a score of 24.6 percent. The commercials are Bullish with a score of 79.0 percent and the small traders (not shown in chart) are Bullish with a score of 67.5 percent.
Price Trend-Following Model: Weak Uptrend
Our weekly trend-following model classifies the current market price position as: Weak Uptrend. The current action for the model is considered to be: Hold – Maintain Long Position.
| LEAN HOGS Futures Statistics | SPECULATORS | COMMERCIALS | SMALL TRADERS |
| – Percent of Open Interest Longs: | 31.3 | 39.4 | 9.4 |
| – Percent of Open Interest Shorts: | 34.4 | 34.7 | 11.1 |
| – Net Position: | -6,132 | 9,659 | -3,527 |
| – Gross Longs: | 63,716 | 80,133 | 19,036 |
| – Gross Shorts: | 69,848 | 70,474 | 22,563 |
| – Long to Short Ratio: | 0.9 to 1 | 1.1 to 1 | 0.8 to 1 |
| NET POSITION TREND: | | | |
| – Strength Index Score (3 Year Range Pct): | 24.6 | 79.0 | 67.5 |
| – Strength Index Reading (3 Year Range): | Bearish | Bullish | Bullish |
| NET POSITION MOVEMENT INDEX: | | | |
| – 6-Week Change in Strength Index: | -2.6 | 7.3 | -22.8 |
COTTON Futures:
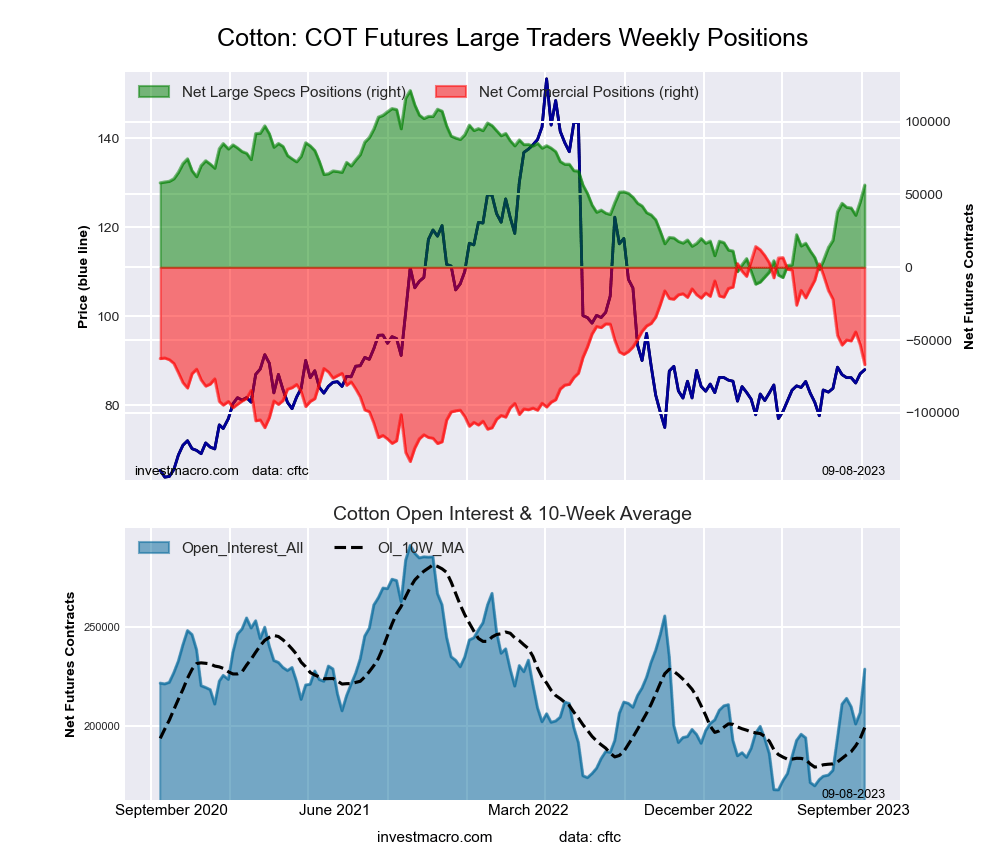 The COTTON large speculator standing this week reached a net position of 56,410 contracts in the data reported through Tuesday. This was a weekly advance of 11,560 contracts from the previous week which had a total of 44,850 net contracts.
This week’s current strength score (the trader positioning range over the past three years, measured from 0 to 100) shows the speculators are currently Bullish with a score of 51.2 percent. The commercials are Bearish with a score of 45.1 percent and the small traders (not shown in chart) are Bullish with a score of 78.9 percent.
Price Trend-Following Model: Uptrend
Our weekly trend-following model classifies the current market price position as: Uptrend. The current action for the model is considered to be: Hold – Maintain Long Position.
| COTTON Futures Statistics | SPECULATORS | COMMERCIALS | SMALL TRADERS |
| – Percent of Open Interest Longs: | 39.8 | 41.2 | 8.0 |
| – Percent of Open Interest Shorts: | 15.2 | 70.4 | 3.5 |
| – Net Position: | 56,410 | -66,786 | 10,376 |
| – Gross Longs: | 91,093 | 94,304 | 18,327 |
| – Gross Shorts: | 34,683 | 161,090 | 7,951 |
| – Long to Short Ratio: | 2.6 to 1 | 0.6 to 1 | 2.3 to 1 |
| NET POSITION TREND: | | | |
| – Strength Index Score (3 Year Range Pct): | 51.2 | 45.1 | 78.9 |
| – Strength Index Reading (3 Year Range): | Bullish | Bearish | Bullish |
| NET POSITION MOVEMENT INDEX: | | | |
| – 6-Week Change in Strength Index: | 13.9 | -13.7 | 10.4 |
COCOA Futures:
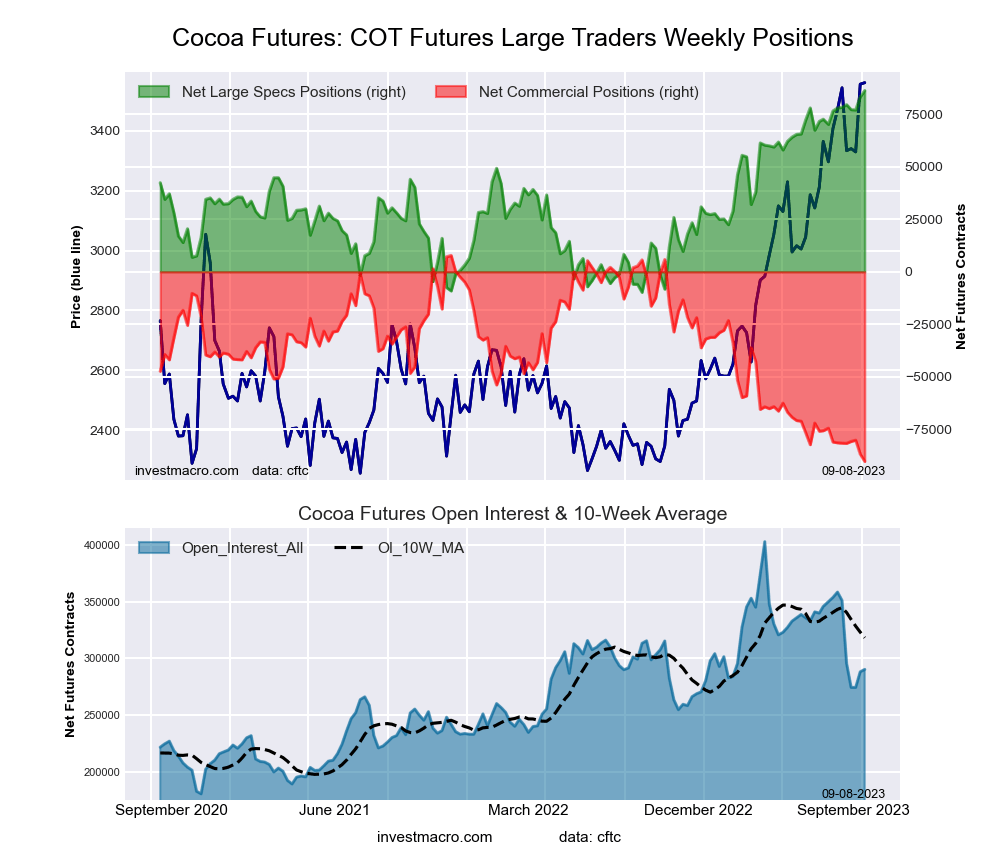 The COCOA large speculator standing this week reached a net position of 86,220 contracts in the data reported through Tuesday. This was a weekly advance of 2,999 contracts from the previous week which had a total of 83,221 net contracts.
This week’s current strength score (the trader positioning range over the past three years, measured from 0 to 100) shows the speculators are currently Bullish-Extreme with a score of 100.0 percent. The commercials are Bearish-Extreme with a score of 0.0 percent and the small traders (not shown in chart) are Bearish with a score of 36.5 percent.
Price Trend-Following Model: Strong Uptrend
Our weekly trend-following model classifies the current market price position as: Strong Uptrend. The current action for the model is considered to be: Hold – Maintain Long Position.
| COCOA Futures Statistics | SPECULATORS | COMMERCIALS | SMALL TRADERS |
| – Percent of Open Interest Longs: | 47.5 | 25.9 | 4.5 |
| – Percent of Open Interest Shorts: | 17.7 | 57.0 | 3.2 |
| – Net Position: | 86,220 | -90,212 | 3,992 |
| – Gross Longs: | 137,720 | 75,136 | 13,139 |
| – Gross Shorts: | 51,500 | 165,348 | 9,147 |
| – Long to Short Ratio: | 2.7 to 1 | 0.5 to 1 | 1.4 to 1 |
| NET POSITION TREND: | | | |
| – Strength Index Score (3 Year Range Pct): | 100.0 | 0.0 | 36.5 |
| – Strength Index Reading (3 Year Range): | Bullish-Extreme | Bearish-Extreme | Bearish |
| NET POSITION MOVEMENT INDEX: | | | |
| – 6-Week Change in Strength Index: | 8.7 | -9.1 | 5.5 |
WHEAT Futures:
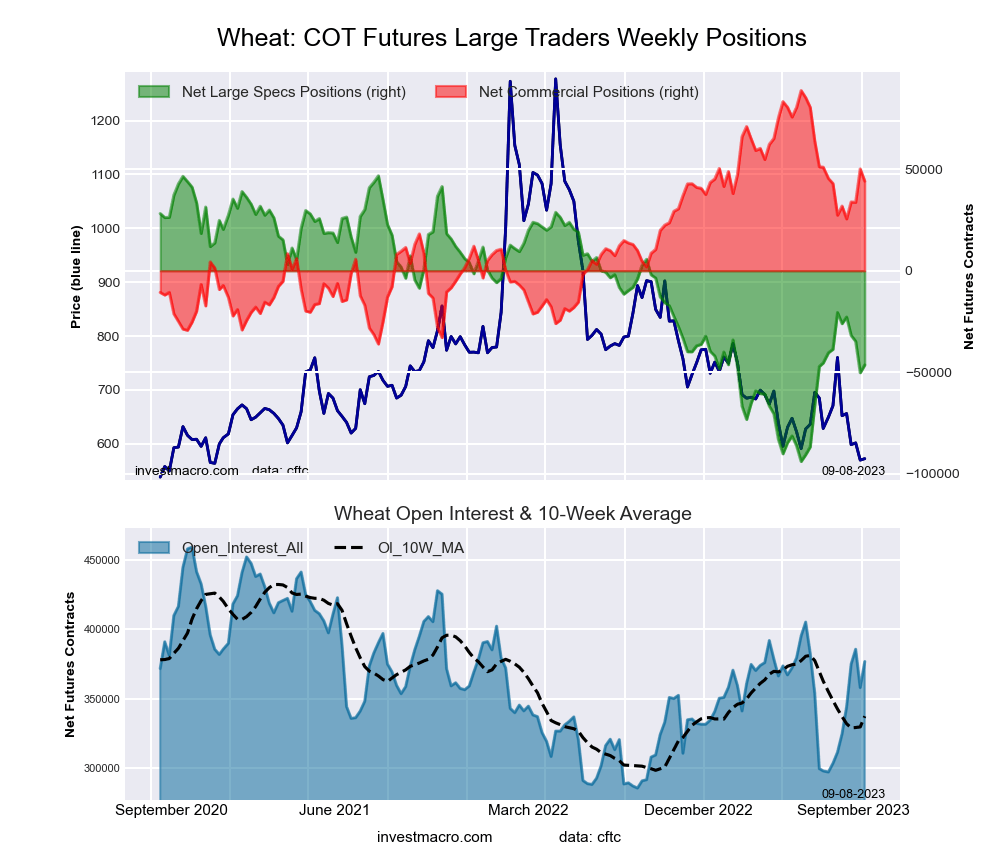 The WHEAT large speculator standing this week reached a net position of -46,410 contracts in the data reported through Tuesday. This was a weekly rise of 3,847 contracts from the previous week which had a total of -50,257 net contracts.
This week’s current strength score (the trader positioning range over the past three years, measured from 0 to 100) shows the speculators are currently Bearish with a score of 33.8 percent. The commercials are Bullish with a score of 64.2 percent and the small traders (not shown in chart) are Bullish with a score of 78.3 percent.
Price Trend-Following Model: Strong Downtrend
Our weekly trend-following model classifies the current market price position as: Strong Downtrend. The current action for the model is considered to be: Hold – Maintain Short Position.
| WHEAT Futures Statistics | SPECULATORS | COMMERCIALS | SMALL TRADERS |
| – Percent of Open Interest Longs: | 29.2 | 34.7 | 9.9 |
| – Percent of Open Interest Shorts: | 41.5 | 22.9 | 9.3 |
| – Net Position: | -46,410 | 44,160 | 2,250 |
| – Gross Longs: | 109,981 | 130,578 | 37,412 |
| – Gross Shorts: | 156,391 | 86,418 | 35,162 |
| – Long to Short Ratio: | 0.7 to 1 | 1.5 to 1 | 1.1 to 1 |
| NET POSITION TREND: | | | |
| – Strength Index Score (3 Year Range Pct): | 33.8 | 64.2 | 78.3 |
| – Strength Index Reading (3 Year Range): | Bearish | Bullish | Bullish |
| NET POSITION MOVEMENT INDEX: | | | |
| – 6-Week Change in Strength Index: | -18.4 | 13.4 | 35.4 |
Article By InvestMacro – Receive our weekly COT Newsletter
*COT Report: The COT data, released weekly to the public each Friday, is updated through the most recent Tuesday (data is 3 days old) and shows a quick view of how large speculators or non-commercials (for-profit traders) were positioned in the futures markets.
The CFTC categorizes trader positions according to commercial hedgers (traders who use futures contracts for hedging as part of the business), non-commercials (large traders who speculate to realize trading profits) and nonreportable traders (usually small traders/speculators) as well as their open interest (contracts open in the market at time of reporting). See CFTC criteria here.


