By InvestMacro
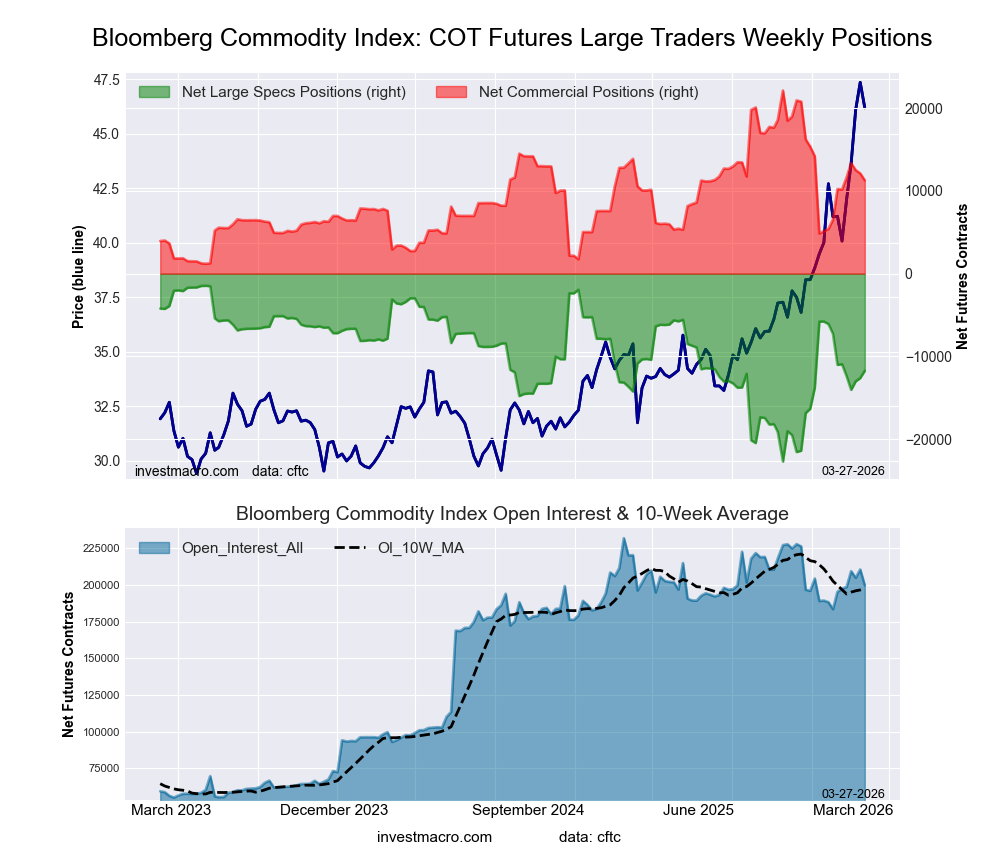
Here are the latest charts and statistics for the Commitment of Traders (COT) reports data published by the Commodities Futures Trading Commission (CFTC).
The latest COT data is updated through Tuesday March 24th and shows a quick view of how large traders (for-profit speculators and commercial entities) were positioned in the futures markets.
Weekly Speculator Changes led by Sugar & Corn
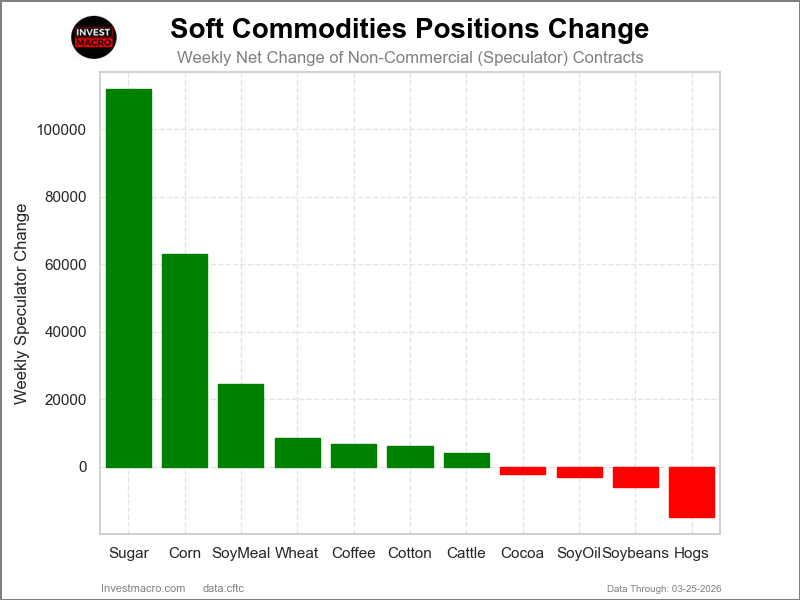
The COT soft commodities markets speculator bets were overall higher this week as seven out of the eleven softs markets we cover had higher positioning while the other four markets had lower speculator contracts.
Leading the gains for the softs markets was a gigantic jump for Sugar (111,951 contracts) with Corn (63,018 contracts), Soybean Meal (24,533 contracts), Wheat (8,580 contracts), Coffee (6,830 contracts), Cotton (6,042 contracts) and Live Cattle (3,985 contracts) also having positive weeks.
The markets with the declines in speculator bets this week were Lean Hogs (-14,913 contracts), Soybeans (-5,856 contracts), Soybean Oil (-2,962 contracts) and with Cocoa (-2,257 contracts) also seeing lower bets on the week.
Sugar and Corn continue to see strong Speculator Bets
Highlighting the Soft Commodities speculator positional changes this week was Sugar, which saw a substantial influx of positive speculator positions. The net speculator position rose by 111,951 net contracts this week, marking the highest one-week amount in history for Sugar positions. Sugar has now seen speculator bets rise for five consecutive weeks, taking the overall net position from a level of -253,592 net contracts on February 17th to this week’s total of -95,804 net contracts. Overall, Sugar speculator bets have been in a bearish position since May of 2025 but this week’s level is the least bearish position since September.
Corn also saw a jump in speculator positions and rose by 63,000 contracts this week. The Corn speculator position has now risen for seven consecutive weeks, and over that time frame, the net position has improved by a huge 410,058 net contracts. This has taken the total spec position from a negative standing of -18,333 contracts on February 10th to a strong bullish position this week of 375,360 net contracts.
Soybean Oil and Cotton led Soft Commodities price performance.
The Soft Commodities price performance this week was led by Soybean Oil, which rose by almost 5% on the week with a 4.86% gain. Next up was Cotton, which rose by just over 3.5% with a 3.56% increase. Live Cattle was up by 2.3%. Sugar rose by 1.63% and was followed by Wheat with a 1.40% gain and Lean Hogs with 1.31% increase on the week. Rounding out the gainers was Soybeans with a 0.46% uptick.
On the downside, Soybean Meal was the biggest loser on the week with a -2.80% decline, followed by Cocoa, which dipped by -2.50%, and Coffee, which fell by -2.15%. Corn was a little bit lower this week with a -1.17% decrease over the last five-day period.
Soft Commodities Data:
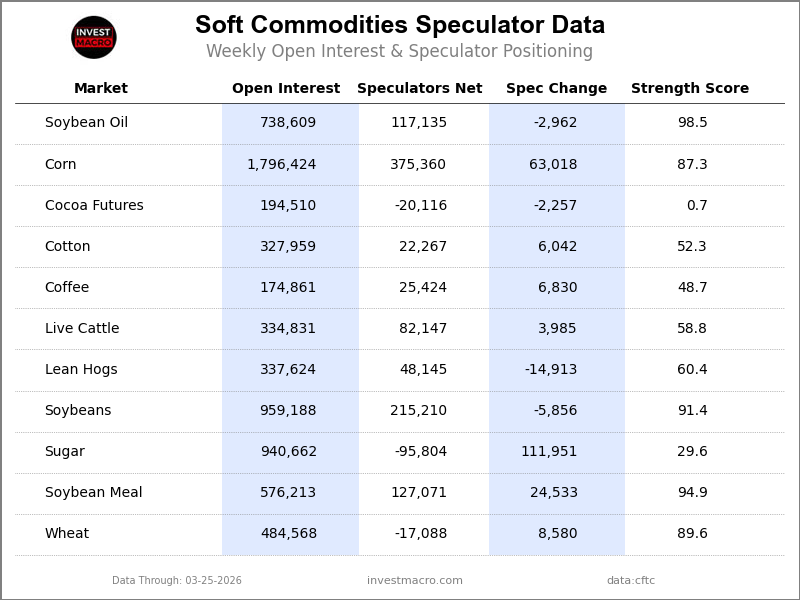
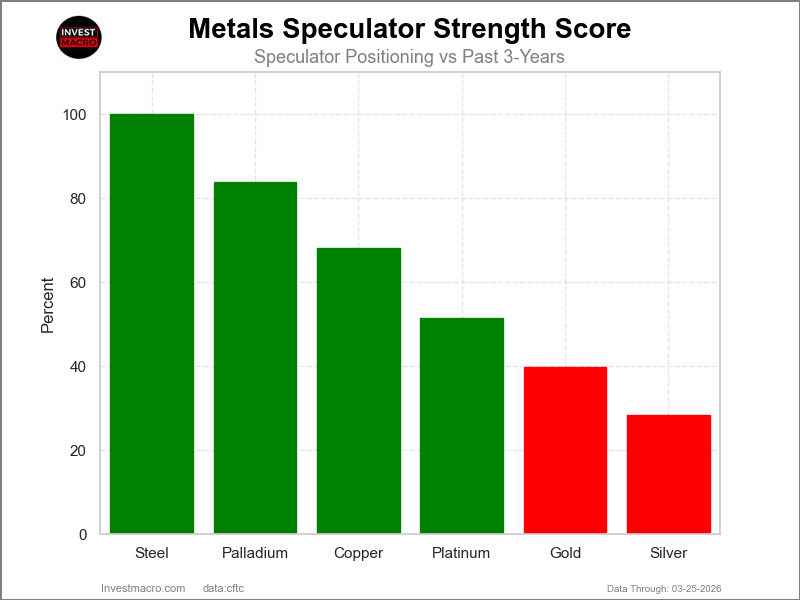
Legend: Weekly Speculators Change | Speculators Current Net Position | Speculators Strength Score compared to last 3-Years (0-100 range)
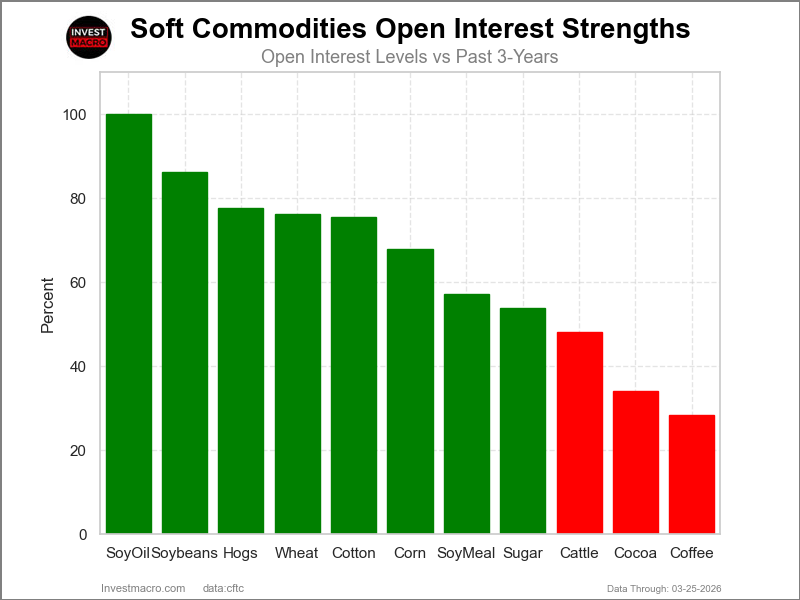
Strength Scores led by Soybean Oil & Soybean Meal
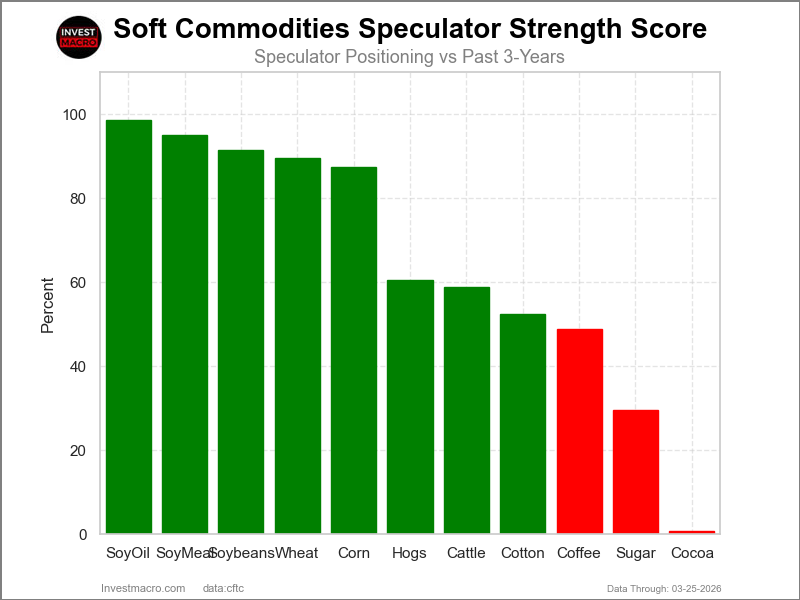
COT Strength Scores (a normalized measure of Speculator positions over a 3-Year range, from 0 to 100 where above 80 is Extreme-Bullish and below 20 is Extreme-Bearish) showed that Soybean Oil (98 percent) and Soybean Meal (95 percent) lead the softs markets this week. Soybeans (91 percent), Wheat (90 percent) and Corn (87 percent) come in as the next highest in the weekly strength scores.
On the downside, Cocoa (1 percent) comes in at the lowest strength levels currently and are in Extreme-Bearish territory (below 20 percent). The next lowest strength scores are Sugar (30 percent) and Coffee (49 percent).
Strength Statistics:
Corn (87.3 percent) vs Corn previous week (78.7 percent)
Sugar (29.6 percent) vs Sugar previous week (8.6 percent)
Coffee (48.7 percent) vs Coffee previous week (41.8 percent)
Soybeans (91.4 percent) vs Soybeans previous week (92.7 percent)
Soybean Oil (98.5 percent) vs Soybean Oil previous week (100.0 percent)
Soybean Meal (94.9 percent) vs Soybean Meal previous week (84.0 percent)
Live Cattle (58.8 percent) vs Live Cattle previous week (54.9 percent)
Lean Hogs (60.4 percent) vs Lean Hogs previous week (71.1 percent)
Cotton (52.3 percent) vs Cotton previous week (48.7 percent)
Cocoa (0.7 percent) vs Cocoa previous week (2.7 percent)
Wheat (89.6 percent) vs Wheat previous week (82.0 percent)
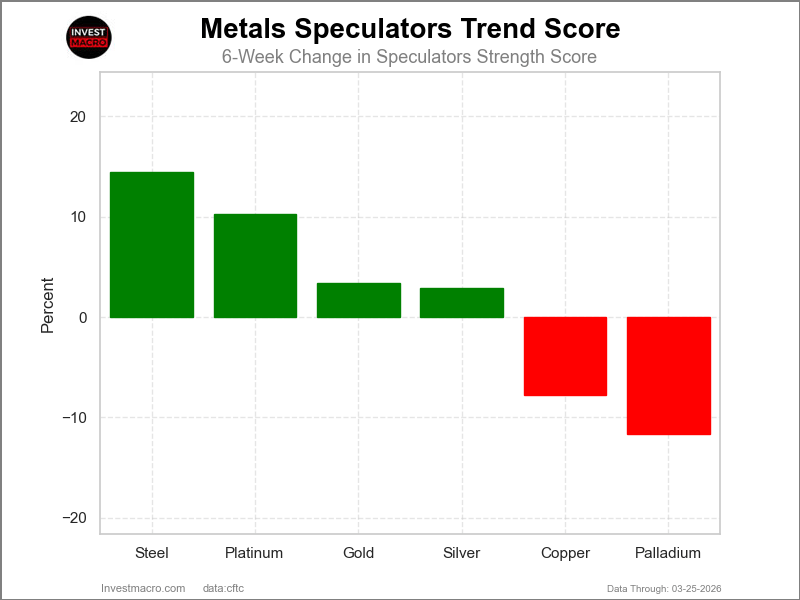
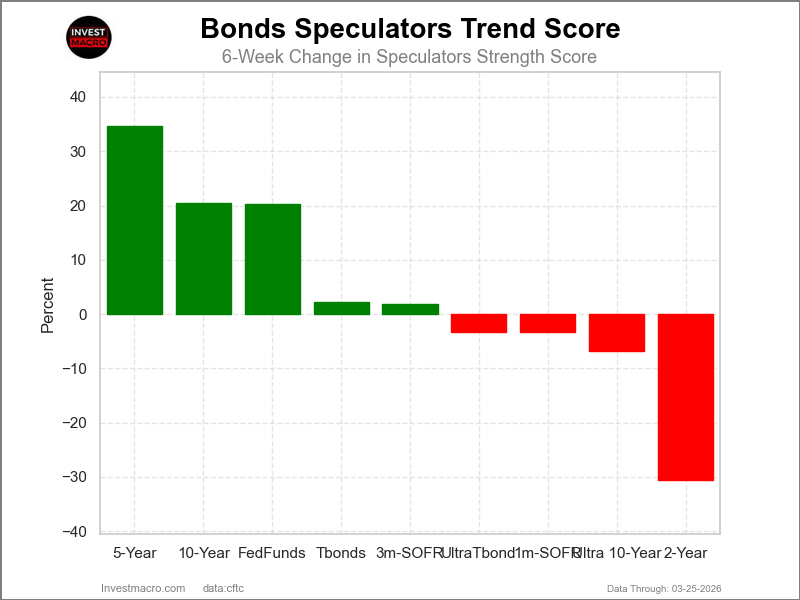
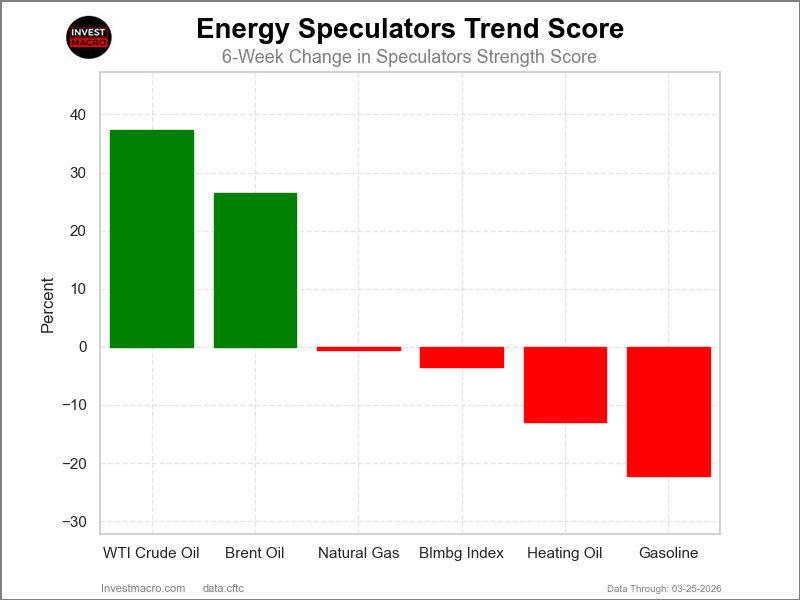
Corn & Soybean Meal top the 6-Week Strength Trends
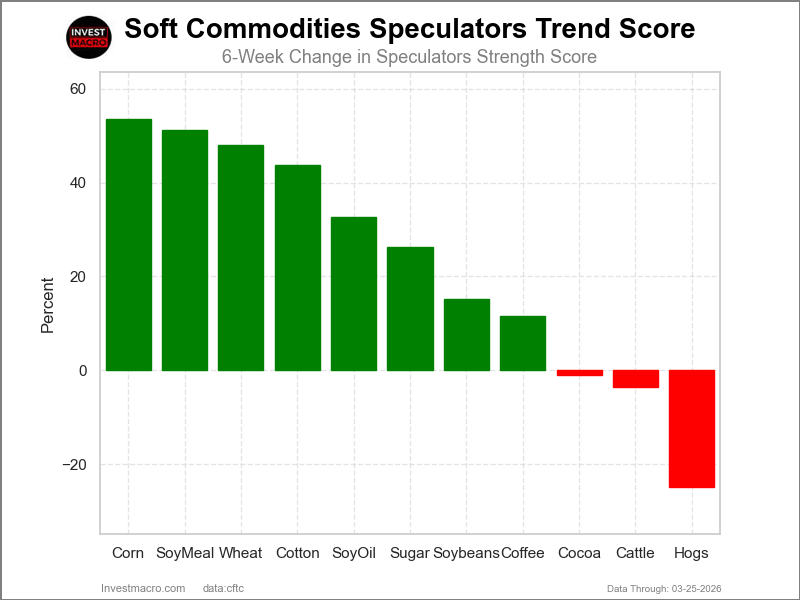
COT Strength Score Trends (or move index, calculates the 6-week changes in strength scores) showed that Corn (54 percent) and Soybean Meal (51 percent) lead the past six weeks trends for soft commodities. Wheat (48 percent), Cotton (44 percent) and Soybean Oil (33 percent) are the next highest positive movers in the latest trends data.
Lean Hogs (-25 percent) leads the downside trend scores currently with Live Cattle (-4 percent) and Cocoa (-1 percent) following next with lower trend scores.
Strength Trend Statistics:
Corn (53.6 percent) vs Corn previous week (47.2 percent)
Sugar (26.2 percent) vs Sugar previous week (0.5 percent)
Coffee (11.5 percent) vs Coffee previous week (0.2 percent)
Soybeans (15.3 percent) vs Soybeans previous week (34.8 percent)
Soybean Oil (32.6 percent) vs Soybean Oil previous week (43.0 percent)
Soybean Meal (51.3 percent) vs Soybean Meal previous week (44.2 percent)
Live Cattle (-3.6 percent) vs Live Cattle previous week (-13.6 percent)
Lean Hogs (-24.9 percent) vs Lean Hogs previous week (-11.7 percent)
Cotton (43.8 percent) vs Cotton previous week (35.1 percent)
Cocoa (-1.1 percent) vs Cocoa previous week (-3.1 percent)
Wheat (48.1 percent) vs Wheat previous week (35.3 percent)
Individual Soft Commodities Markets:
CORN Futures:
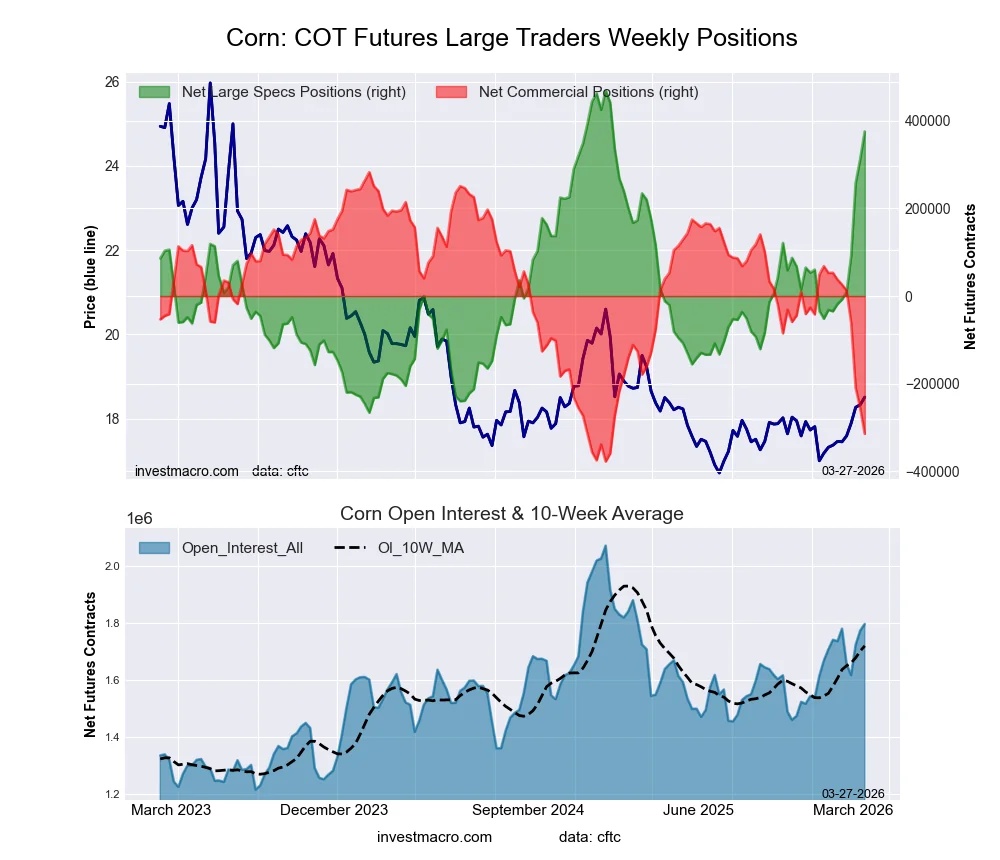 The CORN large speculator standing this week equaled a net position of 375,360 contracts in the data reported through Tuesday. This was a weekly advance of 63,018 contracts from the previous week which had a total of 312,342 net contracts.
This week’s current strength score (the trader positioning range over the past three years, measured from 0 to 100) shows the speculators are currently Bullish-Extreme with a score of 87.3 percent. The commercials are Bearish-Extreme with a score of 9.6 percent and the small traders (not shown in chart) are Bearish with a score of 35.3 percent.
Price Trend-Following Model: Strong Uptrend
Our weekly trend-following model classifies the current market price position as: Strong Uptrend.
| CORN Futures Statistics | SPECULATORS | COMMERCIALS | SMALL TRADERS |
| – Percent of Open Interest Longs: | 28.1 | 40.6 | 7.6 |
| – Percent of Open Interest Shorts: | 7.2 | 58.1 | 11.0 |
| – Net Position: | 375,360 | -314,222 | -61,138 |
| – Gross Longs: | 505,346 | 729,492 | 137,322 |
| – Gross Shorts: | 129,986 | 1,043,714 | 198,460 |
| – Long to Short Ratio: | 3.9 to 1 | 0.7 to 1 | 0.7 to 1 |
| NET POSITION TREND: | | | |
| – Strength Index Score (3 Year Range Pct): | 87.3 | 9.6 | 35.3 |
| – Strength Index Reading (3 Year Range): | Bullish-Extreme | Bearish-Extreme | Bearish |
| NET POSITION MOVEMENT INDEX: | | | |
| – 6-Week Change in Strength Index: | 53.6 | -53.3 | -49.1 |
SUGAR Futures:
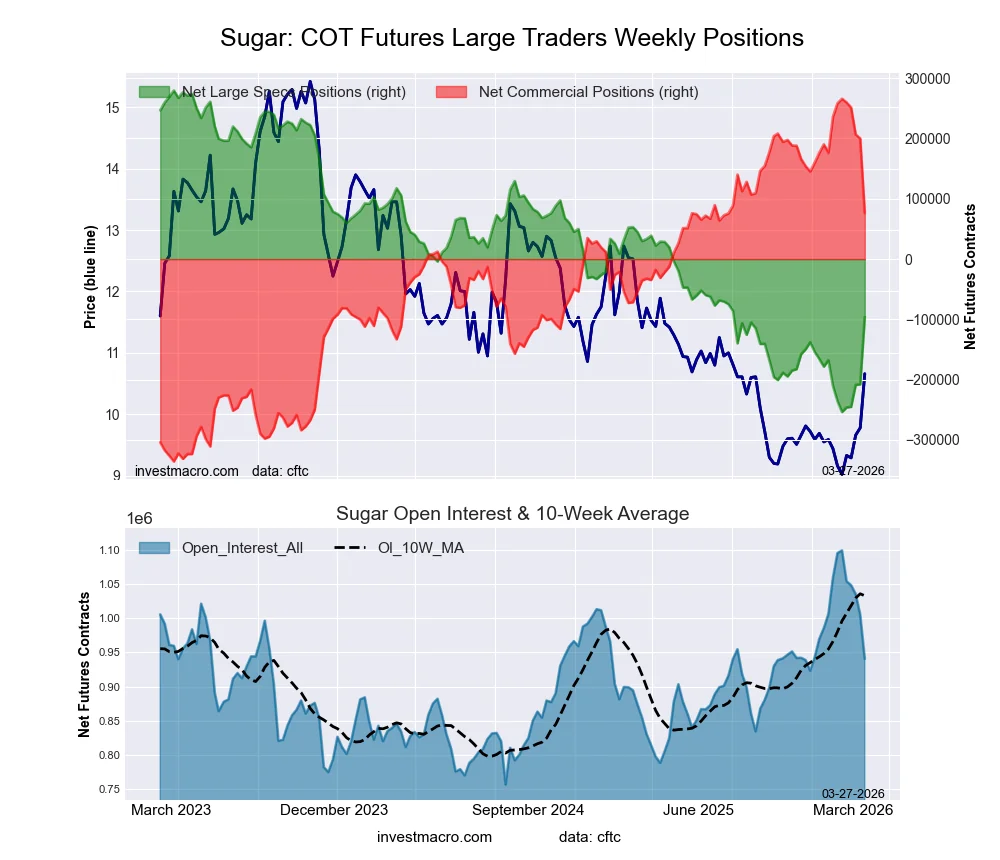 The SUGAR large speculator standing this week equaled a net position of -95,804 contracts in the data reported through Tuesday. This was a weekly rise of 111,951 contracts from the previous week which had a total of -207,755 net contracts.
This week’s current strength score (the trader positioning range over the past three years, measured from 0 to 100) shows the speculators are currently Bearish with a score of 29.6 percent. The commercials are Bullish with a score of 68.5 percent and the small traders (not shown in chart) are Bullish with a score of 54.3 percent.
Price Trend-Following Model: Strong Uptrend
Our weekly trend-following model classifies the current market price position as: Strong Uptrend.
| SUGAR Futures Statistics | SPECULATORS | COMMERCIALS | SMALL TRADERS |
| – Percent of Open Interest Longs: | 21.8 | 51.2 | 9.6 |
| – Percent of Open Interest Shorts: | 32.0 | 43.1 | 7.6 |
| – Net Position: | -95,804 | 76,329 | 19,475 |
| – Gross Longs: | 205,205 | 482,040 | 90,528 |
| – Gross Shorts: | 301,009 | 405,711 | 71,053 |
| – Long to Short Ratio: | 0.7 to 1 | 1.2 to 1 | 1.3 to 1 |
| NET POSITION TREND: | | | |
| – Strength Index Score (3 Year Range Pct): | 29.6 | 68.5 | 54.3 |
| – Strength Index Reading (3 Year Range): | Bearish | Bullish | Bullish |
| NET POSITION MOVEMENT INDEX: | | | |
| – 6-Week Change in Strength Index: | 26.2 | -30.3 | 51.0 |
COFFEE Futures:
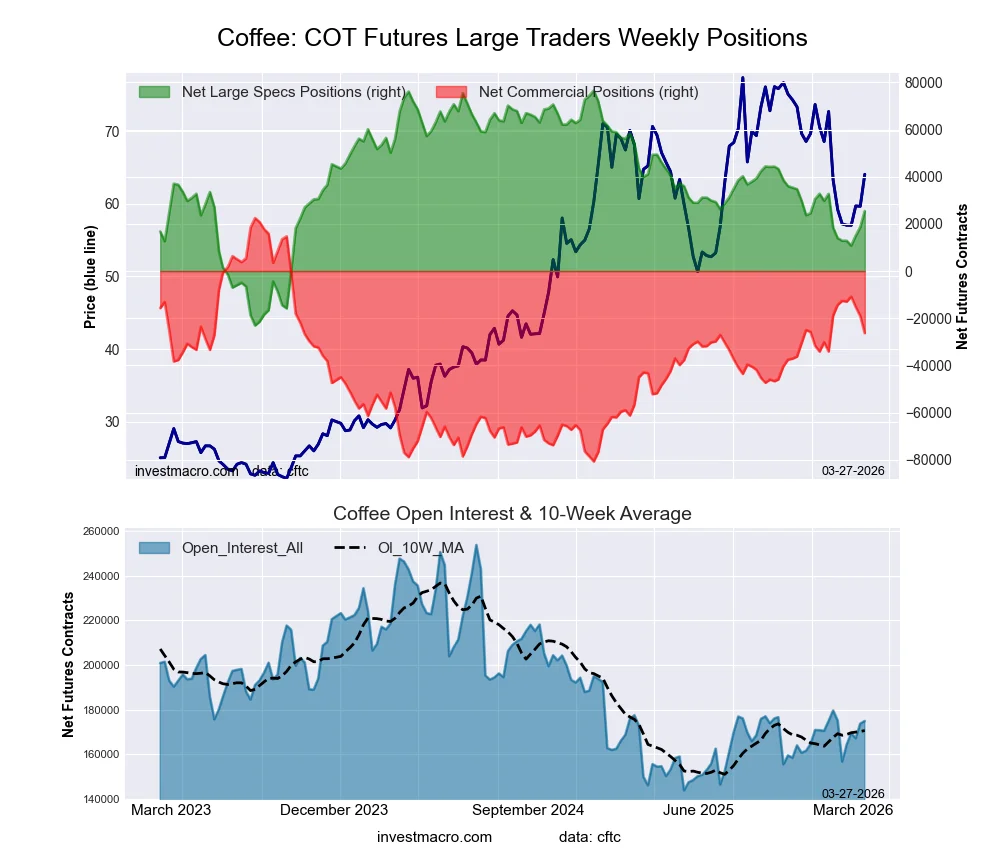 The COFFEE large speculator standing this week equaled a net position of 25,424 contracts in the data reported through Tuesday. This was a weekly advance of 6,830 contracts from the previous week which had a total of 18,594 net contracts.
This week’s current strength score (the trader positioning range over the past three years, measured from 0 to 100) shows the speculators are currently Bearish with a score of 48.7 percent. The commercials are Bullish with a score of 52.7 percent and the small traders (not shown in chart) are Bearish with a score of 28.4 percent.
Price Trend-Following Model: Downtrend
Our weekly trend-following model classifies the current market price position as: Downtrend.
| COFFEE Futures Statistics | SPECULATORS | COMMERCIALS | SMALL TRADERS |
| – Percent of Open Interest Longs: | 30.5 | 37.6 | 5.5 |
| – Percent of Open Interest Shorts: | 16.0 | 52.6 | 5.0 |
| – Net Position: | 25,424 | -26,309 | 885 |
| – Gross Longs: | 53,346 | 65,731 | 9,573 |
| – Gross Shorts: | 27,922 | 92,040 | 8,688 |
| – Long to Short Ratio: | 1.9 to 1 | 0.7 to 1 | 1.1 to 1 |
| NET POSITION TREND: | | | |
| – Strength Index Score (3 Year Range Pct): | 48.7 | 52.7 | 28.4 |
| – Strength Index Reading (3 Year Range): | Bearish | Bullish | Bearish |
| NET POSITION MOVEMENT INDEX: | | | |
| – 6-Week Change in Strength Index: | 11.5 | -11.6 | 8.3 |
SOYBEANS Futures:
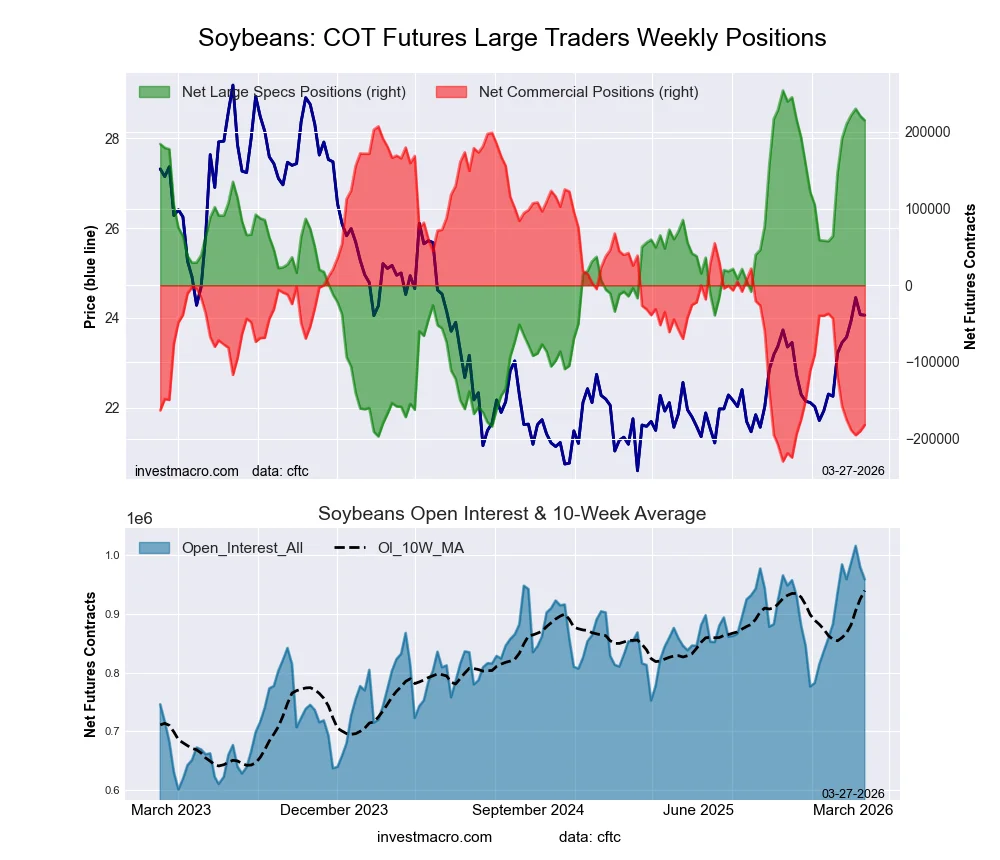 The SOYBEANS large speculator standing this week equaled a net position of 215,210 contracts in the data reported through Tuesday. This was a weekly decline of -5,856 contracts from the previous week which had a total of 221,066 net contracts.
This week’s current strength score (the trader positioning range over the past three years, measured from 0 to 100) shows the speculators are currently Bullish-Extreme with a score of 91.4 percent. The commercials are Bearish-Extreme with a score of 10.9 percent and the small traders (not shown in chart) are Bearish-Extreme with a score of 8.3 percent.
Price Trend-Following Model: Strong Uptrend
Our weekly trend-following model classifies the current market price position as: Strong Uptrend.
| SOYBEANS Futures Statistics | SPECULATORS | COMMERCIALS | SMALL TRADERS |
| – Percent of Open Interest Longs: | 29.4 | 46.1 | 5.3 |
| – Percent of Open Interest Shorts: | 7.0 | 65.1 | 8.7 |
| – Net Position: | 215,210 | -182,268 | -32,942 |
| – Gross Longs: | 282,458 | 441,990 | 50,876 |
| – Gross Shorts: | 67,248 | 624,258 | 83,818 |
| – Long to Short Ratio: | 4.2 to 1 | 0.7 to 1 | 0.6 to 1 |
| NET POSITION TREND: | | | |
| – Strength Index Score (3 Year Range Pct): | 91.4 | 10.9 | 8.3 |
| – Strength Index Reading (3 Year Range): | Bullish-Extreme | Bearish-Extreme | Bearish-Extreme |
| NET POSITION MOVEMENT INDEX: | | | |
| – 6-Week Change in Strength Index: | 15.3 | -14.5 | -17.9 |
SOYBEAN OIL Futures:
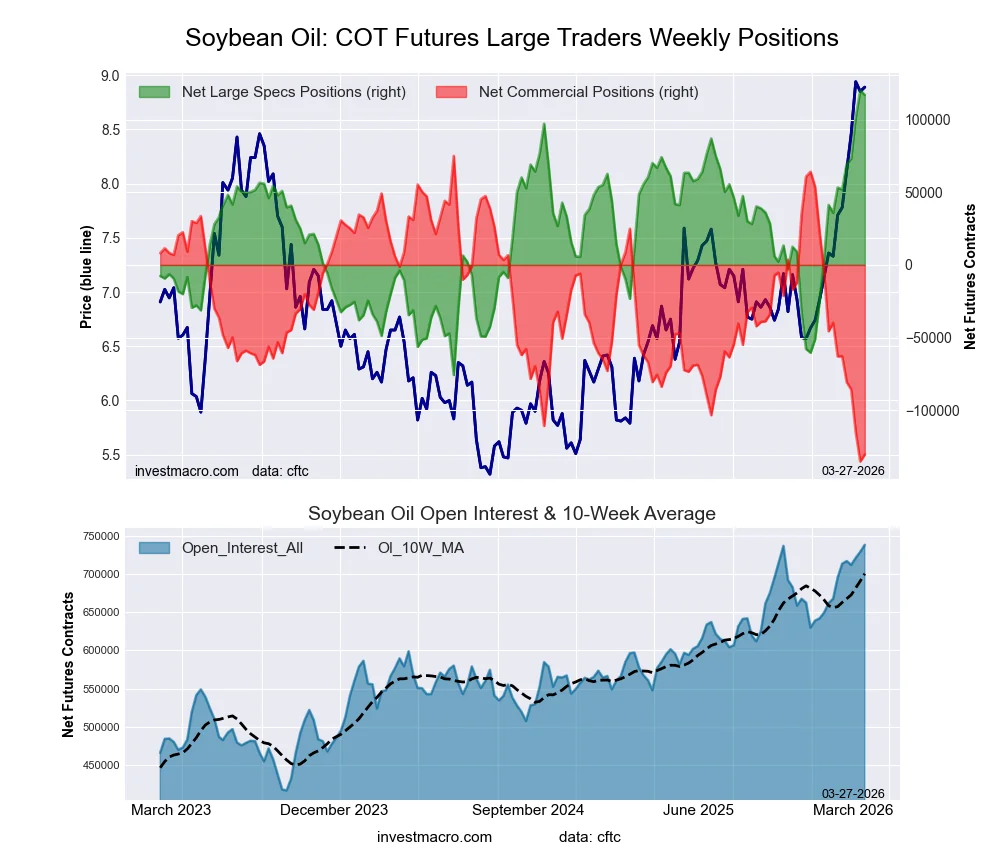 The SOYBEAN OIL large speculator standing this week equaled a net position of 117,135 contracts in the data reported through Tuesday. This was a weekly lowering of -2,962 contracts from the previous week which had a total of 120,097 net contracts.
This week’s current strength score (the trader positioning range over the past three years, measured from 0 to 100) shows the speculators are currently Bullish-Extreme with a score of 98.5 percent. The commercials are Bearish-Extreme with a score of 2.3 percent and the small traders (not shown in chart) are Bullish-Extreme with a score of 85.2 percent.
Price Trend-Following Model: Strong Uptrend
Our weekly trend-following model classifies the current market price position as: Strong Uptrend.
| SOYBEAN OIL Futures Statistics | SPECULATORS | COMMERCIALS | SMALL TRADERS |
| – Percent of Open Interest Longs: | 23.3 | 46.9 | 5.3 |
| – Percent of Open Interest Shorts: | 7.4 | 64.6 | 3.5 |
| – Net Position: | 117,135 | -130,555 | 13,420 |
| – Gross Longs: | 172,116 | 346,316 | 38,917 |
| – Gross Shorts: | 54,981 | 476,871 | 25,497 |
| – Long to Short Ratio: | 3.1 to 1 | 0.7 to 1 | 1.5 to 1 |
| NET POSITION TREND: | | | |
| – Strength Index Score (3 Year Range Pct): | 98.5 | 2.3 | 85.2 |
| – Strength Index Reading (3 Year Range): | Bullish-Extreme | Bearish-Extreme | Bullish-Extreme |
| NET POSITION MOVEMENT INDEX: | | | |
| – 6-Week Change in Strength Index: | 32.6 | -32.1 | 18.7 |
SOYBEAN MEAL Futures:
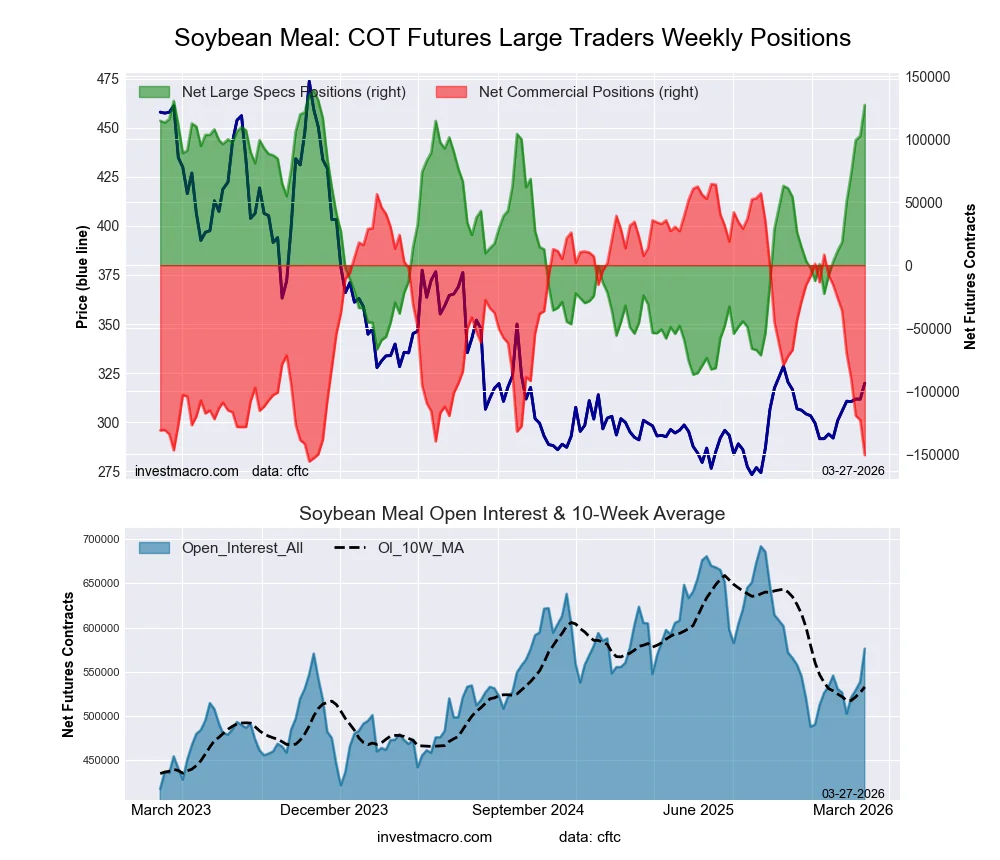 The SOYBEAN MEAL large speculator standing this week equaled a net position of 127,071 contracts in the data reported through Tuesday. This was a weekly rise of 24,533 contracts from the previous week which had a total of 102,538 net contracts.
This week’s current strength score (the trader positioning range over the past three years, measured from 0 to 100) shows the speculators are currently Bullish-Extreme with a score of 94.9 percent. The commercials are Bearish-Extreme with a score of 2.3 percent and the small traders (not shown in chart) are Bullish with a score of 76.3 percent.
Price Trend-Following Model: Weak Downtrend
Our weekly trend-following model classifies the current market price position as: Weak Downtrend.
| SOYBEAN MEAL Futures Statistics | SPECULATORS | COMMERCIALS | SMALL TRADERS |
| – Percent of Open Interest Longs: | 30.7 | 43.1 | 8.4 |
| – Percent of Open Interest Shorts: | 8.7 | 69.2 | 4.3 |
| – Net Position: | 127,071 | -150,757 | 23,686 |
| – Gross Longs: | 177,113 | 248,242 | 48,314 |
| – Gross Shorts: | 50,042 | 398,999 | 24,628 |
| – Long to Short Ratio: | 3.5 to 1 | 0.6 to 1 | 2.0 to 1 |
| NET POSITION TREND: | | | |
| – Strength Index Score (3 Year Range Pct): | 94.9 | 2.3 | 76.3 |
| – Strength Index Reading (3 Year Range): | Bullish-Extreme | Bearish-Extreme | Bullish |
| NET POSITION MOVEMENT INDEX: | | | |
| – 6-Week Change in Strength Index: | 51.3 | -56.6 | 48.9 |
LIVE CATTLE Futures:
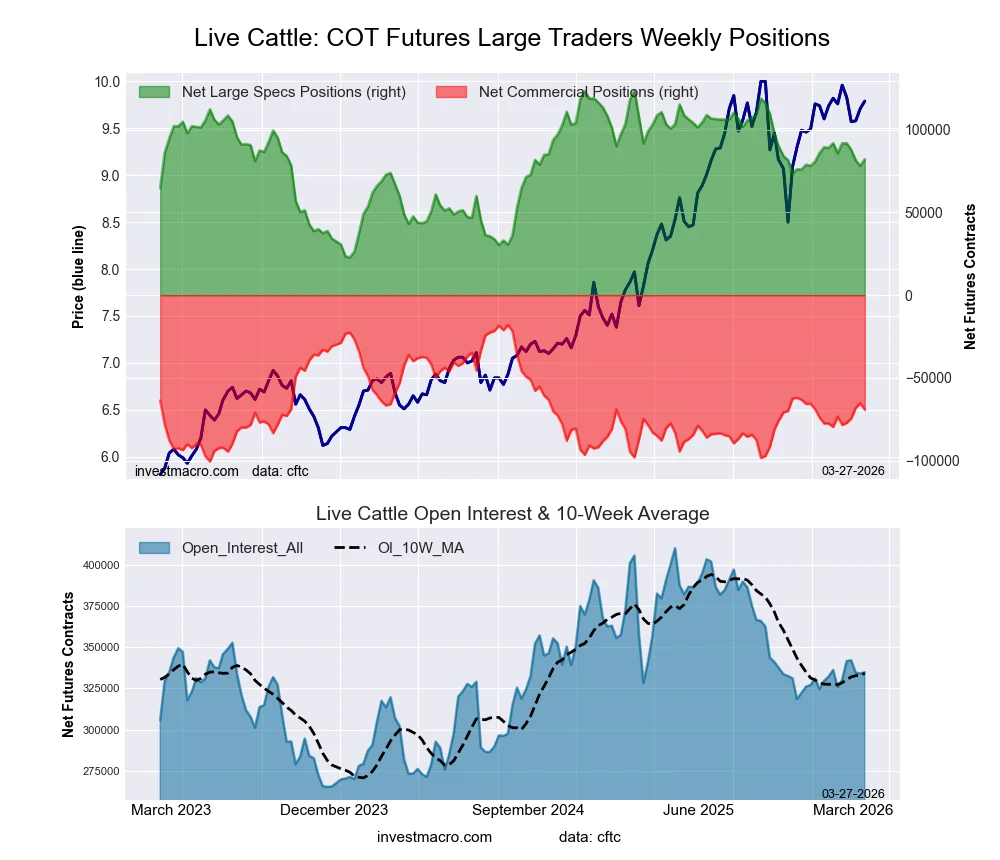 The LIVE CATTLE large speculator standing this week equaled a net position of 82,147 contracts in the data reported through Tuesday. This was a weekly advance of 3,985 contracts from the previous week which had a total of 78,162 net contracts.
This week’s current strength score (the trader positioning range over the past three years, measured from 0 to 100) shows the speculators are currently Bullish with a score of 58.8 percent. The commercials are Bearish with a score of 37.9 percent and the small traders (not shown in chart) are Bullish with a score of 52.8 percent.
Price Trend-Following Model: Uptrend
Our weekly trend-following model classifies the current market price position as: Uptrend.
| LIVE CATTLE Futures Statistics | SPECULATORS | COMMERCIALS | SMALL TRADERS |
| – Percent of Open Interest Longs: | 40.7 | 31.1 | 8.9 |
| – Percent of Open Interest Shorts: | 16.1 | 51.8 | 12.8 |
| – Net Position: | 82,147 | -69,198 | -12,949 |
| – Gross Longs: | 136,153 | 104,088 | 29,818 |
| – Gross Shorts: | 54,006 | 173,286 | 42,767 |
| – Long to Short Ratio: | 2.5 to 1 | 0.6 to 1 | 0.7 to 1 |
| NET POSITION TREND: | | | |
| – Strength Index Score (3 Year Range Pct): | 58.8 | 37.9 | 52.8 |
| – Strength Index Reading (3 Year Range): | Bullish | Bearish | Bullish |
| NET POSITION MOVEMENT INDEX: | | | |
| – 6-Week Change in Strength Index: | -3.6 | 5.1 | -2.0 |
LEAN HOGS Futures:
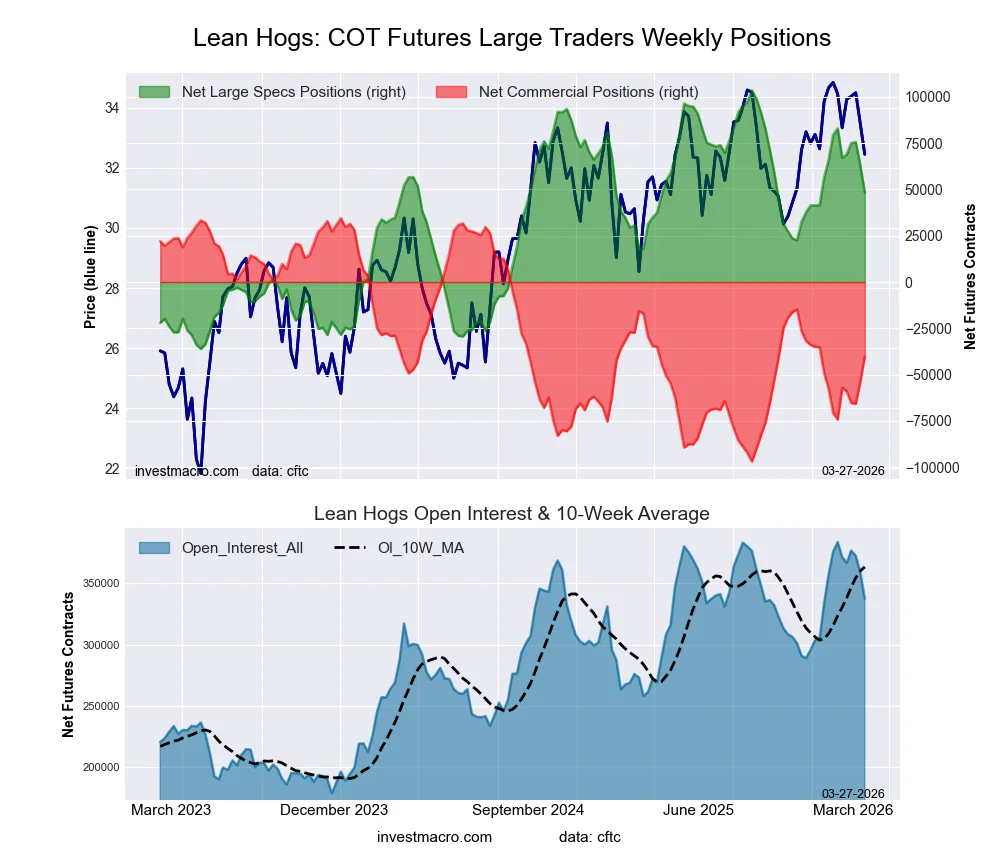 The LEAN HOGS large speculator standing this week equaled a net position of 48,145 contracts in the data reported through Tuesday. This was a weekly decline of -14,913 contracts from the previous week which had a total of 63,058 net contracts.
This week’s current strength score (the trader positioning range over the past three years, measured from 0 to 100) shows the speculators are currently Bullish with a score of 60.4 percent. The commercials are Bearish with a score of 43.2 percent and the small traders (not shown in chart) are Bearish with a score of 29.3 percent.
Price Trend-Following Model: Weak Uptrend
Our weekly trend-following model classifies the current market price position as: Weak Uptrend.
| LEAN HOGS Futures Statistics | SPECULATORS | COMMERCIALS | SMALL TRADERS |
| – Percent of Open Interest Longs: | 37.9 | 33.9 | 6.1 |
| – Percent of Open Interest Shorts: | 23.6 | 45.8 | 8.5 |
| – Net Position: | 48,145 | -40,130 | -8,015 |
| – Gross Longs: | 127,801 | 114,534 | 20,532 |
| – Gross Shorts: | 79,656 | 154,664 | 28,547 |
| – Long to Short Ratio: | 1.6 to 1 | 0.7 to 1 | 0.7 to 1 |
| NET POSITION TREND: | | | |
| – Strength Index Score (3 Year Range Pct): | 60.4 | 43.2 | 29.3 |
| – Strength Index Reading (3 Year Range): | Bullish | Bearish | Bearish |
| NET POSITION MOVEMENT INDEX: | | | |
| – 6-Week Change in Strength Index: | -24.9 | 26.0 | 4.0 |
COTTON Futures:
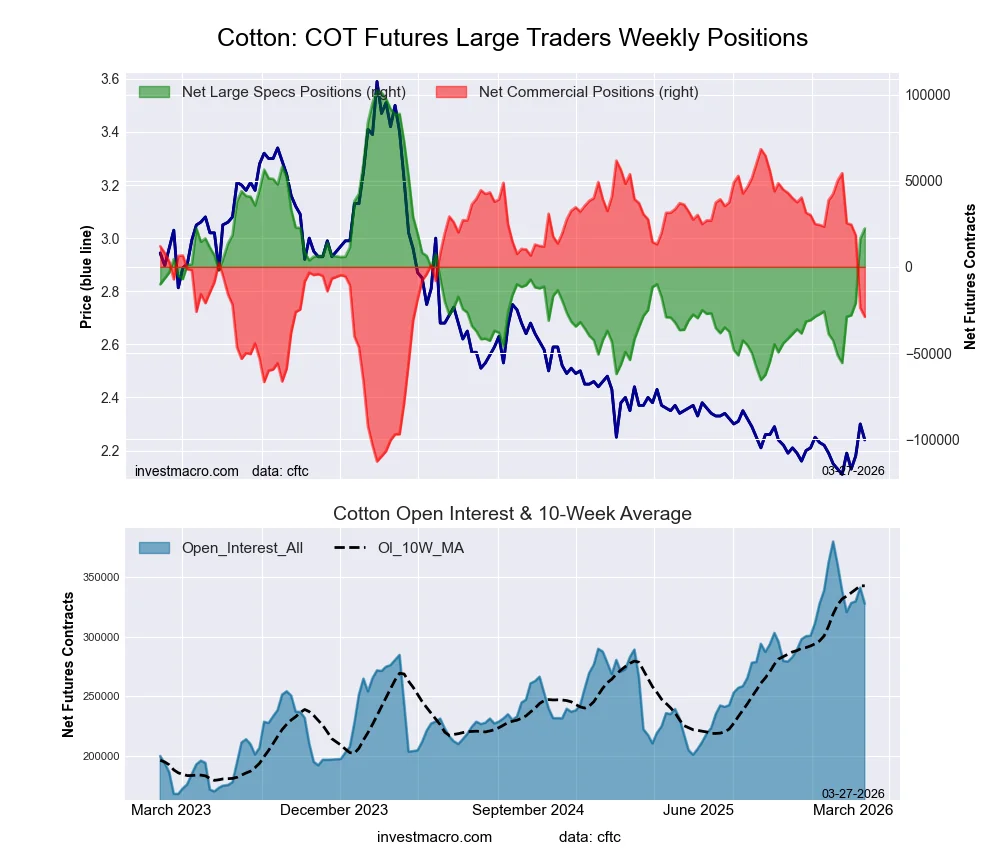 The COTTON large speculator standing this week equaled a net position of 22,267 contracts in the data reported through Tuesday. This was a weekly rise of 6,042 contracts from the previous week which had a total of 16,225 net contracts.
This week’s current strength score (the trader positioning range over the past three years, measured from 0 to 100) shows the speculators are currently Bullish with a score of 52.3 percent. The commercials are Bearish with a score of 46.3 percent and the small traders (not shown in chart) are Bullish with a score of 71.6 percent.
Price Trend-Following Model: Weak Uptrend
Our weekly trend-following model classifies the current market price position as: Weak Uptrend.
| COTTON Futures Statistics | SPECULATORS | COMMERCIALS | SMALL TRADERS |
| – Percent of Open Interest Longs: | 36.6 | 38.4 | 5.6 |
| – Percent of Open Interest Shorts: | 29.8 | 47.3 | 3.6 |
| – Net Position: | 22,267 | -28,974 | 6,707 |
| – Gross Longs: | 120,118 | 126,034 | 18,361 |
| – Gross Shorts: | 97,851 | 155,008 | 11,654 |
| – Long to Short Ratio: | 1.2 to 1 | 0.8 to 1 | 1.6 to 1 |
| NET POSITION TREND: | | | |
| – Strength Index Score (3 Year Range Pct): | 52.3 | 46.3 | 71.6 |
| – Strength Index Reading (3 Year Range): | Bullish | Bearish | Bullish |
| NET POSITION MOVEMENT INDEX: | | | |
| – 6-Week Change in Strength Index: | 43.8 | -43.6 | 40.0 |
COCOA Futures:
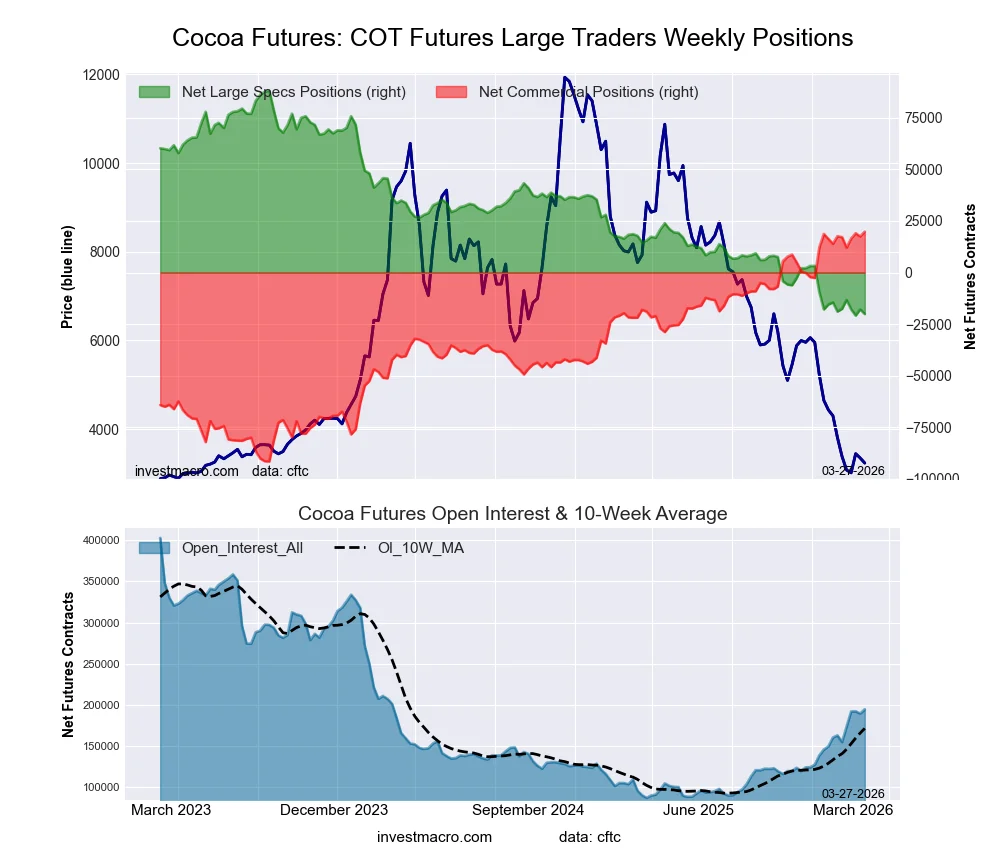 The COCOA large speculator standing this week equaled a net position of -20,116 contracts in the data reported through Tuesday. This was a weekly fall of -2,257 contracts from the previous week which had a total of -17,859 net contracts.
This week’s current strength score (the trader positioning range over the past three years, measured from 0 to 100) shows the speculators are currently Bearish-Extreme with a score of 0.7 percent. The commercials are Bullish-Extreme with a score of 100.0 percent and the small traders (not shown in chart) are Bearish with a score of 30.1 percent.
Price Trend-Following Model: Downtrend
Our weekly trend-following model classifies the current market price position as: Downtrend.
| COCOA Futures Statistics | SPECULATORS | COMMERCIALS | SMALL TRADERS |
| – Percent of Open Interest Longs: | 22.3 | 49.7 | 5.1 |
| – Percent of Open Interest Shorts: | 32.7 | 39.5 | 5.0 |
| – Net Position: | -20,116 | 19,816 | 300 |
| – Gross Longs: | 43,450 | 96,660 | 9,942 |
| – Gross Shorts: | 63,566 | 76,844 | 9,642 |
| – Long to Short Ratio: | 0.7 to 1 | 1.3 to 1 | 1.0 to 1 |
| NET POSITION TREND: | | | |
| – Strength Index Score (3 Year Range Pct): | 0.7 | 100.0 | 30.1 |
| – Strength Index Reading (3 Year Range): | Bearish-Extreme | Bullish-Extreme | Bearish |
| NET POSITION MOVEMENT INDEX: | | | |
| – 6-Week Change in Strength Index: | -1.1 | 2.0 | -10.0 |
WHEAT Futures:
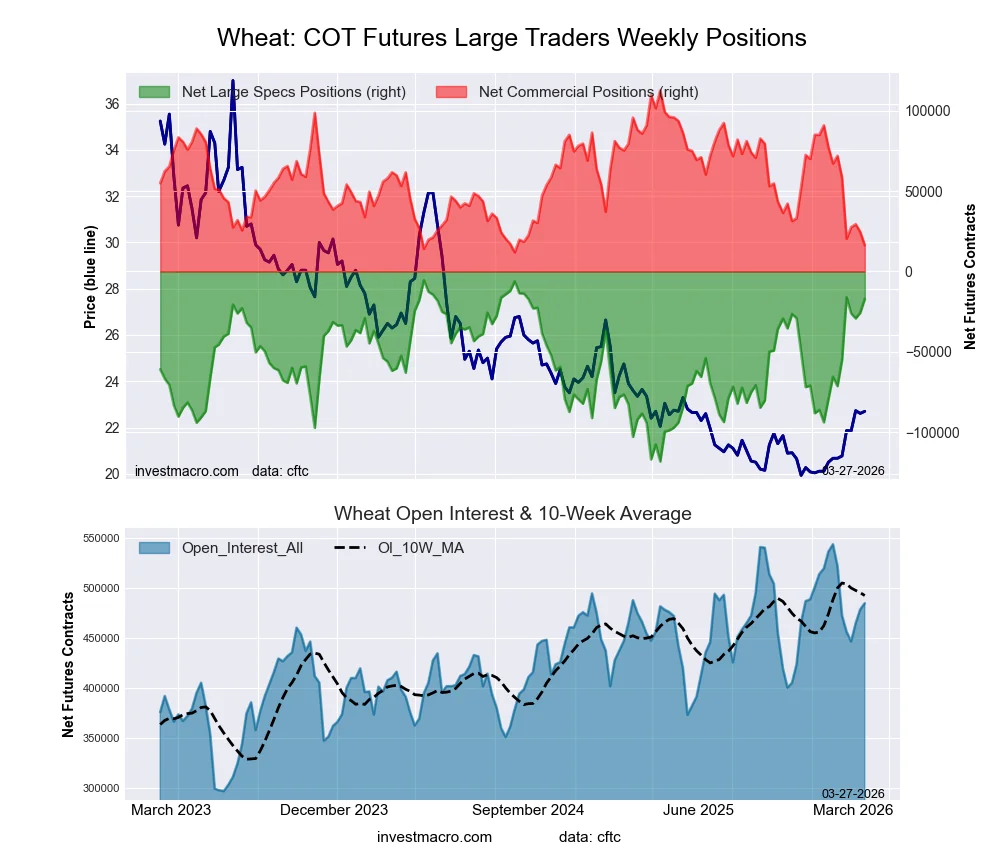 The WHEAT large speculator standing this week equaled a net position of -17,088 contracts in the data reported through Tuesday. This was a weekly boost of 8,580 contracts from the previous week which had a total of -25,668 net contracts.
This week’s current strength score (the trader positioning range over the past three years, measured from 0 to 100) shows the speculators are currently Bullish-Extreme with a score of 89.6 percent. The commercials are Bearish-Extreme with a score of 4.4 percent and the small traders (not shown in chart) are Bullish with a score of 58.4 percent.
Price Trend-Following Model: Strong Uptrend
Our weekly trend-following model classifies the current market price position as: Strong Uptrend.
| WHEAT Futures Statistics | SPECULATORS | COMMERCIALS | SMALL TRADERS |
| – Percent of Open Interest Longs: | 28.3 | 34.5 | 6.7 |
| – Percent of Open Interest Shorts: | 31.8 | 31.1 | 6.5 |
| – Net Position: | -17,088 | 16,349 | 739 |
| – Gross Longs: | 137,228 | 167,283 | 32,319 |
| – Gross Shorts: | 154,316 | 150,934 | 31,580 |
| – Long to Short Ratio: | 0.9 to 1 | 1.1 to 1 | 1.0 to 1 |
| NET POSITION TREND: | | | |
| – Strength Index Score (3 Year Range Pct): | 89.6 | 4.4 | 58.4 |
| – Strength Index Reading (3 Year Range): | Bullish-Extreme | Bearish-Extreme | Bullish |
| NET POSITION MOVEMENT INDEX: | | | |
| – 6-Week Change in Strength Index: | 48.1 | -55.2 | 8.1 |
Article By InvestMacro – Receive our weekly COT Newsletter
*COT Report: The COT data, released weekly to the public each Friday, is updated through the most recent Tuesday (data is 3 days old) and shows a quick view of how large speculators or non-commercials (for-profit traders) were positioned in the futures markets.
The CFTC categorizes trader positions according to commercial hedgers (traders who use futures contracts for hedging as part of the business), non-commercials (large traders who speculate to realize trading profits) and nonreportable traders (usually small traders/speculators) as well as their open interest (contracts open in the market at time of reporting). See CFTC criteria here.