By JustMarkets
At the end of Thursday, the Dow Jones Index (US30) decreased by 0.86%. The S&P 500 Index (US500) is down 0.60%. The NASDAQ Technology Index (US100) closed negative 1.08%. Meanwhile, the S&P 500 (US500) fell to a 2-week low, the Dow Jones (US30) fell to a 4-week low, and the NASDAQ (US100) fell to a 1-week low. Stocks came under pressure due to concerns that the Federal Reserve will keep interest rates on hold longer, leading to a decline in risk sentiment in asset markets. The US weekly initial jobless claims rose by 3,000 to 219,000, indicating a slightly weaker labor market than expected at 217,000. The US Q1 GDP was revised downward to 1.3% (q/q annualized) from 1.6%, which aligned with expectations. Today, markets await Friday’s PCE deflator data for April, the Fed’s preferred inflation gauge, for clues on when the Fed might start cutting interest rates. The core PCE deflator for April is expected to be unchanged from March at 2.8% y/y.
Salesforce (CRM) is down more than 19%. It tops the list of losers in the S&P 500 and Dow Jones Industrials after reporting first-quarter revenue of $9.13 billion, below the consensus of $9.15 billion, and estimating 2025 revenue of $37.7 billion to $38.0 billion, weaker than the consensus of $38.01 billion. Nvidia (NVDA) closed down more than 3% after Bloomberg reported that the US is slowing licenses to chipmakers for large-scale shipments of artificial intelligence gas pedals to the Middle East. At the same time, officials conduct a national security review of AI development in the region. HP Inc (HPQ) stock price rose more than 16% and topped the list of top gainers in the S&P 500 after the company reported second-quarter net revenue of $12.80 billion, beating the consensus prognosis of $12.60 billion. Shares of PayPal Holdings (PYPL) rose more than 2% and topped the Nasdaq 100 leaderboard after Mizuho Securities upgraded the stock to “buy” from “neutral” with a $90 price target.
Equity markets in Europe mostly went up yesterday. Germany’s DAX (DE40) rose by 0.13%, France’s CAC 40 (FR40) closed up 0.55%, Spain’s IBEX 35 (ES35) gained 1.73%, and the UK’s FTSE 100 (UK100) closed positive 0.59%.
The Eurozone unemployment rate for April unexpectedly fell by 0.1 to a record low of 6.4%, indicating a stronger labor market than expectations of no change at 6.5%. Spain’s May CPI (EU harmonized) rose to 3.8% y/y, exceeding expectations of 3.7% y/y and the largest increase in 13 months. May Eurozone economic confidence rose by 0.4 to 96.0, slightly weaker than expectations of 96.1. Strong Eurozone economic data, along with rising inflationary pressures, may force the ECB to become more hawkish after the first rate cut in June.
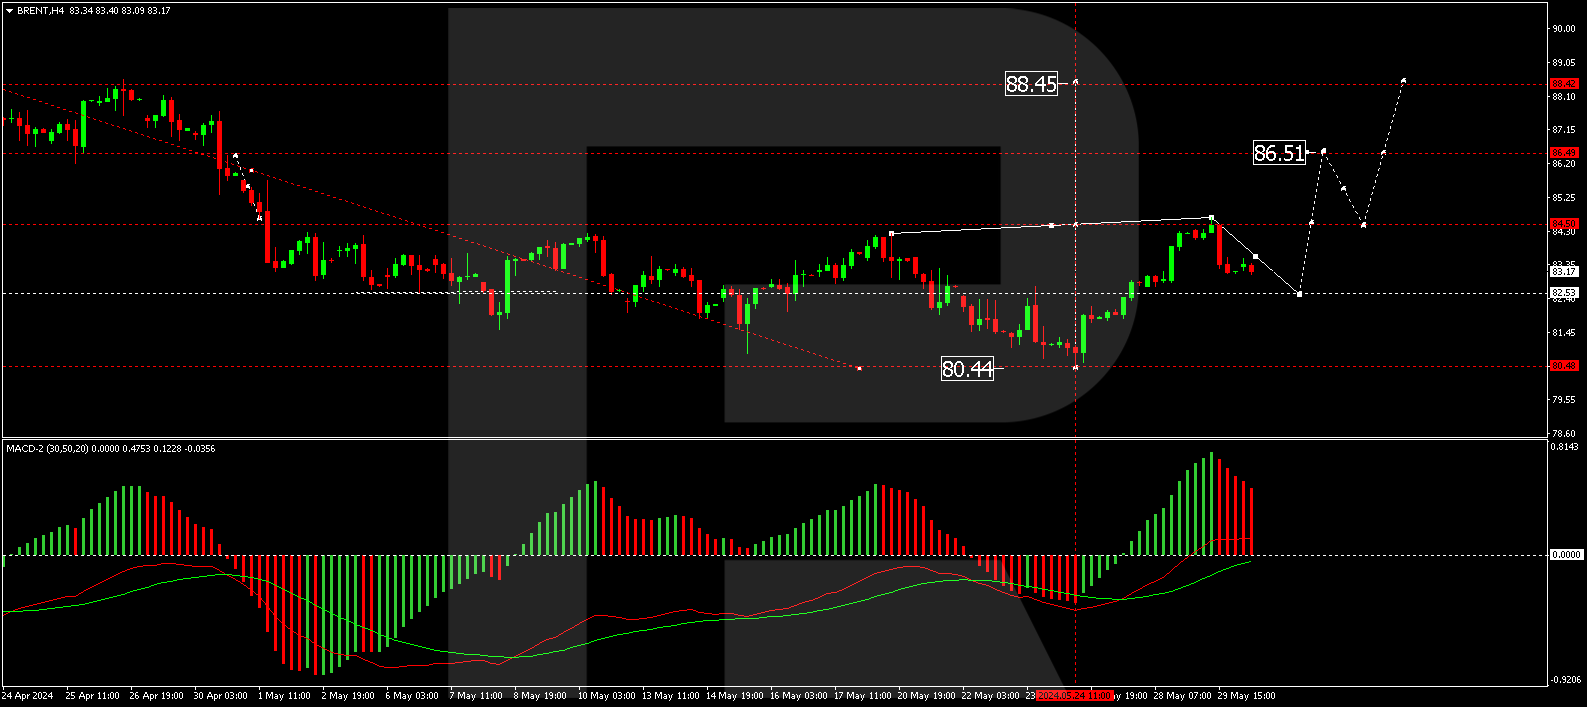
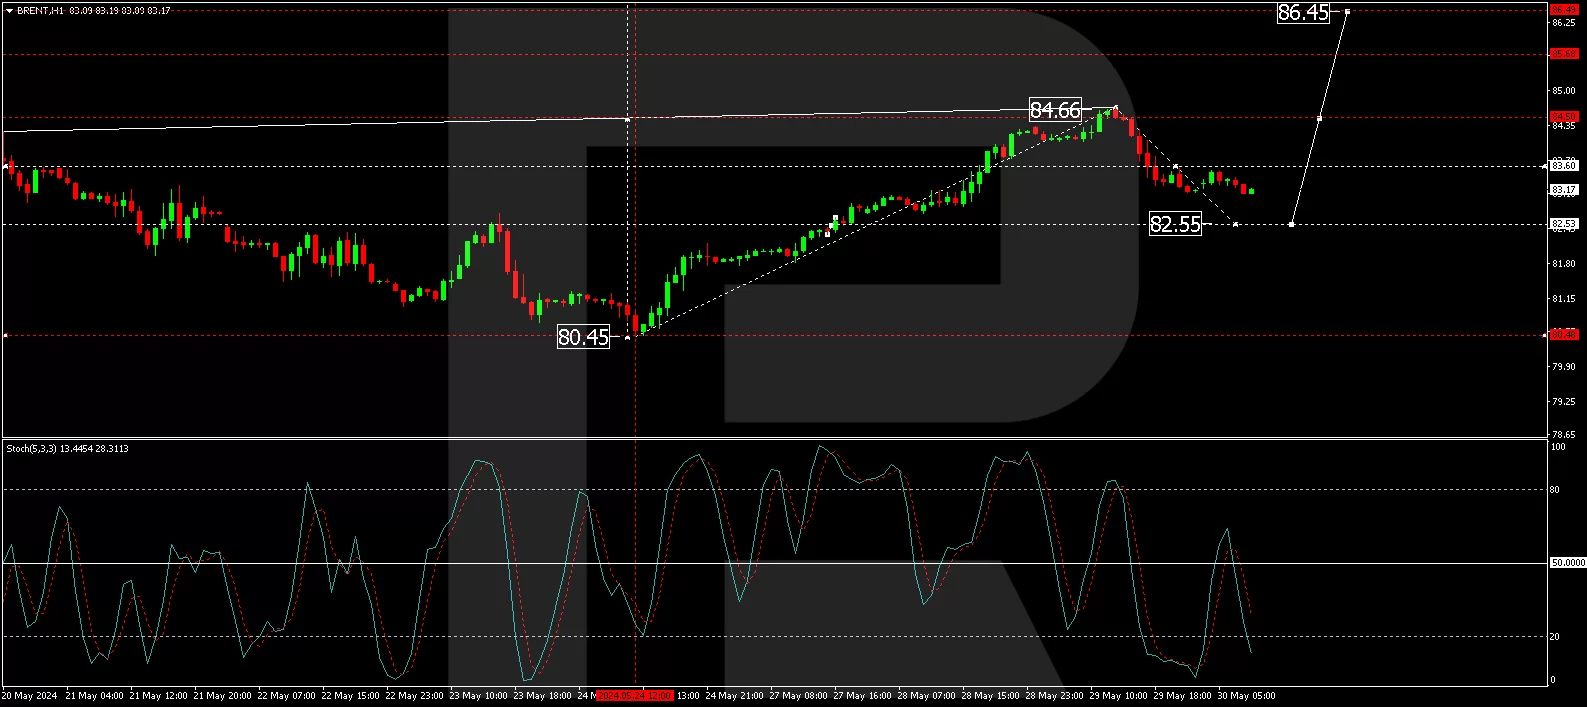
WTI crude futures fell to $77.5 a barrel on Friday, declining for the third consecutive session, as uncertainty over demand weighs on oil markets. Revised data on Thursday showed the US economy grew at an annualized rate of 1.3% in the first quarter, down from preliminary estimates of 1.6%. A Federal Reserve official also said she remained concerned about upside risks to inflation and urged caution in policy adjustments, another blow to hopes of lower US interest rates. Meanwhile, EIA data showed that US crude oil inventories fell by 4.2 million barrels last week, compared with expectations of a 1.9 million barrel decline. Investors now await the OPEC+ meeting on Sunday, which is expected to extend supply cuts through 2025.
Asian markets were mostly down on Monday. Japan’s Nikkei 225 (JP225) was down 1.30% for the day, China’s FTSE China A50 (CHA50) lost 0.88%, Hong Kong’s Hang Seng (HK50) decreased by 1.34%, and Australia’s ASX 200 (AU200) was negative 0.49%.
The offshore yuan stabilized at 7.25 per dollar after falling to its lowest level in more than a month in the previous session, reacting to weaker-than-expected Chinese PMI data and recent developments in the US. The latest data showed that China’s manufacturing activity unexpectedly fell to 49.5 in May 2024 from April’s 50.4, falling short of the market’s prognosis of 50.5. The contraction, the first since February, raised concerns about the health of China’s economy and prompted new stimulus measures.
Retail sales in Japan rose by 2.4% year-on-year in April 2024, accelerating after a downwardly revised 1.1% increase in the previous month, which was the lowest in two years. The data exceeded market estimates of 1.9%, marking the 26th consecutive month of retail sales growth. Preliminary data showed that Japan’s industrial production fell by 0.1% month-on-month in April 2024, missing market prognoses for a 0.9% rise and bouncing back from a 4.4% increase, the sharpest increase since June 2022. Japan’s unemployment rate stood at 2.6% in April 2024, unchanged for the third month and in line with market estimates. It is the highest unemployment rate since September last year. The core Consumer Price Index in Tokyo, Japan, rose to 1.9% year-on-year in May 2024, accelerating from a two-year low of 1.6% in April, which aligns with expectations. The Tokyo inflation data is a leading indicator of price developments across the country, as national CPI data will be released in about three weeks.
S&P 500 (US500) 5,235.48 −31.47 (−0.60%)
Dow Jones (US30) 38,111.48 −330.06 (−0.86%)
DAX (DE40) 18,496.79 +23.50 (+0.13%)
FTSE 100 (UK100) 8,231.05 +47.98 (+0.59%)
USD Index 104.75 +0.14 (+0.13%)
- – Japan Tokyo Core CPI (m/m) at 02:30 (GMT+3);
- – Japan Unemployment Rate (m/m) at 02:30 (GMT+3);
- – Japan Retail Sales (m/m) at 02:50 (GMT+3);
- – Japan Industrial Production (m/m) at 02:50 (GMT+3);
- – China Manufacturing PMI (m/m) at 04:30 (GMT+3);
- – China non-Manufacturing PMI (m/m) at 04:30 (GMT+3);
- – New Zealand Annual Budget Release at 05:00 (GMT+3);
- – German Retail Sales (m/m) at 09:00 (GMT+3);
- – Switzerland Retail Sales (m/m) at 09:30 (GMT+3);
- – Eurozone Consumer Price Index (m/m) at 12:00 (GMT+3);
- – US Core PCE Index (m/m) at 15:30 (GMT+3);
- – Canada GDP (m/m) at 15:30 (GMT+3);
- – US Chicago PMI (m/m) at 16:45 (GMT+3).
By JustMarkets
This article reflects a personal opinion and should not be interpreted as an investment advice, and/or offer, and/or a persistent request for carrying out financial transactions, and/or a guarantee, and/or a forecast of future events.