By JustMarkets
On Tuesday, US stock indices continued to decline amid the ongoing sell‑off in US Treasury bonds and rising investor concerns about inflation driven by the conflict in the Middle East.
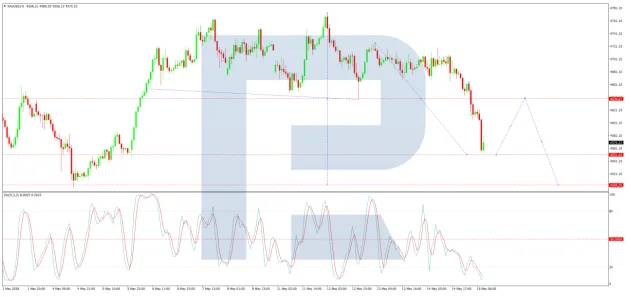
By the end of the day, the Dow Jones (US30) fell by 0.67%. The S&P 500 (US500) declined by 0.67%. The Technology Index NASDAQ (US100) closed lower by 0.61%. Pressure on the market intensified due to rising bond yields, as investors fear that high energy prices may force the Federal Reserve to maintain tight monetary policy for longer.
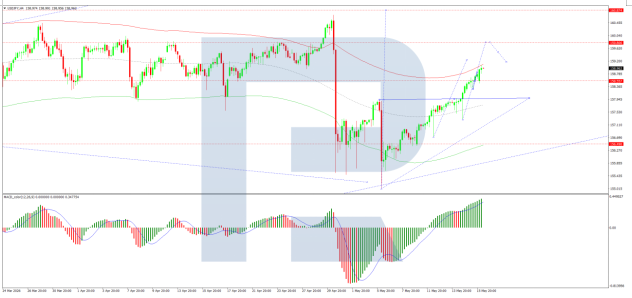
The Canadian dollar weakened to 1.38 per US dollar amid a decline in core inflation in Canada, which strengthened expectations that the Bank of Canada will continue to take a cautious approach and will not respond to rising energy prices with policy tightening. Despite headline inflation accelerating to 2.8% in April due to higher gasoline prices amid the Middle East conflict, the key core inflation indicators monitored by the regulator fell more than expected, reaching their lowest levels in the past five years. This reinforced the market’s view that inflationary pressure outside the energy sector remains limited.
By the end of the day, Germany’s DAX (DE40) rose by 0.38%, France’s CAC 40 (FR40) closed down by 0.07%, Spain’s IBEX 35 (ES35) fell by 0.48%, and the UK’s FTSE 100 (UK100) ended the session up by 0.07%.
WTI oil prices fell to around 103 dollars per barrel, partially pulling back after the recent rally. Pressure on prices emerged after US President Trump stated that he had canceled a planned military strike on Iran following requests from Gulf states and amid signs of a possible return to negotiations. Previously, oil had been supported by more than a week of gains driven by stalled US-Iran talks and the effective restriction of shipping through the Strait of Hormuz – a key route for global oil trade. An additional factor was a new US authorization allowing the sale of Russian oil and petroleum products already loaded onto tankers, which added expectations of increased short‑term supply to the market.
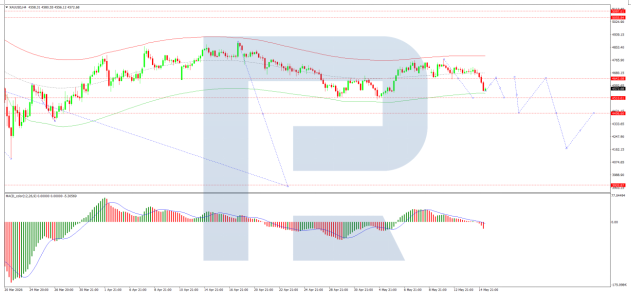
Palladium prices (XPD) stabilized near 1,400 dollars per ounce, pausing their decline after reaching a seven‑week low. The market was supported by easing pressure on the precious metals sector after signs of possible progress in negotiations between the US and Iran. This somewhat reduced concerns about further increases in energy prices and the risk of a prolonged period of high interest rates. At the same time, the fundamental situation in the palladium market remains relatively tight. Concerns about limited supply from key producers continue to support prices. Against this backdrop, JPMorgan expects that palladium prices will rise to 1,600 dollars per ounce by the fourth quarter of 2026.
In Asia, Japan’s Nikkei 225 (JP225) fell by 0.44%, China’s FTSE China A50 closed up by 0.26%, Hong Kong’s Hang Seng (HK50) rose by 0.48%, and Australia’s ASX 200 (AU200) increased by 1.17%.
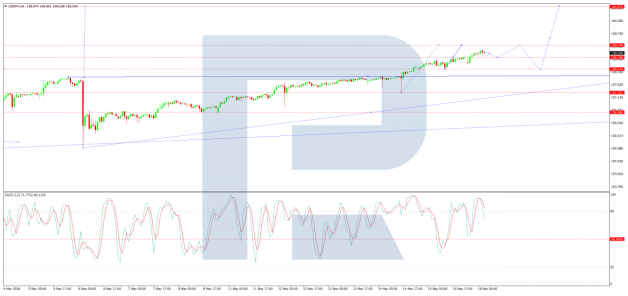
On Wednesday, the offshore yuan strengthened slightly to around 6.81 per dollar, partially recovering after the previous session’s decline. The Chinese currency was supported by the decision of the People’s Bank of China to keep key lending rates unchanged: the one‑year LPR remained at 3.0%, and the five‑year LPR stayed at 3.5%. This marks the twelfth consecutive month without changes, reflecting the cautious approach of Chinese authorities amid rising geopolitical uncertainty.
S&P 500 (US500) 7,353.61 −49.44 (−0.67%)
Dow Jones (US30) 49,363.88 −322.24 (−0.65%)
DAX (DE40) 24,400.65 +92.73 (+0.38%)
FTSE 100 (UK100) 10,330.55 +6.80 (+0.07%)
USD Index 99.31 +0.12 (+0.12%)
News feed for: 2026.05.20
- China PBoC Loan Prime Rate at 04:15 (GMT+3) – CHA50, HK50 (HIGH)
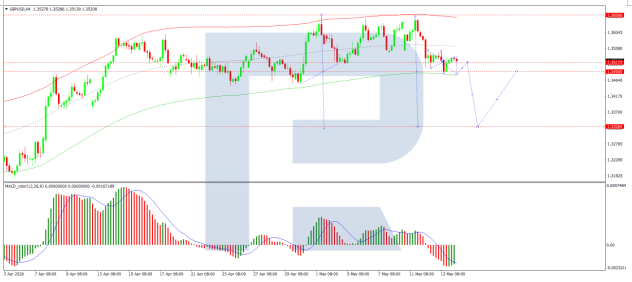
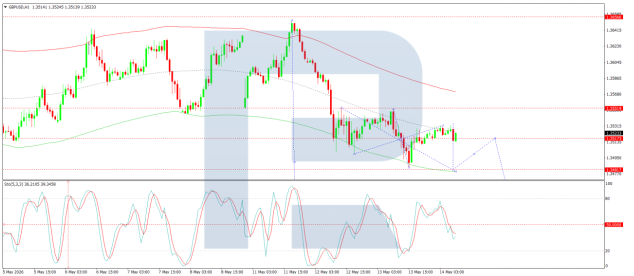
- UK Consumer Price Index (m/m) at 09:00 (GMT+3) – GBP (HIGH)
- UK Producer Price Index (m/m) at 09:00 (GMT+3) – GBP (MED)
- Eurozone Consumer Price Index (m/m) at 12:00 (GMT+3) – EUR (MED)
- US Crude Oil Reserves (w/w) at 17:30 (GMT+3) – WTI (HIGH)
- US FOMC Meeting Minutes at 21:00 (GMT+3) – USD (HIGH)
By JustMarkets
This article reflects a personal opinion and should not be interpreted as an investment advice, and/or offer, and/or a persistent request for carrying out financial transactions, and/or a guarantee, and/or a forecast of future events.