Archive for Energy – Page 5

US solar manufacturers lag skyrocketing market demand

By Mojtaba Akhavan-Tafti, University of Michigan 

U.S. consumer demand for renewable energy continues to grow, with more solar panel capacity installed in 2024 than in 2023, which saw more than in 2022. But U.S. trade policy is in flux, and high tariffs have been imposed on imported solar panels, which may cause shortages.

I am a scholar who studies the Sun, as well as an entrepreneur who is working to harness its power here on Earth by creating new designs for generating solar electricity. As part of that effort, I’ve studied market trends and manufacturing capabilities in the U.S. and abroad. Right now, U.S. manufacturers do not produce enough solar panels to meet the nation’s demand, but industry investments and federal tax incentives have been making progress, though recent federal moves have created uncertainty.

In 2024, U.S. installers put up enough solar panels to generate 50 gigawatts of electricity – enough to power New York City for a year.

U.S. manufacturers made only a small fraction of that – 4.2 GW of solar modules in the first half of 2024. That was a big boost, though – a 75% increase compared with the same period in 2023. And the prices were roughly three times the cost of imports.

A look at recent imports

In 2024, the U.S. imported far more panels than the country needed, suggesting developers may be stockpiling panels for future projects.

Most of those imported panels were made in Asia, particularly Malaysia, Vietnam and Thailand. In fact, nearly all of the U.S.-made panels used at least some components from overseas. China currently makes about 97% of the world’s supply of photovoltaic wafers, which are building blocks of solar panels.

The effects of proposed U.S. trade policies on the solar industry remain unclear. Through 2024, manufacturing continued a yearslong ramp-up to take advantage of government policies favoring domestic manufacturing. And imported panels seem slated to suffer from ever-increasing tariffs, which drive up costs.

Domestic production rises

Since 2010, U.S. solar panel production has increased about eightfold. But U.S.-made panels are more expensive than imported alternatives. In 2024, U.S.-made panels typically cost 31 cents per watt, but imported panels, even including tariffs that existed before President Donald Trump’s second term, cost about one-third of that: 11 cents per watt.

But domestic manufacturers are bringing costs down by ramping up production while relying on the government to maintain or increase tariffs on imports, which may make U.S. panels more competitive domestically in the future.

Reliance on overseas sources

Despite that increase in domestic production, U.S. demand for solar panels has grown even faster. To meet demand, the U.S. imports a substantial portion of its solar photovoltaic modules.

Tariffs, including a 30% tariff on solar cells and solar panels starting in 2018, aimed to boost domestic manufacturing.

But those tariffs and falling global prices made solar installations more costly in the U.S. than in the rest of the world. The average global cost of installed solar systems dropped from $1.15 per watt in 2012 to $0.72 per watt in 2016, nearly half that of U.S. installations.

The 2018 tariffs, as well as earlier rounds in 2012 and 2014, have shifted the source of U.S. imports of solar panels – from China and Taiwan to Malaysia and South Korea. Manufacturers are also building solar panels in Singapore and Germany to maintain access to the U.S. market. And Chinese companies are even investing in U.S. solar manufacturers to take advantage of federal incentives and avoid tariffs.

New tariffs emerge

Trump’s proposal for new tariffs on foreign-made solar goods, including panels and components, particularly target Chinese-owned companies in Southeast Asia.

They could include a potential 375% tariff on Thai products – nearly quadrupling prices – and a 3,500% tariff on products from Cambodia.

In contrast, U.S.-made solar panels will be cheaper. But a reduced supply of solar panels will raise prices even of domestic-made panels, at least until U.S. manufacturing can catch up with the demand. Some developers have begun to delay or cancel solar installations to address rising costs.

Domestic investment

Due in large part to the Biden administration’s Inflation Reduction Act, enacted in 2022, the U.S. solar panel industry has seen significant investments.

Since the law’s enactment, more than 95 GW of manufacturing capability have been added across the solar supply chain in the U.S., including new facilities that in a year can construct enough solar panels to produce nearly 42 GW, beyond existing manufacturing levels. This growth in manufacturing capabilities is largely located in Texas and Georgia.

Still, the new administration’s shifting priorities and trade policies make the landscape uncertain. Before Trump began discussing various solar-related trade policies, the industry projected it would install an average of 45 GW of solar panels every year for the next decade.The Conversation

About the Author:

Mojtaba Akhavan-Tafti, Associate Research Scientist, University of Michigan

This article is republished from The Conversation under a Creative Commons license. Read the original article.


Speculator Extremes: Brent, Wheat lead weekly Bullish & Bearish Positions

By InvestMacro

The latest update for the weekly Commitment of Traders (COT) report was released by the Commodity Futures Trading Commission (CFTC) on Friday for data ending on May 13th.

This weekly Extreme Positions report highlights the Most Bullish and Most Bearish Positions for the speculator category. Extreme positioning in these markets can foreshadow strong moves in the underlying market.

To signify an extreme position, we use the Strength Index (also known as the COT Index) of each instrument, a common method of measuring COT data. The Strength Index is simply a comparison of current trader positions against the range of positions over the previous 3 years. We use over 80 percent as extremely bullish and under 20 percent as extremely bearish. (Compare Strength Index scores across all markets in the data table or cot leaders table)


Extreme Bullish Speculator Table


Here Are This Week’s Most Bullish Speculator Positions:

Brent Oil

Extreme Bullish Leader
The Brent Oil speculator position comes in as the most bullish extreme standing this week as the Brent speculator level is currently at a 100 percent score (or maximum) of its 3-year range.

The six-week trend for the percent strength score totaled a rise of 14 points this week. The overall net speculator position was a total of 5,637 net contracts this week with a gain of 3,142 contract in the weekly speculator bets.


Speculators or Non-Commercials Notes:

Speculators, classified as non-commercial traders by the CFTC, are made up of large commodity funds, hedge funds and other significant for-profit participants. The Specs are generally regarded as trend-followers in their behavior towards price action – net speculator bets and prices tend to go in the same directions. These traders often look to buy when prices are rising and sell when prices are falling. To illustrate this point, many times speculator contracts can be found at their most extremes (bullish or bearish) when prices are also close to their highest or lowest levels.

These extreme levels can be dangerous for the large speculators as the trade is most crowded, there is less trading ammunition still sitting on the sidelines to push the trend further and prices have moved a significant distance. When the trend becomes exhausted, some speculators take profits while others look to also exit positions when prices fail to continue in the same direction. This process usually plays out over many months to years and can ultimately create a reverse effect where prices start to fall and speculators start a process of selling when prices are falling.


Japanese Yen

Extreme Bullish Leader
The Japanese Yen speculator position comes next in the extreme standings this week. The JPY speculator level is now at a 98 percent score of its 3-year range.

The six-week trend for the percent strength score was a gain by 14 points this week. The speculator position registered 172,268 net contracts this week with a weekly decline of -4,591 contracts in speculator bets.


VIX

Extreme Bullish Leader
The VIX speculator position comes in third this week in the extreme standings. The VIX speculator level resides at a 96 percent score of its 3-year range.

The six-week trend for the speculator strength score came in at 14 this week. The overall speculator position was 6,099 net contracts this week with a drop of -4,844 contracts in the weekly speculator bets.


Nikkei 225

Extreme Bullish Leader
The Nikkei 225 speculator position comes up number four in the extreme standings this week. The Nikkei 225 speculator level is at a 96 percent score of its 3-year range.

The six-week trend for the speculator strength score totaled a boost by 35 points this week. The overall speculator position was 1,904 net contracts this week with a rise by 2,025 contracts in the speculator bets.


Brazil Real

Extreme Bullish Leader
The Brazil Real speculator position rounds out the top five in this week’s bullish extreme standings. The BRL speculator level sits at a 80 percent score of its 3-year range. The six-week trend for the speculator strength score was 5 this week.

The speculator position was 43,515 net contracts this week with a jump by 18,554 contracts in the weekly speculator bets.


Extreme Bearish Speculator Table


This Week’s Most Bearish Speculator Positions:

Wheat

Extreme Bearish Leader
The Wheat speculator position comes in as the most bearish extreme standing this week. The Wheat speculator level is at a 0 percent score of its 3-year range.

The six-week trend for the speculator strength score was -11 points this week. The overall speculator position was -118,100 net contracts this week with a decrease by -10,563 contracts in the speculator bets.


5-Year Bond

Extreme Bearish Leader
The 5-Year Bond speculator position comes in next for the most bearish extreme standing on the week. The 5-Year speculator level is at a 5 percent score of its 3-year range.

The six-week trend for the speculator strength score was -7 points this week. The speculator position was -2,180,043 net contracts this week with a rise of 116,453 contracts in the weekly speculator bets.


Heating Oil

Extreme Bearish Leader
The Heating Oil speculator position comes in as third most bearish extreme standing of the week. The Heating Oil speculator level resides at a 5 percent score of its 3-year range.

The six-week trend for the speculator strength score was -25 points this week. The overall speculator position was -29,396 net contracts this week with an increase of 2,214 contracts in the speculator bets.


US Dollar Index

Extreme Bearish Leader
The US Dollar Index speculator position comes in as this week’s fourth most bearish extreme standing. The USD Index speculator level is at a 5 percent score of its 3-year range.

The six-week trend for the speculator strength score was -16 points this week. The speculator position was -615 net contracts this week with an advance by 493 contracts in the weekly speculator bets.


2-Year Bond

Extreme Bearish Leader
Finally, the 2-Year Bond speculator position comes in as the fifth most bearish extreme standing for this week. The 2-Year speculator level is at a 18 percent score of its 3-year range.

The six-week trend for the speculator strength score was 0 this week. The speculator position was -1,222,232 net contracts this week with a dip by -1,439 contracts in the weekly speculator bets.


Article By InvestMacroReceive our weekly COT Newsletter

*COT Report: The COT data, released weekly to the public each Friday, is updated through the most recent Tuesday (data is 3 days old) and shows a quick view of how large speculators or non-commercials (for-profit traders) were positioned in the futures markets.

The CFTC categorizes trader positions according to commercial hedgers (traders who use futures contracts for hedging as part of the business), non-commercials (large traders who speculate to realize trading profits) and nonreportable traders (usually small traders/speculators) as well as their open interest (contracts open in the market at time of reporting). See CFTC criteria here.

Utilities choosing coal, solar, nuclear or other power sources have a lot to consider, beyond just cost

By Erin Baker, UMass Amherst and Paola Pimentel Furlanetto, UMass Amherst 

The Trump administration is working to lift regulations on coal-fired power plants in the hopes of making its energy less expensive. But while cost is one important aspect, utilities have a lot more to consider when they choose their power sources.

Different technologies play different roles in the power system. Some sources, like nuclear energy, are reliable but inflexible. Other sources, like oil, are flexible but expensive and polluting.

How utilities choose which power source to invest in depends in large part on two key aspects: price and reliability.

Power prices

One way to compare power sources is by their levelized cost of electricity. This shows how much it costs to produce one unit of electricity on average over the life of the generator.

The asset management firm Lazard has produced levelized cost of electricity calculations for the major U.S. electricity sources annually for years, and it has tracked a sharp decline in solar power costs in particular.

Coal is one of the more expensive technologies for utilities today, making it less competitive compared with solar, wind and natural gas, by Lazard’s calculations. Only nuclear, offshore wind and “peaker” plants, which are used only during periods of high electricity demand, are more expensive.

Land-based wind and solar power have the lowest estimated costs, far below what consumers are paying for electricity today. The National Renewable Energy Lab has found similar levelized costs for renewable energy, though its estimates for nuclear are lower than Lazard’s.

Upfront costs are also important and can make the difference for whether new power projects can be built, as the East Coast has seen lately.

Several offshore wind farms planned along the Northeast were canceled in recent years as costs rose due to inflation and supply chain problems during the pandemic. Construction costs for the two newest nuclear generators built in the U.S. also rose considerably as the projects, both in the Southeast, faced delays.

Reliability and flexibility matter

But cost is not the whole story. Utilities must balance a number of criteria when investing in power sources.

Most important is matching supply and demand at every moment of the day. Due to the technical characteristics of electricity and how it flows, if the supply of electricity is even a little bit lower than the demand, that can trigger a blackout. This means power companies and consumers need generation that can ramp down when demand is low and ramp up when demand is high.

Since wind and solar generation depend on the wind blowing and the sun shining, these sources must be combined with other types of generation or with storage, such as batteries, to ensure the power grid has exactly as much power as it needs at all times.

Nuclear and coal are predictable and run reliably, but they are inflexible – they take time to ramp up and down, and doing so is expensive. Steam turbines are simply not built for flexibility. The multiple days it took to shut down Japan’s Fukushima Daiichi Nuclear Power Plant after an earthquake and tsunami damaged its backup power sources in 2011 illustrated the challenges and safety issues related to ramping down nuclear plants.

That means coal and nuclear aren’t as helpful on those hot summer days when utilities need a quick power increase to keep air conditioners running. These peaks may only happen a few days a year, but keeping the power on is crucial for human health and the economy.

In today’s energy system, the most flexible generation sources are natural gas and hydro. They can quickly adjust to meet changing electricity demand without the safety and cost concerns of coal and nuclear. Hydro can ramp in minutes but can only be built where large dams are feasible. The most cost-effective natural gas technology can ramp up within hours.

The big picture, by power source

Over the past two decades, natural gas use has risen quickly to overtake coal as the most common fuel for generating electricity in the U.S. The boom was largely driven by the growing use of fracking technology, which allowed producers to extract gas from rock and lowered the price.

Natural gas’s low price and high flexibility make it an attractive choice. Its rise is a large part of the reason coal use has plummeted.

But natural gas has its challenges. Natural gas requires pipelines to carry it across the country, leading to disruptive construction. As Texas saw during its February 2021 blackouts, natural gas equipment can also fail in extreme cold. And like coal, natural gas is a fossil fuel that releases greenhouse gases during combustion, so it is also helping to cause climate change and contributes to air pollution that can harm human health.

Nuclear power has been gaining interest recently since it does not contribute to climate change or local air pollution. It also provides a steady baseload of power, which is useful for computing centers as their demand does not fluctuate as much as households.

Of course, nuclear has ongoing challenges around the storage of radioactive waste and security concerns, and construction of large nuclear plants takes many years.

Coal is more flexible than nuclear, but far less so than natural gas or hydropower. Most concerning, coal is extremely dirty, emitting more climate-change-causing gases, and far more air pollution than natural gas.

Solar and wind have grown rapidly in recent years due to their falling costs and environmental benefits. According to Lazard, the cost of solar combined with batteries, which would be as flexible as hydropower, is well below the cost of coal with its limited flexibility.

However, wind and solar tend to take up a lot of space, which has led to challenges in local approvals for new sites and transmission lines. In addition, the sheer number of new projects is overwhelming power system operators’ ability to evaluate them, leading to increasing wait times for new generation to come online.

What’s ahead?

Utilities have another consideration: Federal, state and local governments can also influence and sometimes limit utilities’ choices. Tariffs, for example, can increase the cost of critical components for new construction. Permitting and regulations can slow down development. Subsidies can artificially lower costs.

In our view, policies that are done right can help utilities move toward more reliable and cost-effective choices which are also cleaner. Done wrong, they can be costly to the economy and the environment.The Conversation

About the Author:

Erin Baker, Distinguished Professor of Industrial Engineering and Faculty Director of The Energy Transition Institute, UMass Amherst and Paola Pimentel Furlanetto, Ph.D. candidate in Industrial Engineering and Operations Research, UMass Amherst

This article is republished from The Conversation under a Creative Commons license. Read the original article.


Week Ahead: Crude caught in crosswinds ahead of OPEC+ showdown

By ForexTime 

  • Crude ends April ↓ 18.6%
  • OPEC+ expected to sign off another supply hike
  • Positive US-China trade may support oil bulls
  • Fed decision sparked moves of ↑ 0.4% & ↓ 0.9% over past year
  • Technical levels: $65, $60 & $55

As the countdown draws closer to the key US jobs report this afternoon (Friday, 2nd May), markets are bracing for more volatility in the week ahead.

An influx of high-impact data, risk events and key central bank decisions could present fresh trading opportunities:

Saturday, 3rd May 

  • AUD: Australia general election

Sunday, 4th May 

  • Asian Development Bank annual meeting

Monday, 5th May 

  • UK markets closed for Bank holiday
  • OIL: OPEC+ meeting on production levels
  • USDInd: US ISM services

Tuesday, 6th May 

  • AUD: Australia building approvals
  • CN50: China Caixin services PMI
  • EUR: Eurozone HCOB services PMI, PPI
  • US500: US Treasury Secretary Scott Bessent testimony

Wednesday, 7th May

  • CNY: China forex reserves
  • EUR: Eurozone retail sales
  • GER40: Germany factory orders
  • TWN: Taiwan CPI
  • US500: US Fed rate decision

Thursday, 8th May

  • GER40: Germany industrial production
  • ZAR: South Africa manufacturing production
  • UK100: BOE rate decision
  • SEK: Sweden rate decision
  • RUS200: US jobless claims

Friday, 9th May

  • CN50: China trade
  • JP225: Japan household spending, cash earnings
  • CAD: Canada employment
  • USDInd: Fed governors Lisa Cook, Christopher Waller, St. Louis Fed President Alberto Musalem, Cleveland Fed President Beth Hammack, Chicago Fed President Austan Goolsbee speech

Our focus lands on oil benchmarks which have shed over 17% year-to-date amid global recession fears and oversupply worries.

Imagen
Crude oil

Crude prices have recently rebounded on easing trade tensions and new sanctions on Iran. However, the global commodity is still headed for a weekly loss of more than 6%.

And things could spice up further in the week ahead. Here are 4 reasons why:


1) OPEC+ meeting on production levels

On Monday 5th May, OPEC+ will meet to decide the supply policy for June. 

Earlier in April, Saudi Arabia shocked markets by pushing OPEC+ for faster output increases in May after Kazakhstan and Iraq produced well above quotas.

Markets expect the cartel to sign off on another supply surge to punish over-producing members.

But most importantly, infighting within the cartel and overproduction could be a recipe for disaster for oil, especially if it leads to a “free-for-all” where members pump at will.

  • Oil prices may tumble if OPEC+ pushes for faster production hikes with any signs of internal instability fuelling downside pressures.
  • Should OPEC+ surprise by slowing down or pausing output hikes, this could boost oil prices as oversupply fears cool.


2) US-China trade talks

Market sentiment has received a boost after China said it’s evaluating trade talks with the United States. This comes after weeks of conflicting reports and uncertainty around US-China trade talks.

If this soothes tensions and opens the doors to concrete negotiations, this could cool concerns about a global recession. 

  • More positive progress with US-China trade talks may support oil prices as investors become more hopeful about the demand outlook.
  • Should the talks lead to more uncertainty or result in renewed tensions, oil prices may take a hit.


3) Fed rate decision

The Fed is widely expected to leave interest rates unchanged at its May meeting, but all eyes will be on Fed Chair Jerome Powell’s press conference.

Friday’s incoming US jobs report along with developments on the trade front, may influence what tone Powell strikes on Wednesday 7th May. 

Traders are currently pricing in 3 rate cuts in 2025 with the probability of a 4th one by December at 67%. Any major shifts to these expectations may influence oil prices. 

  1. Lower interest rates could stimulate economic growth, which fuels oil demand.
  2. Lower interest rates may also lead to a weaker dollar, boosting oil which is priced in dollars.

The same can be said vice versa.

  • If Powell strikes a hawkish note and the dollar appreciates, oil prices may slip. 
  • If Powell sounds more dovish and signals faster rate cuts, oil prices may jump. 


Over the past 12 months, the Fed rate decision has triggered upside moves on CRUDE of as much as 0.4% or declines of 0.9% in a 6-hour window post-release.


4) Technical forces

Crude is under pressure on the daily charts with prices trading below the 50, 100 and 200-day SMA. However, the Relative Strength Index (RSI) is close to 30, signalling that prices are oversold.

  • A solid breakout and daily close above $60 may pave a path toward the 50-day SMA near $65.00 and potentially the 100-day SMA $68.80 in the medium to longer term.
  •  Should $60 prove to be a tough resistance, prices may slip back towards $55 and levels not seen since January 2021 at $51.50. 


Imagen
crude d3

Note: This chart was created before the release of the US NFP report on Friday 2nd May. 


Forex-Time-LogoArticle by ForexTime

ForexTime Ltd (FXTM) is an award winning international online forex broker regulated by CySEC 185/12 www.forextime.com

Drilling down: Key factors that could impact oil prices this week

By ForexTime 

  • Oil prices ↑ almost 2% this week
  • Russian/Iran supply concerns overshadow Trump’s tariff
  • EIA, OPEC and IEA monthly oil market reports in focus
  • Brent: US CPI sparked moves of ↑ 1.9% & ↓ 1.2% over past year
  • Technical levels: 200-day SMA, $76.00 and $74.00

Oil benchmarks are up almost 2% this week as tighter Russian crude supply overshadowed fears around Trump’s expanding tariffs.

Data from Russia revealed that production in January slipped below the nation’s OPEC+ quota. This adds to the rising concerns over supply following US sanctions on Iran’s oil exports.

Mounting geopolitical tensions in the Middle East amid Trump’s involvement could compound supply fears, fuelling oil’s upside gains.

Brent has climbed above $76.00, while WTI crude is trading at $73 as of writing.

Despite the recent rebound, Trump’s tariff drama could create obstacles down the road.

Trump recently imposed 25% tariffs on US steel and aluminium imports, scheduled to take effect on March 12.

He also plans to slap reciprocal tariffs sometime this week that will affect ‘everyone’.

Higher tariffs could threaten global growth, hitting demand for oil and resulting in lower prices. This uncertainty may force OPEC+ to delay increasing production beyond April 2025.

Regarding the week ahead, oil could be rocked by a cocktail of high-risk events.

Three of the most influential oil forecasters – EIA, OPEC and EIA will publish their latest monthly market outlooks. Fed Chair Jerome Powell’s 2-day testimony and the latest US CPI could inject oil prices with additional volatility.

Here is what you need to know:


    1) Oil monthly market outlooks

The Energy Information Administration (EIA) is scheduled to publish its monthly oil market on Tuesday afternoon.

On Wednesday, OPEC will publish its latest oil market report and on Thursday the International Energy Agency (IEA) releases its own.

Any fresh insight into the outlook for oil markets and demand forecasts among other themes may move Brent/Crude prices.


    2) Powell’s 2-day testimony & US CPI

As highlighted in our week ahead report, Powell’s testimony and the US CPI data may influence Fed cut bets.

Lower US interest rates could stimulate economic growth, fueling oil demand. Lower rates may also weaken the dollar, boosting oil which is priced in dollars. The same is true vice versa.

Over the past 12 months, the US CPI has triggered upside moves on Brent of as much as 1.9% or declines of 1.2% in a 6-hour window post-release.


    3) Technical forces

Brent has staged a solid rebound from $74 with prices trading above the 50 and 100-day SMA.

  • A solid daily close above $76 could encourage a move toward the 200-day SMA at $77.50 and $78.40.
  • Should prices slip back below $76, bears may target the 50-day and 100-day SMA before retesting $74.

Brent


Forex-Time-LogoArticle by ForexTime

ForexTime Ltd (FXTM) is an award winning international online forex broker regulated by CySEC 185/12 www.forextime.com

Oil down 4 consecutive sessions since Trump’s inauguration. Natural gas prices rise again due to cold weather

By JustMarkets

The Dow Jones Index (US30) was up 0.30% at Wednesday’s close. The S&P 500 Index (US500) was up 0.61%. The Nasdaq Technology Index (US100) added 1.33%. US stocks closed solidly higher yesterday, helped by strong earnings and promising corporate developments while markets assessed the implications of President Trump’s policy changes. Netflix rose by 9.7% after reporting a record increase in new subscribers. Additionally, Procter & Gamble shares added 1.9% on strong quarterly results. Oracle increased by 6.7%, delivering a nearly 20% weekly gain after announcing a joint venture with SoftBank and OpenAI related to a $500 billion artificial intelligence investment initiative. Nvidia rose by 4.4% and Microsoft added 4.1%, joining the broader technology rally.

Equity markets in Europe were mostly up on Wednesday. Germany’s DAX (DE40) rose by 1.01%, France’s CAC 40 (FR40) closed higher by 0.86%, Spain’s IBEX 35 (ES35) fell by 0.37%, and the UK’s FTSE 100 (UK100) closed negative 0.04%. On Wednesday, the DAX Index closed above a new record high of 21,259, posting its eighth consecutive session of gains and outperforming its European peers. The index was boosted by strong earnings from Adidas and optimism about large-scale investments in artificial intelligence. In Davos, ECB President Christine Lagarde warned Europe to anticipate possible changes in US trade policy, including selective tariffs under President Trump. She advocated economic reforms, supported the ECB’s cautious approach to lowering interest rates and cited energy prices as the main inflationary problem.

WTI crude prices fell to as low as $75 a barrel on Thursday, retreating for a fifth straight session after an industry report showed a new rise in US crude inventories. API data showed a 1 million barrel increase in crude inventories last week, the first rise after five weeks of declines. Traders also continued to assess the potential impact on energy markets of President Trump’s proposed tariffs on China, the European Union, Canada and Mexico, as well as warnings of sanctions on Russia if President Putin does not work to end the war in Ukraine.

The US natural gas (XNG/USD) prices rose to $3.9/MMBtu as cold temperatures led to record demand. On January  21, the coldest day in five years, heating demand surged, pushing spot gas and electricity prices to multi-year highs. Analysts expect energy companies to draw more than 200 billion cubic feet of gas from storage for two consecutive weeks, reversing a small inventory surplus compared with the five-year average.

South African inflation rose slightly to 3% in December 2024, up from 2.9% in November, but below the 3.2% projection. This rate remains well below the Reserve Bank of South Africa’s preferred average target of 4.5%. Core inflation, which excludes volatile categories such as food, soft drinks, fuel and energy, fell to 3.6% in December 2024, the lowest since February 2022, down from 3.7% in November.

Asian markets traded without a single dynamic yesterday. Japan’s Nikkei 225 (JP225) added 1.58%, China’s FTSE China A50 (CHA50) was down 1.48%, Hong Kong’s Hang Seng (HK50) was down 1.63%, and Australia’s ASX 200 (AU200) was positive 0.33%.

Singapore’s annualized inflation rate for December 2024 was 1.6%, unchanged from the previous month and above market expectations of 1.5%. Meanwhile, the annual core inflation rate fell to 1.8%, the lowest in three years, down from a 1.9% rise in November but above market estimates of a 1.7% rise.

S&P 500 (US500) 6,086.37 +37.13 (+0.61%)

Dow Jones (US30) 44,156.73 +130.92 (+0.30%)

DAX (DE40) 21,254.27 +212.27 (+1.01%)

FTSE 100 (UK100) 8,545.13 +3.16 (+0.04%)

USD Index 108.25 (+0.17%)

News feed for: 2025.01.23

  • Japan Trade Balance (m/m) at 01:50 (GMT+2);
  • Singapore Inflation Rate at 07:00 (GMT+2);
  • Norway Norges Bank Interest Rate Decision at 11:00 (GMT+2);
  • Canada Retail Sales (m/m) at 15:30 (GMT+2);
  • US Natural Gas Storage (w/w) at 17:30 (GMT+2);
  • US Crude Oil Reserves (w/w) at 18:00 (GMT+2);
  • World Economic Forum Annual Meeting (Day 4).

By JustMarkets


This article reflects a personal opinion and should not be interpreted as an investment advice, and/or offer, and/or a persistent request for carrying out financial transactions, and/or a guarantee, and/or a forecast of future events.

Brent Oil Under Pressure Again: USD and China in Focus

By RoboForex Analytical Department

Brent crude oil prices fell below 73 USD per barrel on Friday, reflecting ongoing downward pressure. The market is poised to close the week with losses as a robust US dollar weighs heavily on commodity prices.

This week, the US Federal Reserve signalled a measured approach to reducing borrowing costs in 2025, sending the US dollar to a two-year high. The dollar’s strength has raised concerns about a dampened outlook for global fuel demand, particularly in emerging markets where dollar-denominated commodities become more expensive.

Concerns from China add to market anxiety

The ongoing unease about China’s economic recovery adds to the bearish sentiment. Sinopec, the country’s largest refiner, announced that domestic petrol demand likely peaked last year. This revelation has significantly clouded the outlook for 2025 as China’s role as a key driver of global energy consumption diminishes. China’s reduced demand has cast a long shadow over global crude markets, leading to further downward price pressures.

Mixed signals from supply dynamics

Despite the weak demand signals, the supply side has provided mixed indicators. Earlier in the week, data from the US Department of Energy showed reduced oil reserves, temporarily bolstering prices. However, this bullish factor was short-lived. Kazakhstan’s decision to support the extended production cuts under OPEC+ was another potentially supportive signal, but it has failed to provide sustained relief to oil prices amid broader concerns.

The structural expansion of production outside OPEC, particularly in the US and other non-OPEC nations, further complicates the outlook. Combined with China’s declining appetite for energy, these factors suggest that oil prices may end 2024 on a subdued note, with limited prospects for a significant recovery.

Technical analysis of Brent oil

H4 chart analysis: on the H4 timeframe, Brent continues to trade within a broad consolidation range around the 73.13 USD level. The market recently extended this range upwards to 73.40 USD. However, a downward move to 71.93 USD appears imminent. If the market manages to break out of this range to the upside, the next target lies at 75.05 USD, with the potential for further gains towards the 80.00 USD level.

From a technical standpoint, the MACD indicator supports this scenario, with the signal line positioned below the zero level near recent lows. This indicates that the market could soon attempt a reversal towards higher levels, potentially marking the beginning of a new growth wave.

H1 chart analysis: on the H1 chart, Brent is also consolidating around 73.13 USD. The current wave structure suggests a decline towards 71.93 USD, followed by an expected corrective wave to return to 73.13 USD. If this resistance is breached, the market may gain momentum, with an upward trajectory targeting 75.05 USD and potentially higher levels.


Disclaimer

Any forecasts contained herein are based on the author’s particular opinion. This analysis may not be treated as trading advice. RoboForex bears no responsibility for trading results based on trading recommendations and reviews contained herein.

Brent Oil Prices Dip Ahead of Crucial OPEC+ Meeting

By RoboForex Analytical Department 

Brent crude oil prices have declined to 71.65 USD per barrel as the commodity market remains tense ahead of this week’s postponed OPEC+ meeting, now rescheduled for Thursday, 6 December. The market is concerned about the direction of future global oil supply amid fears of oversaturation. The prevailing expectation is that OPEC+ might delay its planned increase in oil supply for the third time, reflecting persistent supply uncertainties.

Despite these pressures, there are optimistic signals from the oil sector, particularly China, where a resurgence in production activity is seen as a sign of gradual economic improvement in one of the world’s largest importers of raw materials. This development could bolster the energy sector.

The geopolitical landscape remains mixed, with traders closely monitoring tensions in the Middle East. Any escalation could heighten regional instability and affect the overall oil supply dynamics in these areas.

So far, the recent strengthening of the US dollar has not significantly impacted oil prices. However, future market dynamics could shift as global economic conditions evolve.

Technical analysis of Brent Oil

H4 chart: the market is navigating a broad consolidation range centred around the 73.33 level, with recent extensions downward to 71.55. An upward movement towards 73.33 is anticipated today. Should the price exit this range on the higher side, there may be potential for a growth wave targeting 75.15, potentially extending up to 80.00. The MACD indicator supports the bullish Brent outlook, with its signal line below zero but pointing upwards.

H1 chart: Brent has found support at 71.55, initiating a growth wave towards 73.33. Upon reaching this level, a compact consolidation range might form. A breakout above this range could lead to a rise towards 75.15. This potential growth trajectory is corroborated by the Stochastic oscillator, with its signal line currently above 50 and trending towards 80.


Disclaimer

Any forecasts contained herein are based on the author’s particular opinion. This analysis may not be treated as trading advice. RoboForex bears no responsibility for trading results based on trading recommendations and reviews contained herein.

Nuclear rockets could travel to Mars in half the time − but designing the reactors that would power them isn’t easy

By Dan Kotlyar, Georgia Institute of Technology 

NASA plans to send crewed missions to Mars over the next decade – but the 140 million-mile (225 million-kilometer) journey to the red planet could take several months to years round trip.

This relatively long transit time is a result of the use of traditional chemical rocket fuel. An alternative technology to the chemically propelled rockets the agency develops now is called nuclear thermal propulsion, which uses nuclear fission and could one day power a rocket that makes the trip in just half the time.

Nuclear fission involves harvesting the incredible amount of energy released when an atom is split by a neutron. This reaction is known as a fission reaction. Fission technology is well established in power generation and nuclear-powered submarines, and its application to drive or power a rocket could one day give NASA a faster, more powerful alternative to chemically driven rockets.

NASA and the Defense Advanced Research Projects Agency are jointly developing NTP technology. They plan to deploy and demonstrate the capabilities of a prototype system in space in 2027 – potentially making it one of the first of its kind to be built and operated by the U.S.

Nuclear thermal propulsion could also one day power maneuverable space platforms that would protect American satellites in and beyond Earth’s orbit. But the technology is still in development.

I am an associate professor of nuclear engineering at the Georgia Institute of Technology whose research group builds models and simulations to improve and optimize designs for nuclear thermal propulsion systems. My hope and passion is to assist in designing the nuclear thermal propulsion engine that will take a crewed mission to Mars.

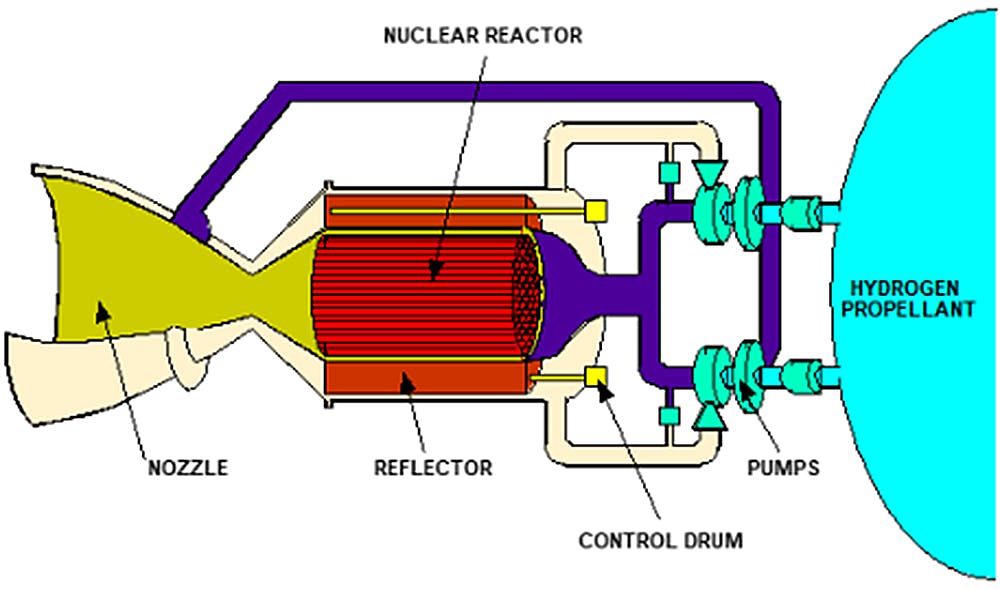
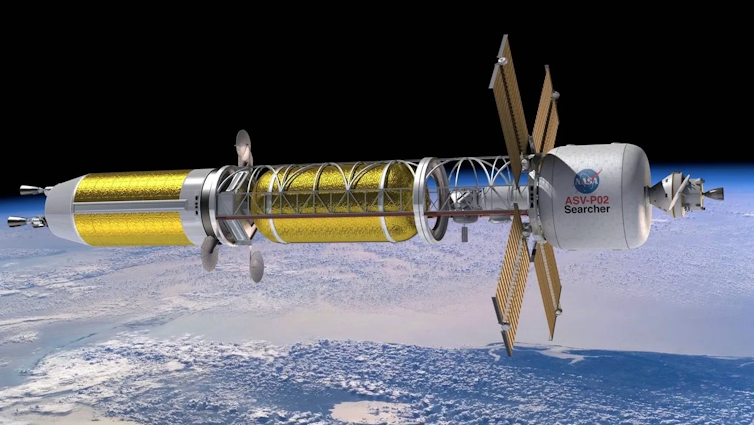
Nuclear-powered rockets could one day enable faster space travel.
NASA

Nuclear versus chemical propulsion

Conventional chemical propulsion systems use a chemical reaction involving a light propellant, such as hydrogen, and an oxidizer. When mixed together, these two ignite, which results in propellant exiting the nozzle very quickly to propel the rocket.

A diagram showing a nuclear thermal propulsion system, with a chamber for hydrogen connected to several pumps, a reactor chamber and a nozzle that the propellant is ejected from.
Scientists and engineers are working on nuclear thermal propulsion systems that would take hydrogen propellant, pump it into a nuclear reactor to generate energy and expel propellant out the nozzle to lift the rocket.
NASA Glenn Research Center

These systems do not require any sort of ignition system, so they’re reliable. But these rockets must carry oxygen with them into space, which can weigh them down. Unlike chemical propulsion systems, nuclear thermal propulsion systems rely on nuclear fission reactions to heat the propellant that is then expelled from the nozzle to create the driving force or thrust.

In many fission reactions, researchers send a neutron toward a lighter isotope of uranium, uranium-235. The uranium absorbs the neutron, creating uranium-236. The uranium-236 then splits into two fragments – the fission products – and the reaction emits some assorted particles.

Fission reactions create lots of heat energy.

More than 400 nuclear power reactors in operation around the world currently use nuclear fission technology. The majority of these nuclear power reactors in operation are light water reactors. These fission reactors use water to slow down the neutrons and to absorb and transfer heat. The water can create steam directly in the core or in a steam generator, which drives a turbine to produce electricity.

Nuclear thermal propulsion systems operate in a similar way, but they use a different nuclear fuel that has more uranium-235. They also operate at a much higher temperature, which makes them extremely powerful and compact. Nuclear thermal propulsion systems have about 10 times more power density than a traditional light water reactor.

Nuclear propulsion could have a leg up on chemical propulsion for a few reasons.

Nuclear propulsion would expel propellant from the engine’s nozzle very quickly, generating high thrust. This high thrust allows the rocket to accelerate faster.

These systems also have a high specific impulse. Specific impulse measures how efficiently the propellant is used to generate thrust. Nuclear thermal propulsion systems have roughly twice the specific impulse of chemical rockets, which means they could cut the travel time by a factor of 2.

Nuclear thermal propulsion history

For decades, the U.S. government has funded the development of nuclear thermal propulsion technology. Between 1955 and 1973, programs at NASA, General Electric and Argonne National Laboratories produced and ground-tested 20 nuclear thermal propulsion engines.

But these pre-1973 designs relied on highly enriched uranium fuel. This fuel is no longer used because of its proliferation dangers, or dangers that have to do with the spread of nuclear material and technology.

The Global Threat Reduction Initiative, launched by the Department of Energy and National Nuclear Security Administration, aims to convert many of the research reactors employing highly enriched uranium fuel to high-assay, low-enriched uranium, or HALEU, fuel.

High-assay, low- enriched uranium fuel has less material capable of undergoing a fission reaction, compared with highly enriched uranium fuel. So, the rockets needs to have more HALEU fuel loaded on, which makes the engine heavier. To solve this issue, researchers are looking into special materials that would use fuel more efficiently in these reactors.

NASA and the DARPA’s Demonstration Rocket for Agile Cislunar Operations, or DRACO, program intends to use this high-assay, low-enriched uranium fuel in its nuclear thermal propulsion engine. The program plans to launch its rocket in 2027.

As part of the DRACO program, the aerospace company Lockheed Martin has partnered with BWX Technologies to develop the reactor and fuel designs.

The nuclear thermal propulsion engines in development by these groups will need to comply with specific performance and safety standards. They’ll need to have a core that can operate for the duration of the mission and perform the necessary maneuvers for a fast trip to Mars.

Ideally, the engine should be able to produce high specific impulse, while also satisfying the high thrust and low engine mass requirements.

Ongoing research

Before engineers can design an engine that satisfies all these standards, they need to start with models and simulations. These models help researchers, such as those in my group, understand how the engine would handle starting up and shutting down. These are operations that require quick, massive temperature and pressure changes.

The nuclear thermal propulsion engine will differ from all existing fission power systems, so engineers will need to build software tools that work with this new engine.

My group designs and analyzes nuclear thermal propulsion reactors using models. We model these complex reactor systems to see how things such as temperature changes may affect the reactor and the rocket’s safety. But simulating these effects can take a lot of expensive computing power.

We’ve been working to develop new computational tools that model how these reactors act while they’re starting up and operated without using as much computing power.

My colleagues and I hope this research can one day help develop models that could autonomously control the rocket.The Conversation

About the Author:

Dan Kotlyar, Associate Professor of Nuclear and Radiological Engineering, Georgia Institute of Technology

This article is republished from The Conversation under a Creative Commons license. Read the original article.

Countries spend huge sums on fossil fuel subsidies – why they’re so hard to eliminate

By Bruce Huber, University of Notre Dame 

Fossil fuels are the leading driver of climate change, yet they are still heavily subsidized by governments around the world.

Although many countries have explicitly promised to reduce fossil fuel subsidies to combat climate change, this has proven difficult to accomplish. As a result, fossil fuels remain relatively inexpensive, and their use and greenhouse gas emissions continue to grow.

I work in environmental and energy law and have studied the fossil fuel sector for years. Here’s how fossil fuel subsidies work and why they’re so stubborn.

What is a subsidy?

A subsidy is a financial benefit given by a government to an entity or industry. Some subsidies are relatively obvious, such as publicly funded crop insurance or research grants to help pharmaceutical companies develop new drugs.

Others are less visible. A tariff on an imported product, for example, can subsidize domestic manufacturers of that product. More controversially, some would argue that when a government fails to make an industry pay for damage it causes, such as air or water pollution, that also amounts to a subsidy.

Subsidies, especially in this broader sense, are widespread throughout the global economy. Many industries receive benefits through public policies that are denied to other industries in the same jurisdiction, such as tax breaks, relaxed regulations or trade supports.

Governments employ subsidies for political and practical reasons. Politically, subsidies are useful for striking bargains or shoring up political support. In democracies, they can mollify constituencies otherwise unwilling to agree to a policy change. The 2022 Inflation Reduction Act, for example, squeaked through Congress by subsidizing both renewable energy and oil and gas production.

Practically, subsidies can boost a promising young industry such as electric vehicles, attract business to a community or help a mature sector survive an economic downturn, as the auto industry bailout did in 2008. Of course, policies can outlive their original purpose; some of today’s petroleum subsidies can be traced to the Great Depression.

How are fossil fuels subsidized?

Fossil fuel subsidies take many forms around the world. For example:

  • In Saudi Arabia, fuel prices are set by the government rather than the market; price ceilings subsidize the price citizens pay for gasoline. The cost to state-owned oil producers there is offset by oil exports, which dwarf domestic consumption.
  • Indonesia also caps energy prices, then compensates state-owned energy companies for the losses they bear.
  • In the United States, oil companies can take a tax deduction for a large portion of their drilling costs.

Other subsidies are less direct, such as when governments underprice permits to mine or drill for fossil fuels or fail to collect all the taxes owed by fossil fuel producers.

Estimates of the total value of global fossil fuel subsidies vary considerably depending on whether analysts use a broad or narrow definition. The Organization for Economic Cooperation and Development, or OECD, calculated the annual total to be about US$1.5 trillion in 2022. Tche International Monetary Fund reported a number over four times higher, about $7 trillion.

Why do estimates of fossil fuel subsidies vary so dramatically?

Analysts disagree about whether subsidy tabulations should include environmental damage from the extraction and use of fossil fuels that is not incorporated into the fuel’s price. The IMF treats the costs of global warming, local air pollution and even traffic congestion and road damage as implicit subsidies because fossil fuel companies don’t pay to remedy these problems. The OECD omits these implicit benefits.

But whichever definition is applied, the combined effect of national policies on fossil fuel prices paid by consumers is dramatic.

Oil, for example, is traded on a global market, but the price per gallon of petrol varies enormously around the world, from about 10 cents in Iran, Libya and Venezuela – where it is heavily subsidized – to over $7 in Hong Kong, the Netherlands and much of Scandinavia, where fuel taxes counteract subsidies.

What is the world doing about fossil fuel subsidies?

Global leaders have acknowledged that subsidies for fossil fuels undermine efforts to address climate change because they make fossil fuels cheaper than they would be otherwise.

In 2009, the heads of the G20, which includes many of the world’s largest economies, issued a statement resolving to “rationalize and phase out over the medium term inefficient fossil fuel subsidies that encourage wasteful consumption.” Later that same year, the governments of the Asia-Pacific Economic Cooperation forum, or APEC, made an identical pledge.

In 2010, 10 other countries, including the Netherlands and New Zealand, formed the Friends of Fossil Fuel Subsidy Reform group to “build political consensus on the importance of fossil fuel subsidy reform.”

Yet these commitments have scarcely moved the needle. A major study of 157 countries between 2003 and 2015 found that governments “collectively made little or no progress” toward reducing subsidies. In fact, the OECD found that total global subsidies nearly doubled in both 2021 and 2022.

So why are fossil fuel subsidies hard to eliminate?

There are various reasons fossil fuel subsidies are hard to eliminate. Many subsidies directly affect the costs that fossil fuel producers face, so reducing subsidies tends to increase prices for consumers. Because fossil fuels touch nearly every economic sector, rising fuel costs elevate prices for countless goods and services.

Subsidy reform tends to be broadly felt and pervasively inflationary. And unless carefully designed, subsidy reductions can be regressive, forcing low-income residents to spend a larger percentage of their income on energy.

So, even in countries where there is widespread support for robust climate policies, reducing subsidies can be deeply unpopular and may even cause public unrest.

The 2021-22 spike in fossil fuel subsidies is illustrative. After Russia’s invasion of Ukraine, energy prices surged throughout Europe. Governments were quick to provide aid for their citizens, resulting in their largest fossil fuel subsidies ever. Forced to choose between climate goals and affordable energy, Europe overwhelmingly chose the latter.

Of course, economists note that increasing the price of fossil fuels can lower demand, reducing emissions that are driving climate change and harming the environment and human health. Seen in that light, price spikes present an opportunity for reform. As the IMF noted, when prices recede after a surge, it “provide[s] an opportune time to lock in pricing of carbon and local air pollution emissions without necessarily raising energy prices above recently experienced levels.”The Conversation

About the Author:

Bruce Huber, Professor of Law, University of Notre Dame

This article is republished from The Conversation under a Creative Commons license. Read the original article.