
By Michael E. Webber, University of Texas at Austin and Hugh Daigle, University of Texas at Austin
With passage of the Inflation Reduction Act, which contains US$370 billion for climate and energy programs, policy experts are forecasting a big expansion in clean electricity generation. One source that’s poised for growth is offshore wind power.
Today the U.S. has just two operating offshore wind farms, off of Rhode Island and North Carolina, with a combined generating capacity of 42 megawatts. For comparison, the new Traverse Wind Energy Center in Oklahoma has 356 turbines and a 998-megawatt generating capacity. But many more projects are in development, mostly along the Atlantic coast.
The Biden administration has identified two zones for offshore wind power development in the Gulf of Mexico, which up until now has been firmly identified with oil and gas production. As part of his climate strategy, President Joe Biden has set a goal for the deployment of 30 gigawatts (30,000 megawatts) of offshore wind generating capacity by 2030 – enough to power 10 million homes with carbon-free electricity.
As energy researchers based in Texas, we see this as an exciting new phase in our nation’s ongoing clean power transition. In our view, offshore wind in the Gulf of Mexico presents a unique opportunity for a geographic region with a strong energy workforce and infrastructure to help meet society’s need for reliable low-carbon energy.
Why go offshore?
Wind power on land has seen remarkable growth in the U.S. over the last 15 years, including in Texas, the top wind-generating state in the nation. Wind power’s comparative ease of permitting and siting, affordable installation costs, abundant resources, free fuel and low marginal operating costs have reduced electricity costs for consumers. And wind power avoids significant amounts of air pollution, greenhouse gas emissions and water demand for cooling – impacts associated with power plants that burn coal, oil or natural gas.
But onshore wind has downsides. Winds often are weakest in the hottest hours of summer, when air conditioners are working hard to keep people cool. And many of the best wind energy zones are far from electricity demand centers. For example, most wind farms here in the Lone Star State are located on the high plains in west Texas, and were only built after the state spent billions of dollars on long-distance transmission lines to move their power to where it’s needed.
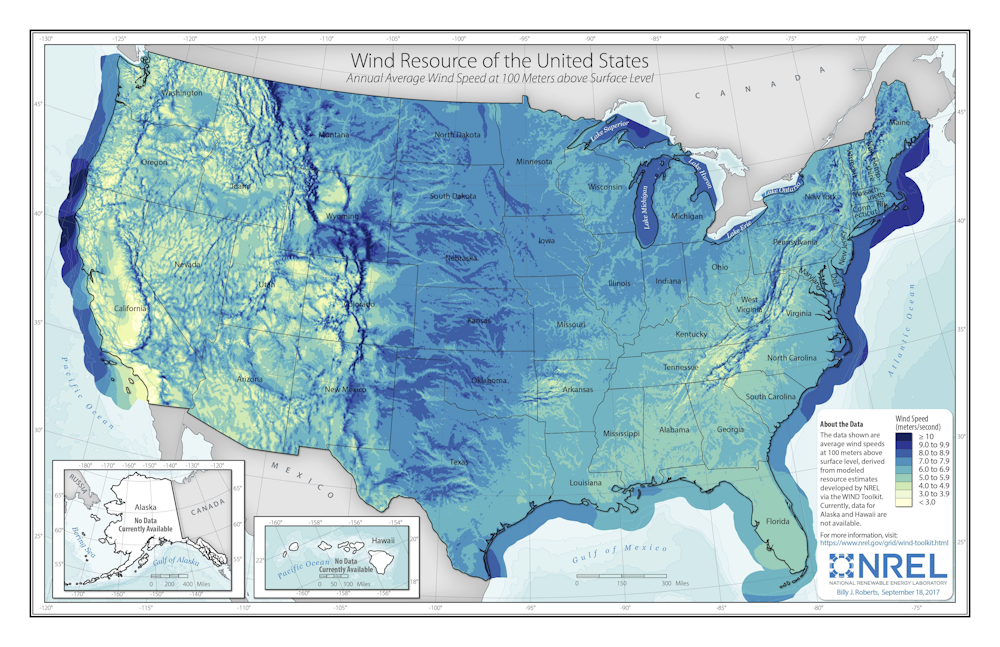
NREL
Solar power and batteries can solve some of these problems. But generating wind offshore also offers many benefits.
Just as onshore wind lowered electricity costs for consumers, offshore wind is expected to do the same.
More than half of the U.S. population lives within 50 miles of a coast, so offshore wind sites are close to electricity demand centers. This is especially true in the Gulf of Mexico, which is home to major cities such as Houston and New Orleans and a large concentration of petrochemical facilities and ports. Power companies can use subsea cables to bring wind energy to industrial facilities, instead of building hundreds of miles of overhead wires, with associated right-of-way and land access disputes.
Importantly, offshore wind complements onshore wind. As air speeds slow in west Texas on a hot summer afternoon, coastal winds pick up, helping to meet summer peak demand and improving grid reliability.
The offshore wind market is already robust globally, but until now has been practically non-existent in the U.S. Abundant land here has spurred growth of onshore wind, but inhibited a rush to the water.
That’s changing with tighter setback rules in leading wind states like Iowa that limit how close to homes turbines can be placed, which are driving up construction costs and limiting the availability of acceptable sites. Transmission capacity limits on the U.S. power grid are also making it harder to move wind-generated electrons to market.
Welcome to the Gulf, y’all
Thanks to these development trends, plus measures in the climate bill that increase support for offshore wind, it looks as though a U.S. offshore wind industry is finally ready for prime time. We see the Gulf of Mexico as an especially attractive place to do business.
Compared to cold and bitter conditions in regions like the North Sea, the North Atlantic and coastal Japan, where offshore wind generation is already happening, the Gulf’s shallower water depths, warmer temperatures and calmer waves are relatively easy to manage. Water depths up to 160 feet – currently the maximum depth for fixed-bottom wind turbines – extend nearly 90 miles off the coasts of southeast Texas and southern Louisiana, compared with only about 40 miles off Nantucket and Martha’s Vineyard in the Northeast.
The Gulf’s seafloor topography features a more even and gentle slope than areas already under consideration for development off the coast of Virginia. This means that fixed-bottom wind turbines can be used in more places, rather than floating systems, which reduces complexity.
Importantly, the Gulf Coast has a robust offshore industry that was established to serve oil and gas producers, with many specialized companies offering services such as underwater welding, platform manufacturing and helicopter and boat services to get people and equipment to sea. Gulf of Mexico oil and gas production supported an estimated 345,000 jobs in 2019.
Wind farms in the Gulf can leverage existing infrastructure. There are nearly 1,200 miles of existing subsea power cables that could transfer wind energy to shore. Wind generation could also be incorporated into a larger energy system that includes green hydrogen generation and storage and carbon sequestration.
A boost for workers and vulnerable communities
We also believe that offshore wind energy can help advance environmental justice goals. Generating more clean, carbon-free electricity will help to displace refineries and plants that process fossil fuels and generate power from them. These facilities disproportionately harm the health of communities of color in cities like Houston and across the U.S..
Wind power development in the Gulf also offers an opportunity for a smooth labor transition as the U.S. gradually reduces its reliance on fossil fuels. Louisiana is already moving to set rules for offshore wind in state waters, and is seeking federal funding together with Arkansas and Oklahoma for a regional clean hydrogen hub.
Green means go
Permitting for energy projects is notoriously slow at the federal level, and wind energy projects in federal waters may require multi-year lead times. But projects in state waters – extending up to three nautical miles from shore in most areas, and nine miles from shore in Texas – could proceed more rapidly.
Much depends on whether energy states like Texas and Louisiana see opportunities to extend their reputations as energy leaders into offshore wind. As we see it, an offshore wind boom in the Gulf would be good for the region, the nation and the world’s climate.![]()
About the Author:
Michael E. Webber, Josey Centennial Professor of Energy Resources, University of Texas at Austin and Hugh Daigle, Associate Professor of Petroleum and Geosystems Engineering, University of Texas at Austin
This article is republished from The Conversation under a Creative Commons license. Read the original article.


