
By InvestMacro | COT | Data Tables | COT Leaders | Downloads | COT Newsletter
Here are the latest charts and statistics for the Commitment of Traders (COT) data published by the Commodities Futures Trading Commission (CFTC).
The latest COT data is updated through Tuesday August 30th (COT Week 35) and shows a quick view of how large traders (for-profit speculators and commercial entities) were positioned in the futures markets.
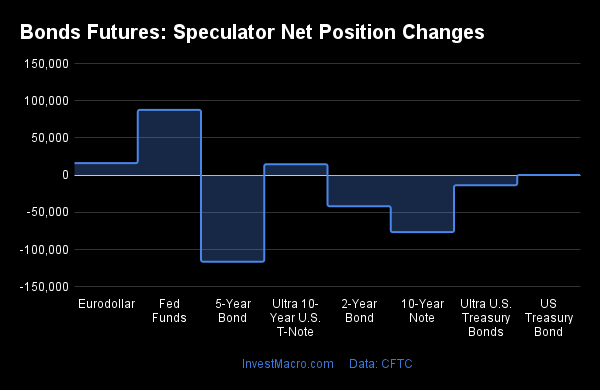
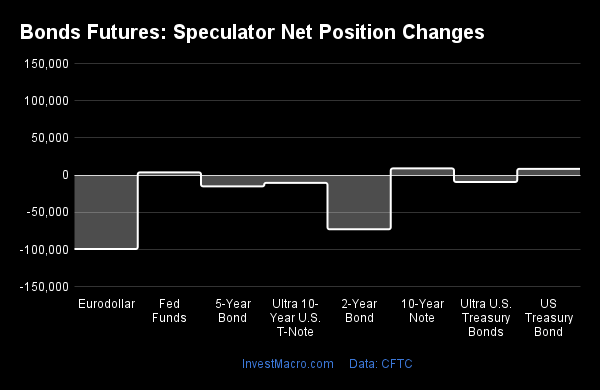
5-Year, 10-Year & 2-Year Bonds lead Weekly Speculator Changes Lower
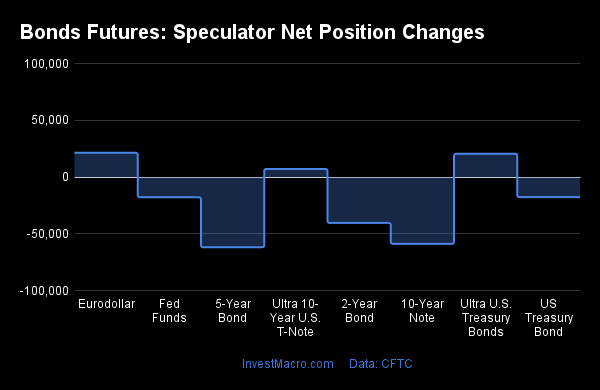
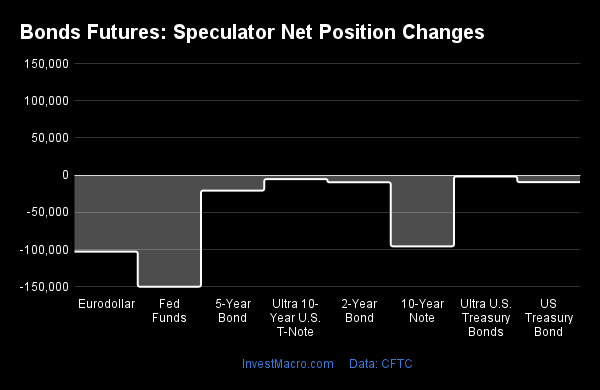
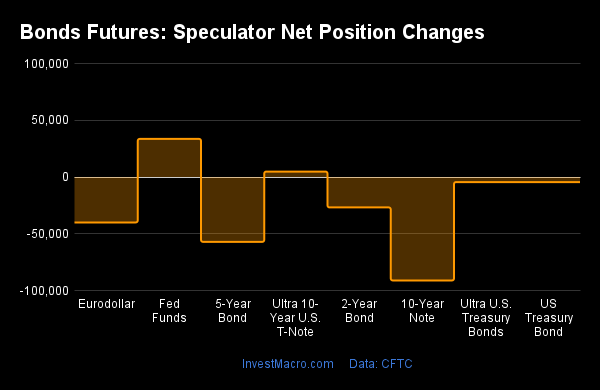
The COT bond market speculator bets were lower this week as just three out of the eight bond markets we cover had higher positioning while the other five markets had lower contracts.
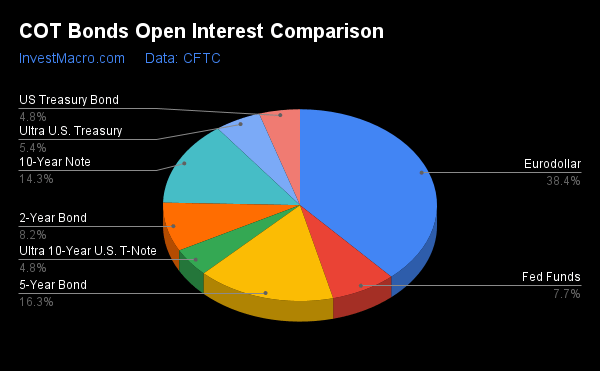
Leading the gains for the bond markets were the Eurodollar (21,409 contracts) and the Ultra US Bond (20,439 contracts) with the Ultra 10-Year (7,103 contracts) also having a positive week.
The bond markets leading the declines in speculator bets this week were the 5-Year Bond (-61,931 contracts) and the 10-Year Bond (-58,934 contracts) with the 2-Year Bond (-40,457 contracts), the Fed Funds (-17,884 contracts) and the Long US Bond (-17,703 contracts) also registering lower bets on the week.
| Aug-30-2022 | OI | OI-Index | Spec-Net | Spec-Index | Com-Net | COM-Index | Smalls-Net | Smalls-Index |
|---|---|---|---|---|---|---|---|---|
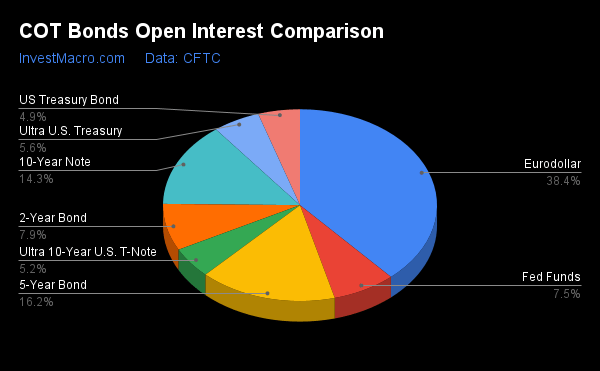
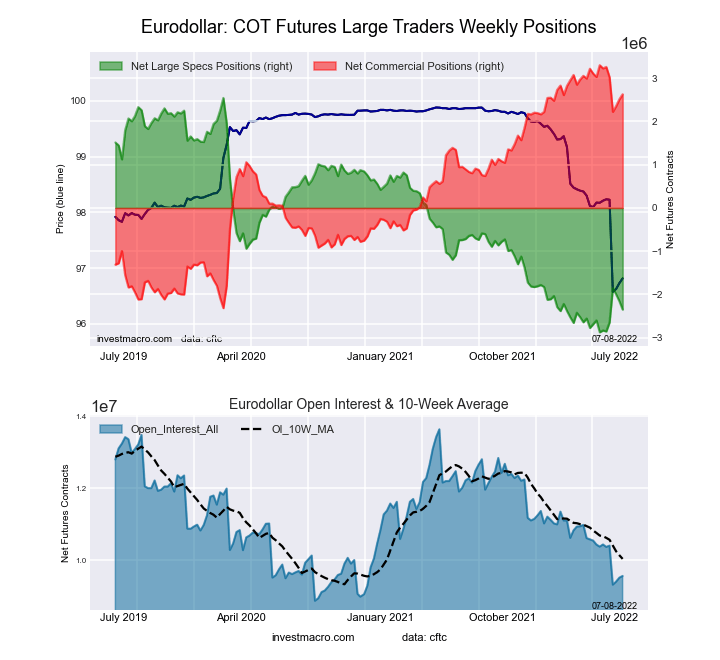
| Eurodollar | 9,583,494 | 15 | -2,857,402 | 1 | 3,053,630 | 96 | -196,228 | 61 |
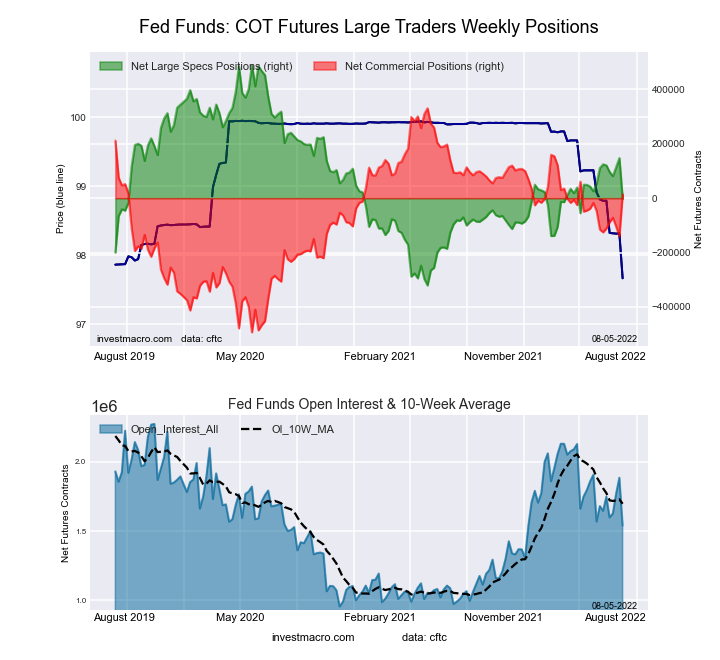
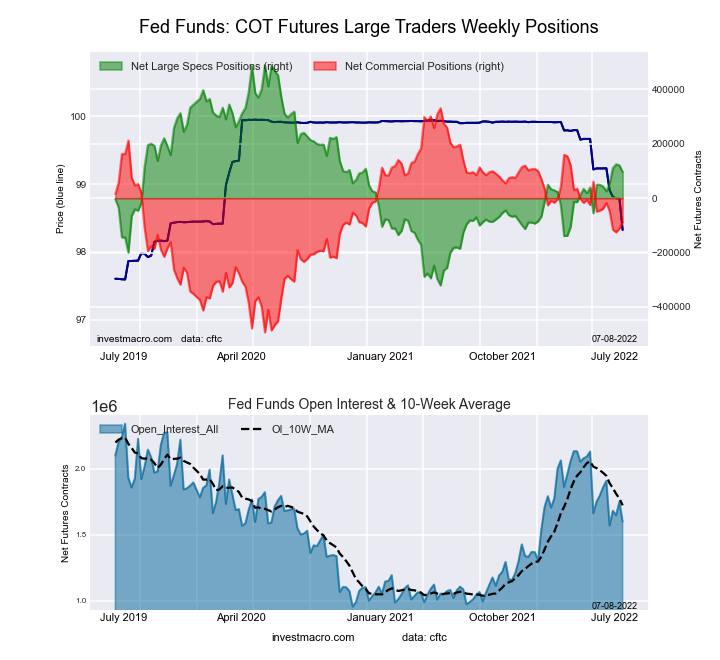
| FedFunds | 1,861,895 | 69 | 84,766 | 50 | -78,246 | 50 | -6,520 | 43 |
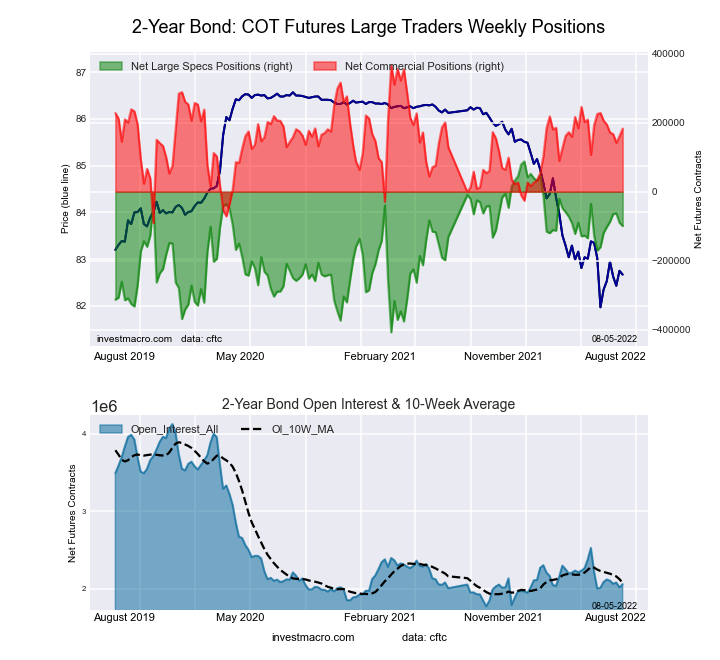
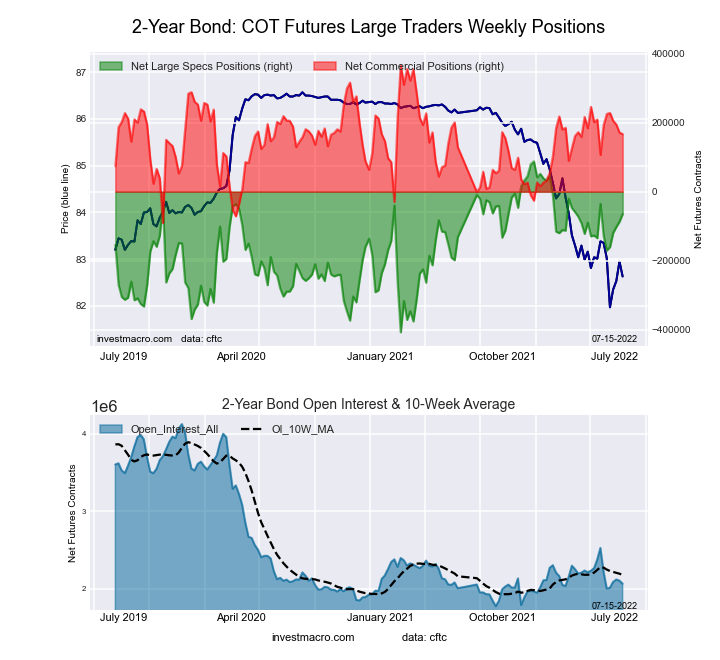
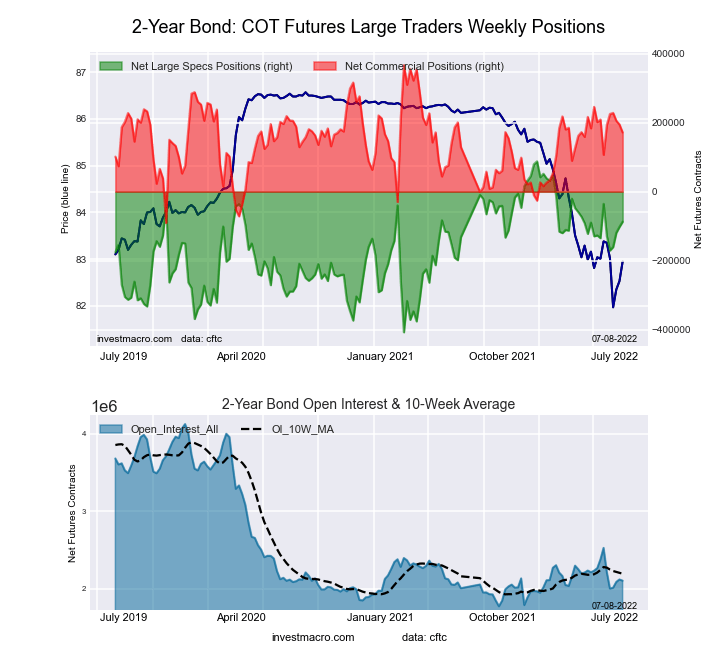
| 2-Year | 1,966,512 | 8 | -281,600 | 25 | 348,412 | 96 | -66,812 | 21 |
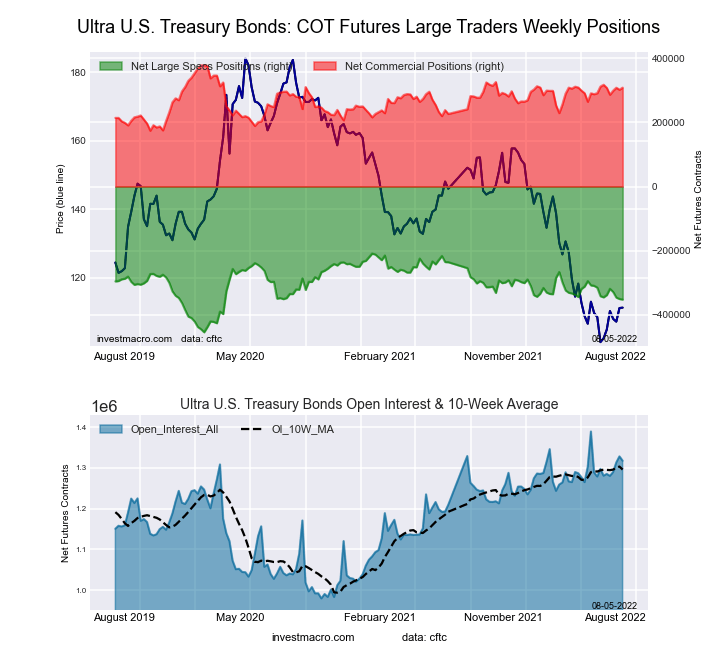
| Long T-Bond | 1,233,302 | 50 | -68,834 | 62 | 40,789 | 25 | 28,045 | 75 |
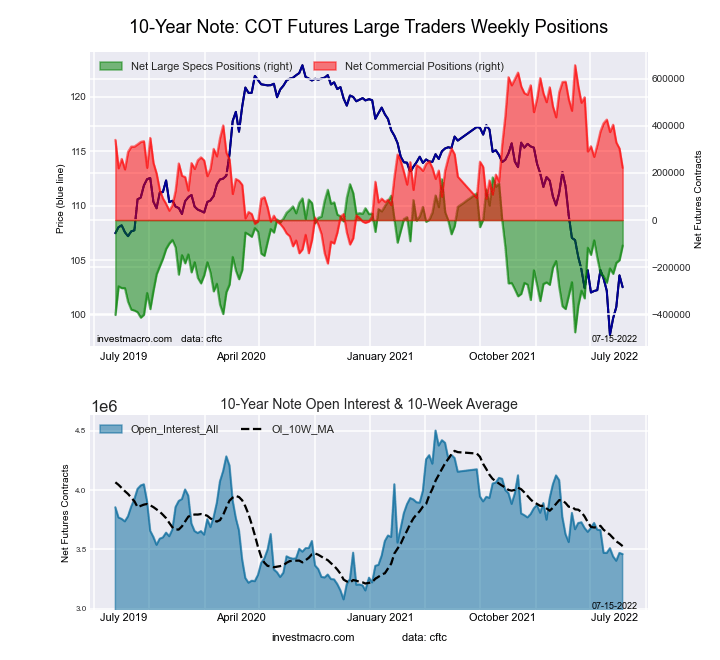
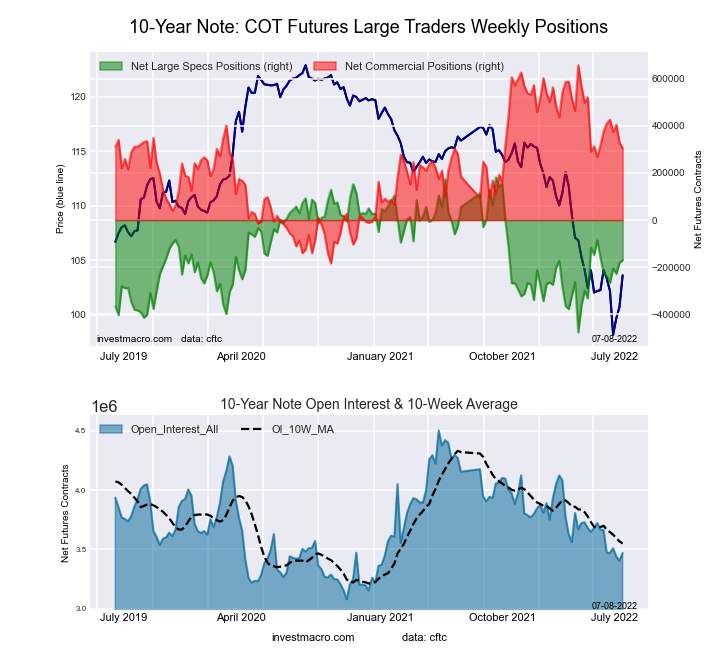
| 10-Year | 3,559,445 | 34 | -440,103 | 6 | 558,958 | 88 | -118,855 | 52 |
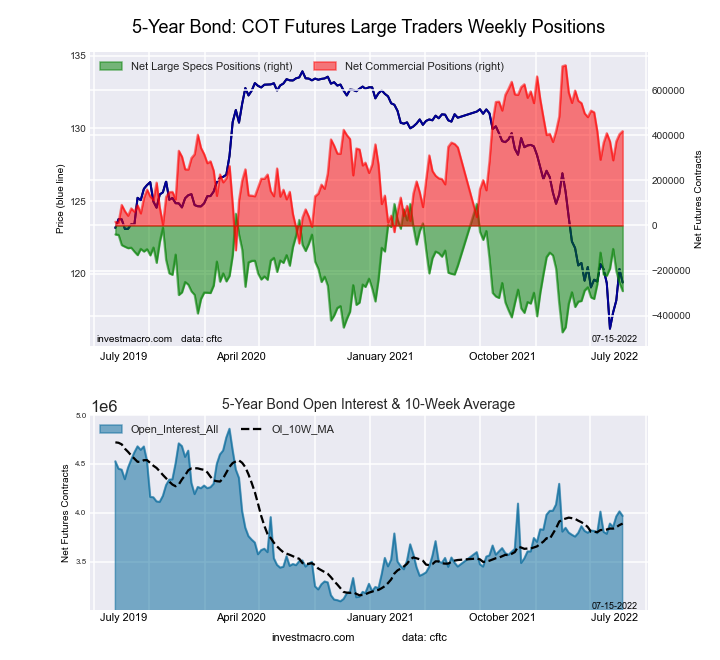
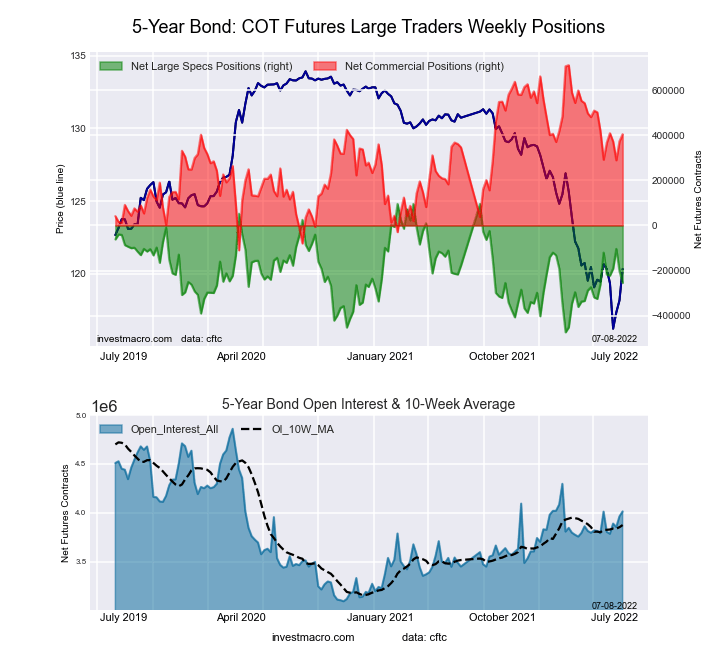
| 5-Year | 4,037,085 | 53 | -565,456 | 0 | 694,381 | 98 | -128,925 | 46 |
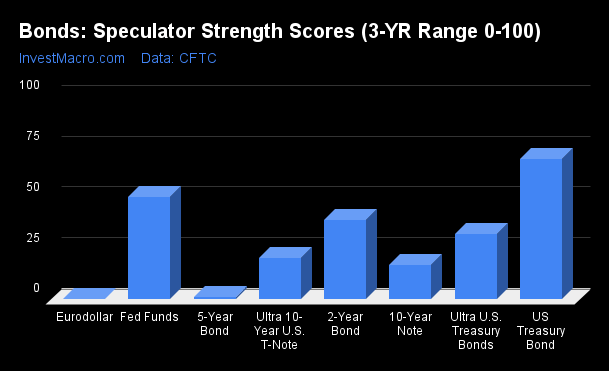
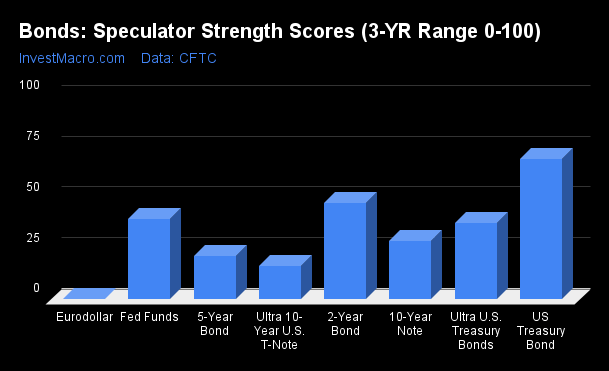
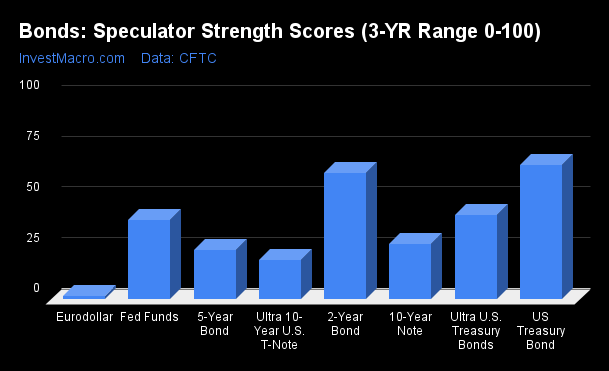
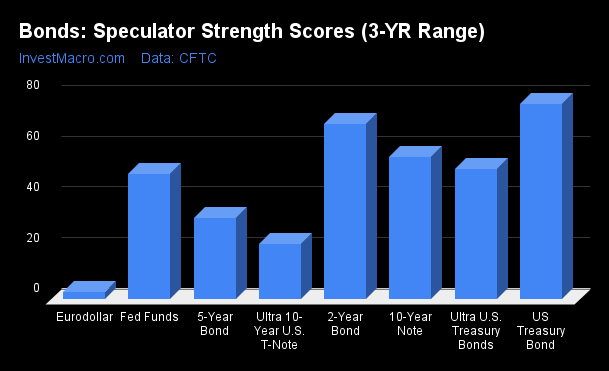
US Treasury Bond & Fed Funds Futures lead the Strength Scores
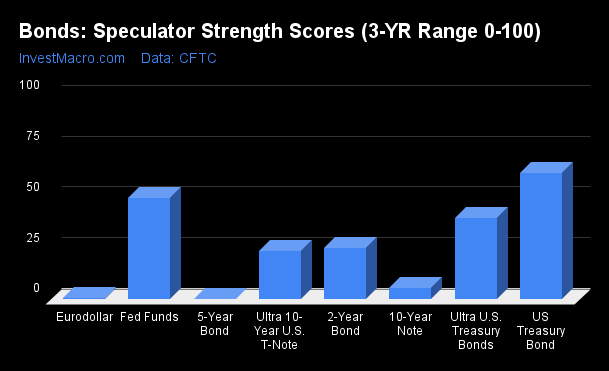
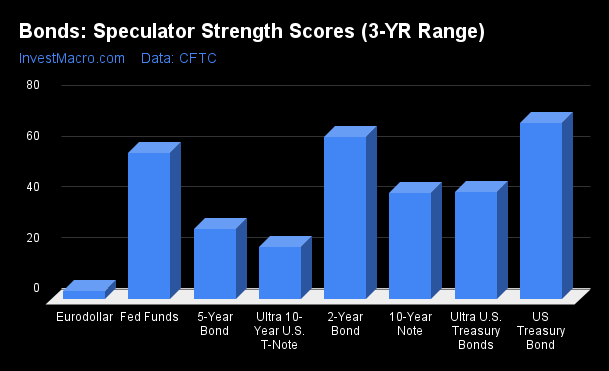
Strength Scores (a normalized measure of Speculator positions over a 3-Year range, from 0 to 100 where above 80 is extreme bullish and below 20 is extreme bearish) showed that the US Treasury Bond (62.2 percent) continues to lead the bonds markets although it is cooling off from past months and from last week’s score of 67.9 percent. The Fed Funds (50.1 percent) comes in as the next highest bonds market in strength scores and the only other one above the 3-Year midpoint of 50 percent.
On the downside, the 5-Year Bond (0.0 percent), the Eurodollar (0.5 percent) and the 10-Year Bond (5.5 percent) come in as the lowest strength scores currently. All three of these markets are in bearish extreme positions (below 20 percent) and are near the bottoms of their 3-Year ranges.
Strength Statistics:
Fed Funds (50.1 percent) vs Fed Funds previous week (52.3 percent)
2-Year Bond (25.4 percent) vs 2-Year Bond previous week (33.6 percent)
5-Year Bond (0.0 percent) vs 5-Year Bond previous week (9.4 percent)
10-Year Bond (5.5 percent) vs 10-Year Bond previous week (14.5 percent)
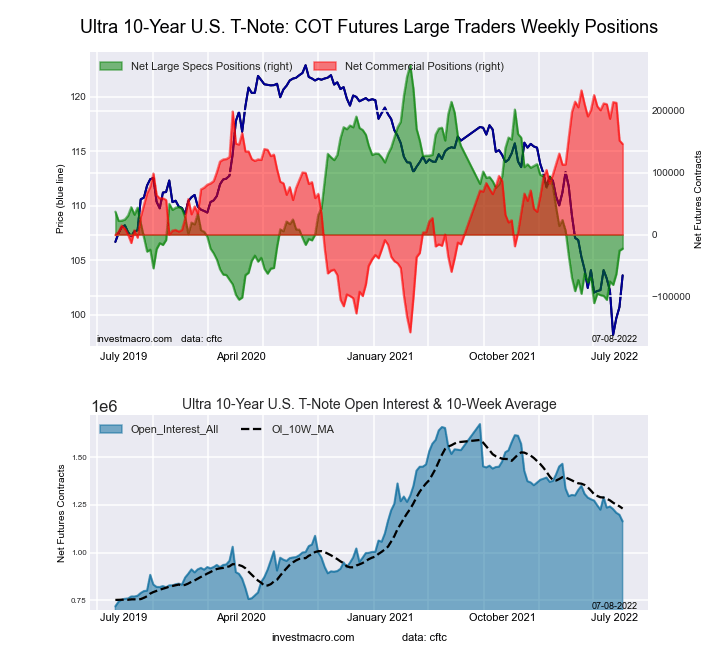
Ultra 10-Year Bond (24.1 percent) vs Ultra 10-Year Bond previous week (22.3 percent)
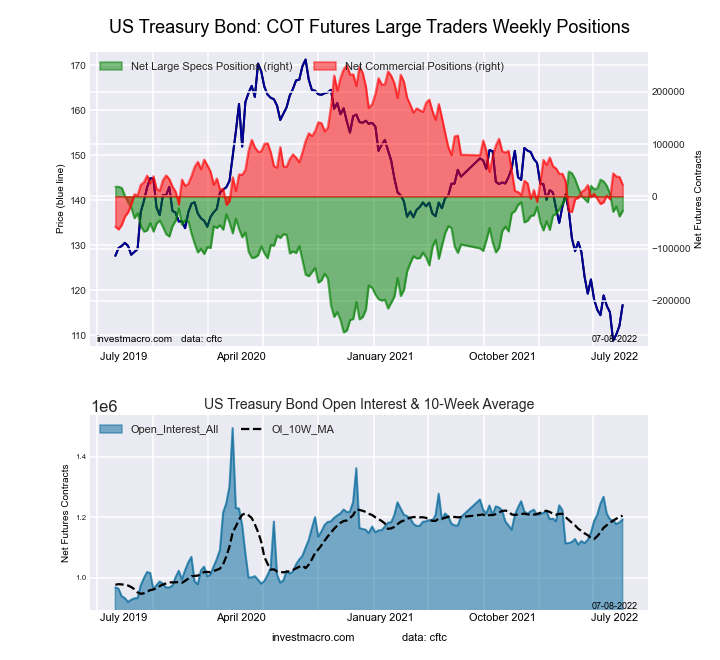
US Treasury Bond (62.2 percent) vs US Treasury Bond previous week (67.9 percent)
Ultra US Treasury Bond (40.1 percent) vs Ultra US Treasury Bond previous week (31.7 percent)
Eurodollar (0.5 percent) vs Eurodollar previous week (0.1 percent)
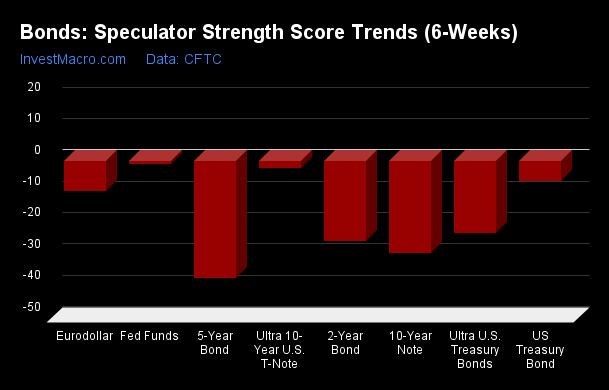
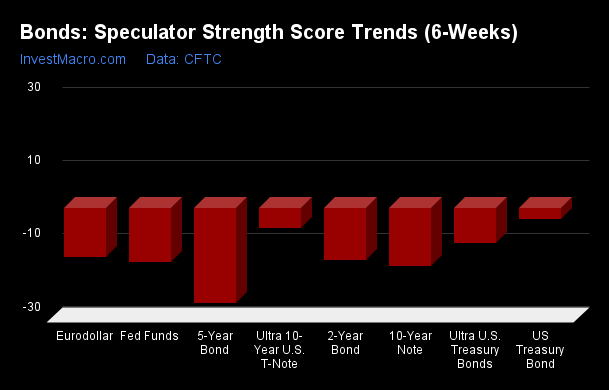
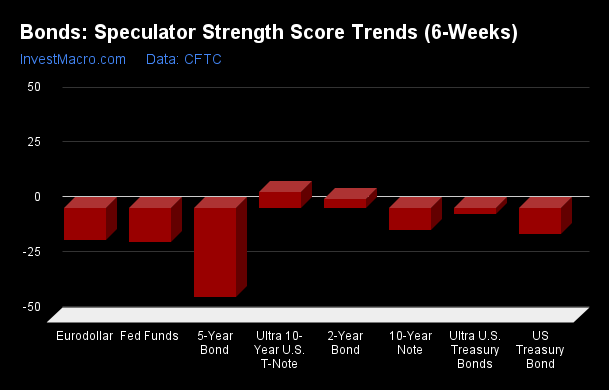
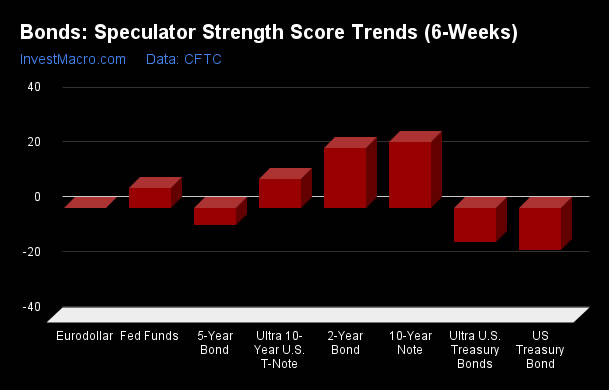
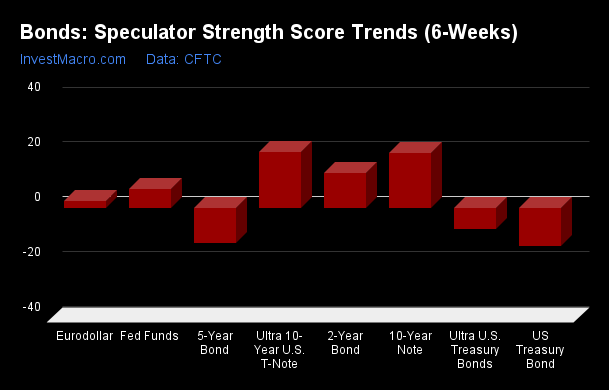
10-Year, 5-Year & 2-Year lead Strength Trends sharply lower
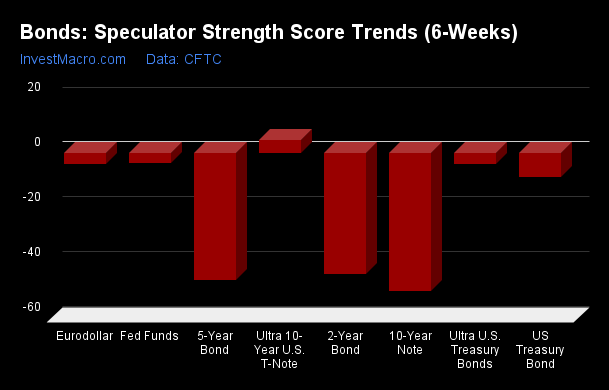
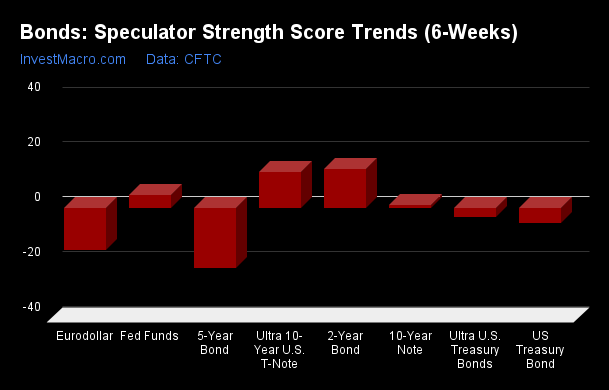
Strength Score Trends (or move index, calculates the 6-week changes in strength scores) showed that the Ultra 10-Year Bond (4.6 percent) leads the past six weeks trends for bonds and is the only positive score in the latest data.
The 10-Year Bond (-50.4 percent), the 5-Year Bond (-46.5 percent) and the 2-Year Bond (-44.1 percent) lead the downside trend scores. These three market trends are all sharply lower as the speculator sentiment has become much weaker.
Strength Trend Statistics:
Fed Funds (-3.6 percent) vs Fed Funds previous week (2.7 percent)
2-Year Bond (-44.1 percent) vs 2-Year Bond previous week (-35.7 percent)
5-Year Bond (-46.5 percent) vs 5-Year Bond previous week (-32.1 percent)
10-Year Bond (-50.4 percent) vs 10-Year Bond previous week (-41.5 percent)
Ultra 10-Year Bond (4.6 percent) vs Ultra 10-Year Bond previous week (0.6 percent)
US Treasury Bond (-8.7 percent) vs US Treasury Bond previous week (-9.1 percent)
Ultra US Treasury Bond (-4.1 percent) vs Ultra US Treasury Bond previous week (-19.6 percent)
Eurodollar (-3.9 percent) vs Eurodollar previous week (-2.8 percent)
Individual Markets:
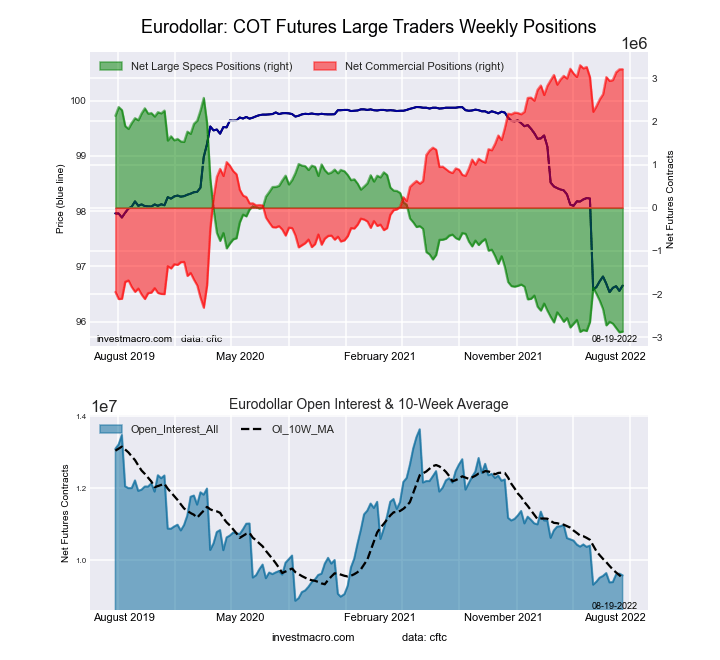
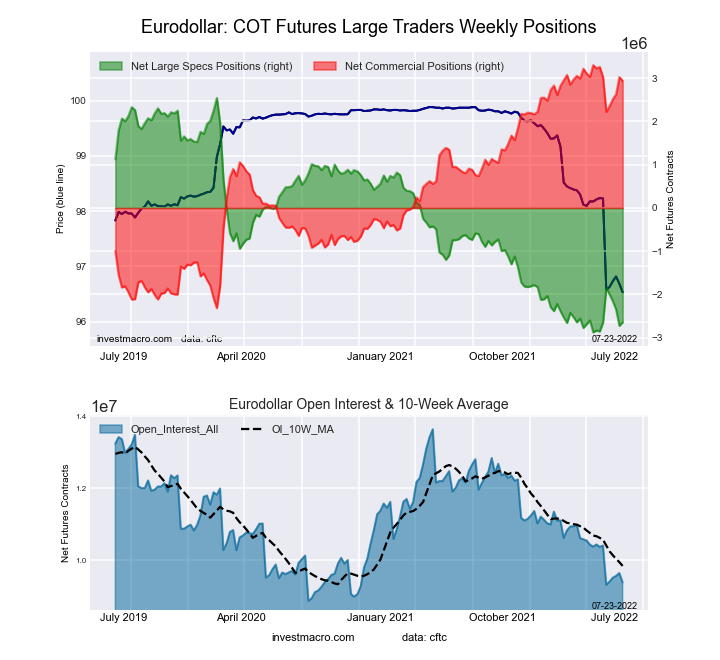
3-Month Eurodollars Futures:
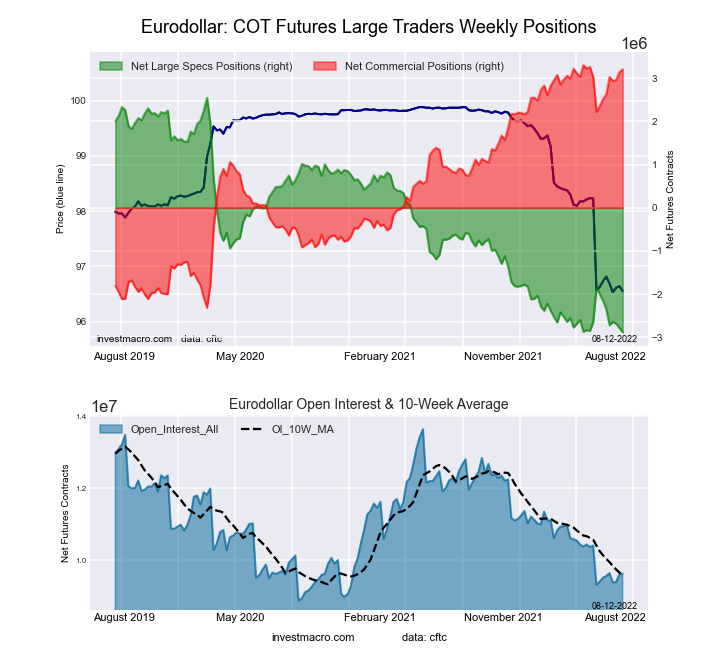
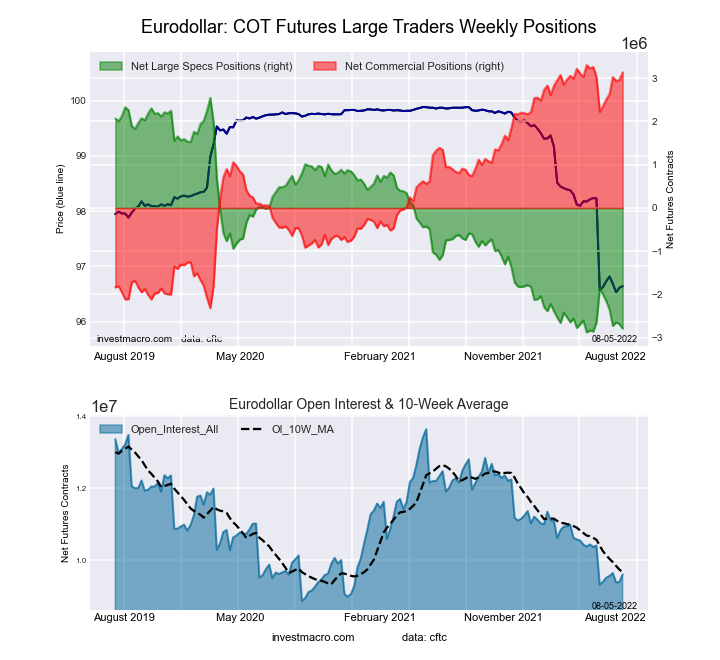
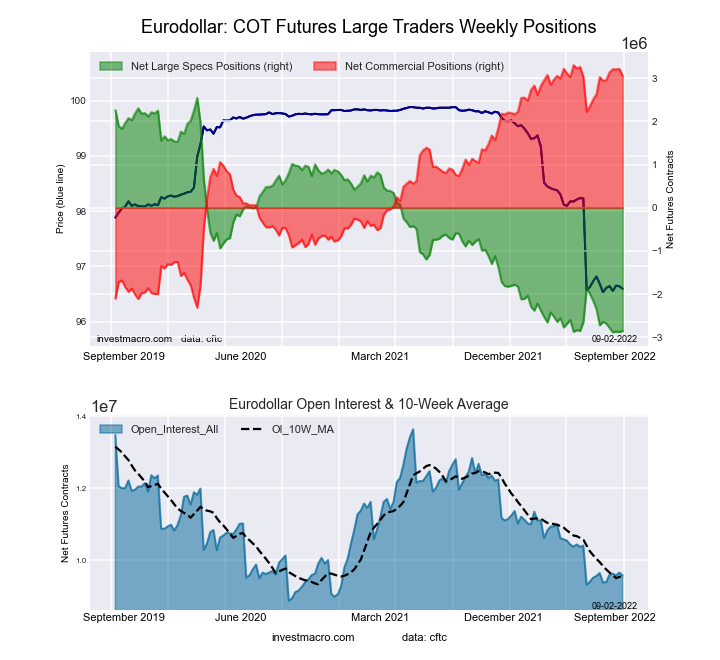 The 3-Month Eurodollars large speculator standing this week equaled a net position of -2,857,402 contracts in the data reported through Tuesday. This was a weekly advance of 21,409 contracts from the previous week which had a total of -2,878,811 net contracts.
This week’s current strength score (the trader positioning range over the past three years, measured from 0 to 100) shows the speculators are currently Bearish-Extreme with a score of 0.5 percent. The commercials are Bullish-Extreme with a score of 95.6 percent and the small traders (not shown in chart) are Bullish with a score of 61.3 percent.
| 3-Month Eurodollars Statistics | SPECULATORS | COMMERCIALS | SMALL TRADERS |
| – Percent of Open Interest Longs: | 5.8 | 69.0 | 5.6 |
| – Percent of Open Interest Shorts: | 35.6 | 37.1 | 7.7 |
| – Net Position: | -2,857,402 | 3,053,630 | -196,228 |
| – Gross Longs: | 556,379 | 6,613,120 | 541,288 |
| – Gross Shorts: | 3,413,781 | 3,559,490 | 737,516 |
| – Long to Short Ratio: | 0.2 to 1 | 1.9 to 1 | 0.7 to 1 |
| NET POSITION TREND: | |||
| – Strength Index Score (3 Year Range Pct): | 0.5 | 95.6 | 61.3 |
| – Strength Index Reading (3 Year Range): | Bearish-Extreme | Bullish-Extreme | Bullish |
| NET POSITION MOVEMENT INDEX: | |||
| – 6-Week Change in Strength Index: | -3.9 | 2.1 | 21.5 |
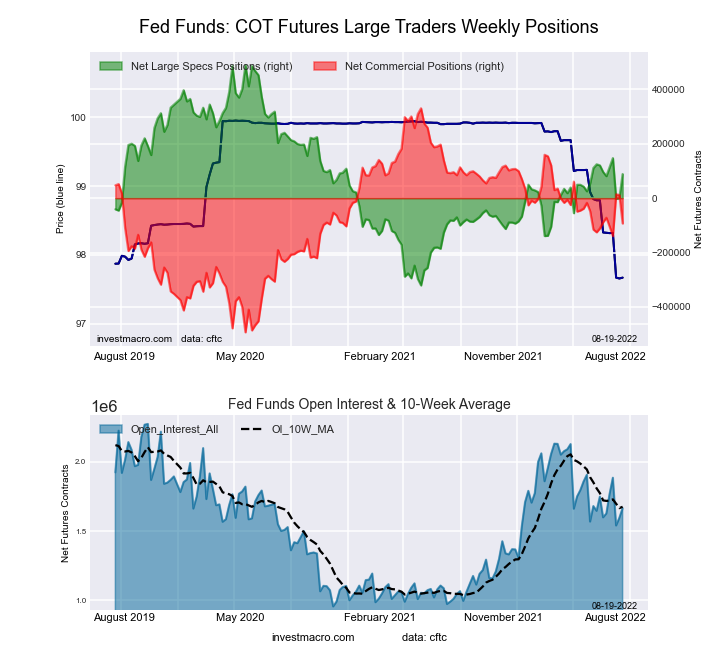
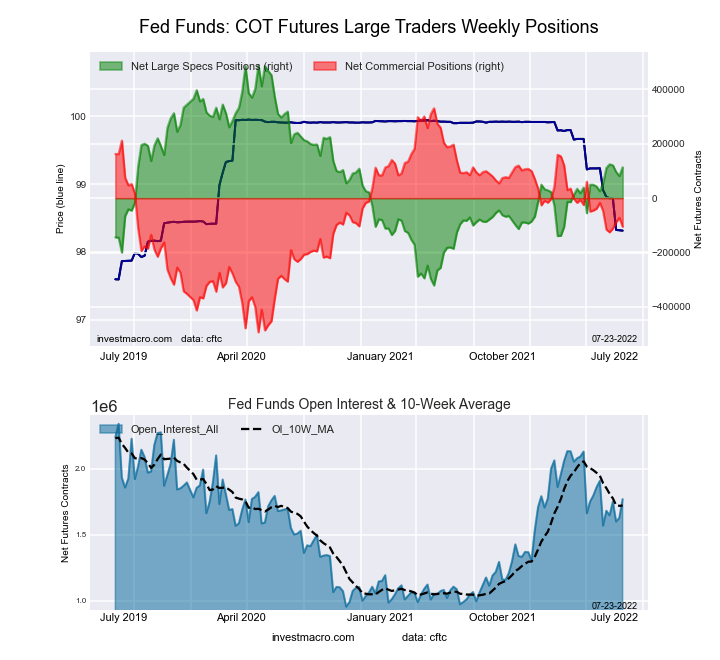
30-Day Federal Funds Futures:
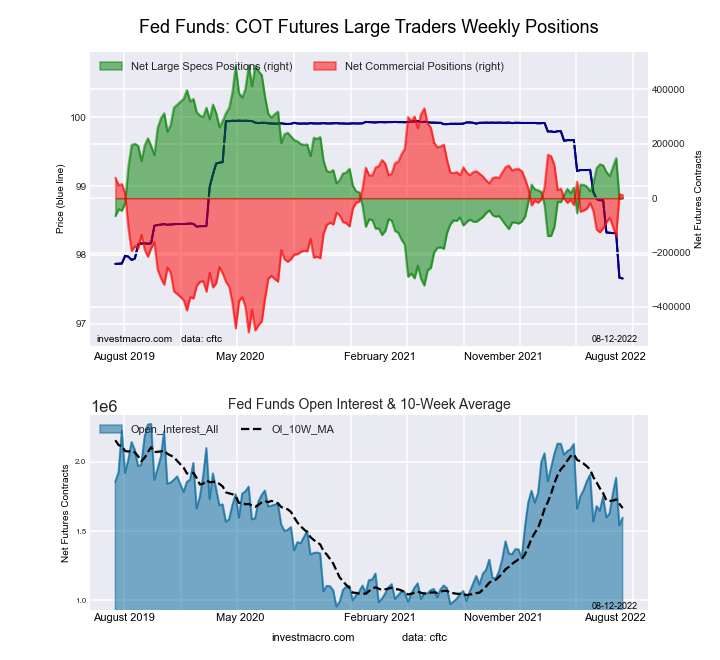
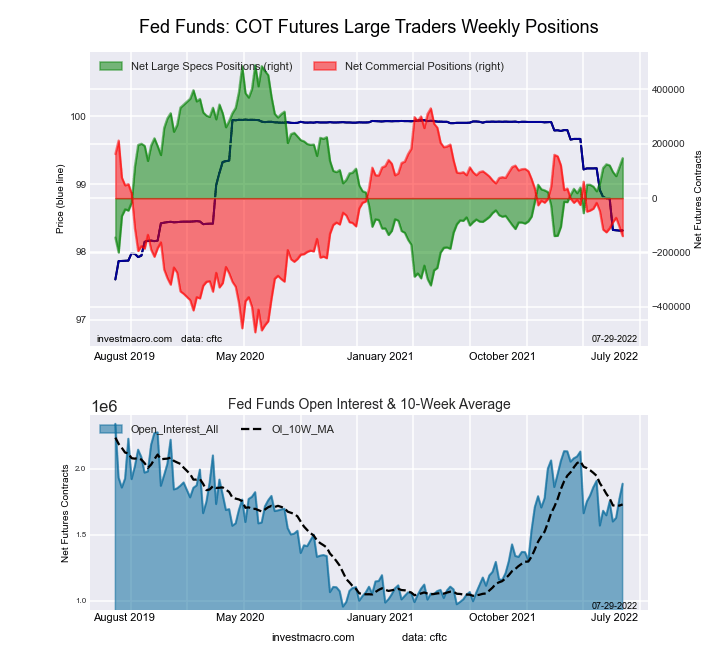
 The 30-Day Federal Funds large speculator standing this week equaled a net position of 84,766 contracts in the data reported through Tuesday. This was a weekly decline of -17,884 contracts from the previous week which had a total of 102,650 net contracts.
This week’s current strength score (the trader positioning range over the past three years, measured from 0 to 100) shows the speculators are currently Bullish with a score of 50.1 percent. The commercials are Bullish with a score of 50.4 percent and the small traders (not shown in chart) are Bearish with a score of 43.1 percent.
| 30-Day Federal Funds Statistics | SPECULATORS | COMMERCIALS | SMALL TRADERS |
| – Percent of Open Interest Longs: | 15.8 | 71.3 | 2.0 |
| – Percent of Open Interest Shorts: | 11.2 | 75.5 | 2.3 |
| – Net Position: | 84,766 | -78,246 | -6,520 |
| – Gross Longs: | 293,531 | 1,328,269 | 36,739 |
| – Gross Shorts: | 208,765 | 1,406,515 | 43,259 |
| – Long to Short Ratio: | 1.4 to 1 | 0.9 to 1 | 0.8 to 1 |
| NET POSITION TREND: | |||
| – Strength Index Score (3 Year Range Pct): | 50.1 | 50.4 | 43.1 |
| – Strength Index Reading (3 Year Range): | Bullish | Bullish | Bearish |
| NET POSITION MOVEMENT INDEX: | |||
| – 6-Week Change in Strength Index: | -3.6 | 3.3 | 5.1 |
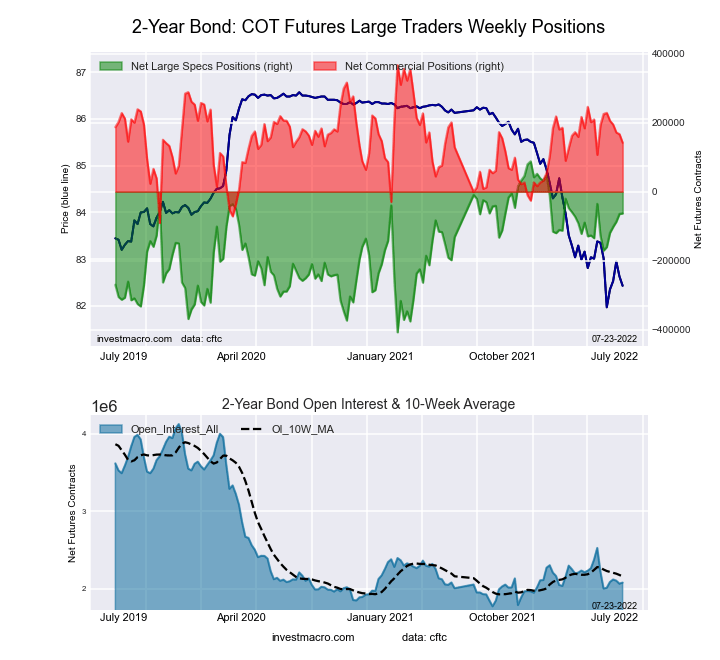
2-Year Treasury Note Futures:
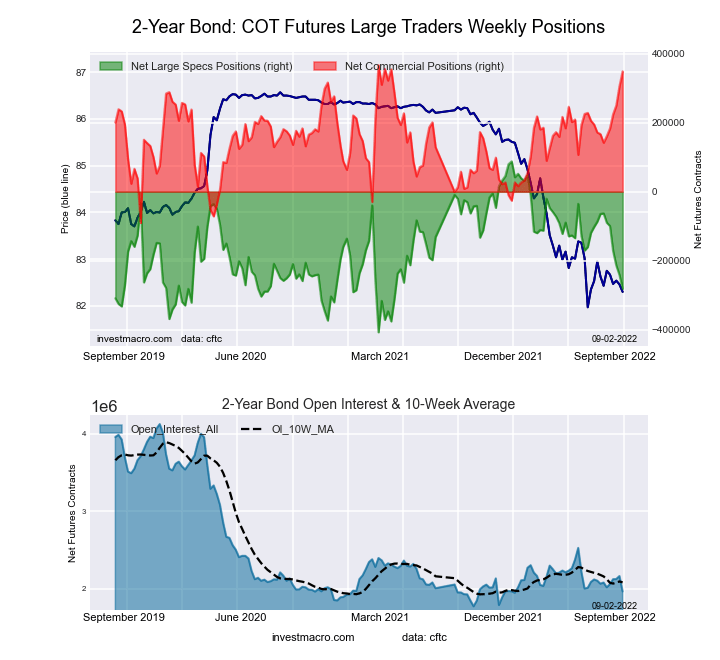 The 2-Year Treasury Note large speculator standing this week equaled a net position of -281,600 contracts in the data reported through Tuesday. This was a weekly decrease of -40,457 contracts from the previous week which had a total of -241,143 net contracts.
This week’s current strength score (the trader positioning range over the past three years, measured from 0 to 100) shows the speculators are currently Bearish with a score of 25.4 percent. The commercials are Bullish-Extreme with a score of 96.0 percent and the small traders (not shown in chart) are Bearish with a score of 20.7 percent.
| 2-Year Treasury Note Statistics | SPECULATORS | COMMERCIALS | SMALL TRADERS |
| – Percent of Open Interest Longs: | 5.5 | 83.0 | 7.4 |
| – Percent of Open Interest Shorts: | 19.8 | 65.2 | 10.8 |
| – Net Position: | -281,600 | 348,412 | -66,812 |
| – Gross Longs: | 108,397 | 1,631,374 | 146,211 |
| – Gross Shorts: | 389,997 | 1,282,962 | 213,023 |
| – Long to Short Ratio: | 0.3 to 1 | 1.3 to 1 | 0.7 to 1 |
| NET POSITION TREND: | |||
| – Strength Index Score (3 Year Range Pct): | 25.4 | 96.0 | 20.7 |
| – Strength Index Reading (3 Year Range): | Bearish | Bullish-Extreme | Bearish |
| NET POSITION MOVEMENT INDEX: | |||
| – 6-Week Change in Strength Index: | -44.1 | 45.2 | 5.0 |
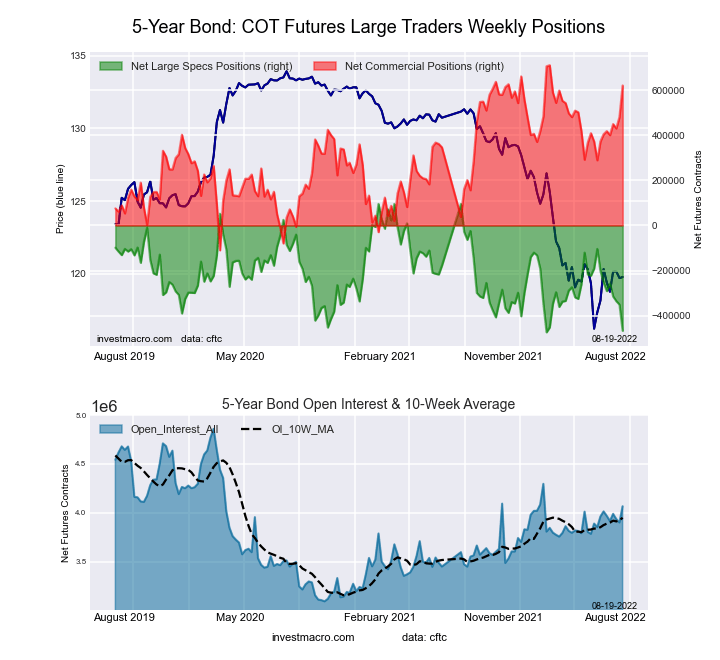
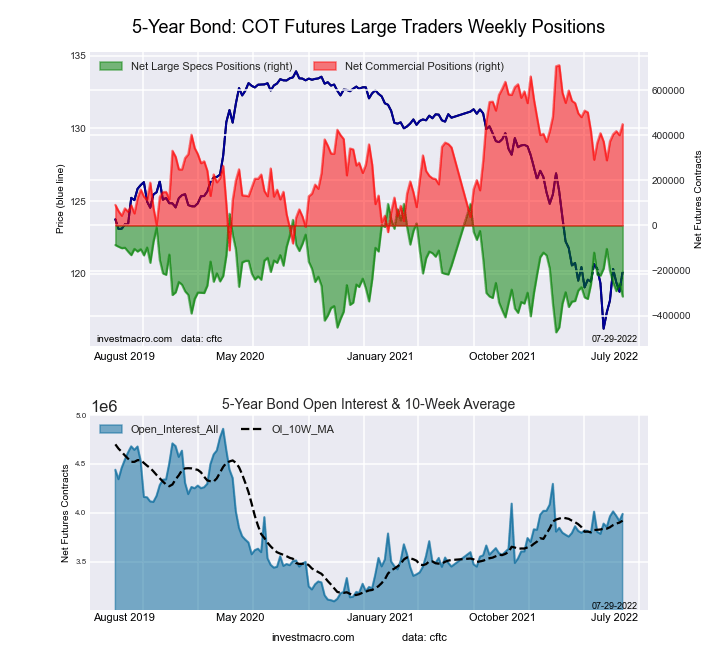
5-Year Treasury Note Futures:
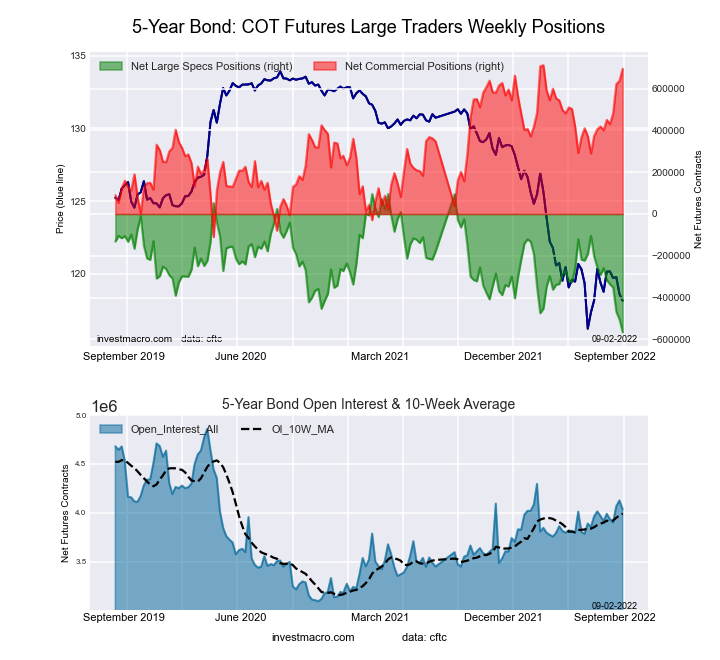 The 5-Year Treasury Note large speculator standing this week equaled a net position of -565,456 contracts in the data reported through Tuesday. This was a weekly fall of -61,931 contracts from the previous week which had a total of -503,525 net contracts.
This week’s current strength score (the trader positioning range over the past three years, measured from 0 to 100) shows the speculators are currently Bearish-Extreme with a score of 0.0 percent. The commercials are Bullish-Extreme with a score of 97.9 percent and the small traders (not shown in chart) are Bearish with a score of 45.6 percent.
| 5-Year Treasury Note Statistics | SPECULATORS | COMMERCIALS | SMALL TRADERS |
| – Percent of Open Interest Longs: | 5.6 | 84.1 | 7.7 |
| – Percent of Open Interest Shorts: | 19.6 | 66.9 | 10.9 |
| – Net Position: | -565,456 | 694,381 | -128,925 |
| – Gross Longs: | 227,425 | 3,395,892 | 312,291 |
| – Gross Shorts: | 792,881 | 2,701,511 | 441,216 |
| – Long to Short Ratio: | 0.3 to 1 | 1.3 to 1 | 0.7 to 1 |
| NET POSITION TREND: | |||
| – Strength Index Score (3 Year Range Pct): | 0.0 | 97.9 | 45.6 |
| – Strength Index Reading (3 Year Range): | Bearish-Extreme | Bullish-Extreme | Bearish |
| NET POSITION MOVEMENT INDEX: | |||
| – 6-Week Change in Strength Index: | -46.5 | 35.7 | 3.8 |
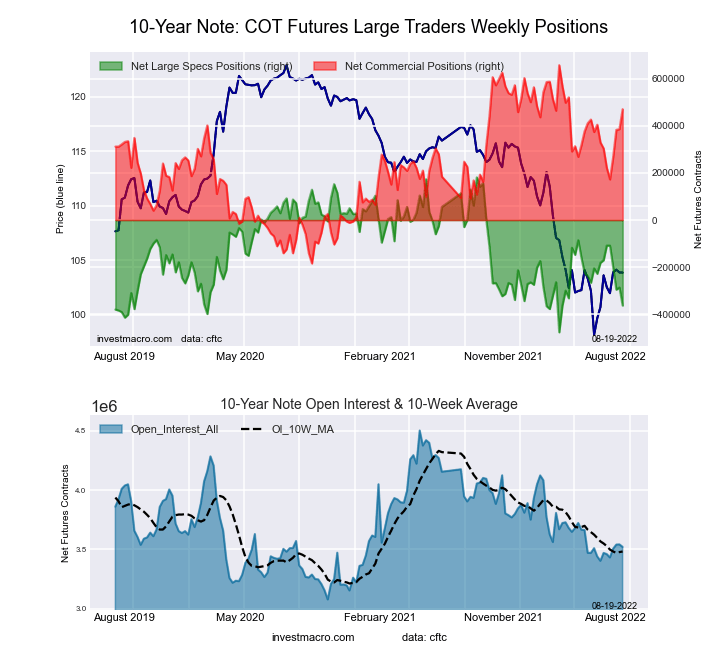
10-Year Treasury Note Futures:
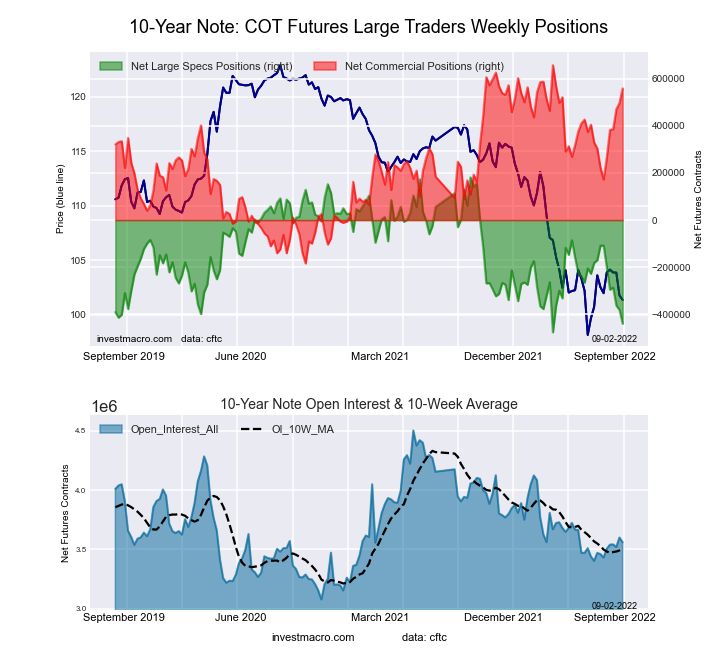 The 10-Year Treasury Note large speculator standing this week equaled a net position of -440,103 contracts in the data reported through Tuesday. This was a weekly decline of -58,934 contracts from the previous week which had a total of -381,169 net contracts.
This week’s current strength score (the trader positioning range over the past three years, measured from 0 to 100) shows the speculators are currently Bearish-Extreme with a score of 5.5 percent. The commercials are Bullish-Extreme with a score of 88.3 percent and the small traders (not shown in chart) are Bullish with a score of 51.9 percent.
| 10-Year Treasury Note Statistics | SPECULATORS | COMMERCIALS | SMALL TRADERS |
| – Percent of Open Interest Longs: | 6.8 | 79.5 | 9.4 |
| – Percent of Open Interest Shorts: | 19.2 | 63.8 | 12.7 |
| – Net Position: | -440,103 | 558,958 | -118,855 |
| – Gross Longs: | 241,872 | 2,829,749 | 334,948 |
| – Gross Shorts: | 681,975 | 2,270,791 | 453,803 |
| – Long to Short Ratio: | 0.4 to 1 | 1.2 to 1 | 0.7 to 1 |
| NET POSITION TREND: | |||
| – Strength Index Score (3 Year Range Pct): | 5.5 | 88.3 | 51.9 |
| – Strength Index Reading (3 Year Range): | Bearish-Extreme | Bullish-Extreme | Bullish |
| NET POSITION MOVEMENT INDEX: | |||
| – 6-Week Change in Strength Index: | -50.4 | 45.9 | -13.0 |
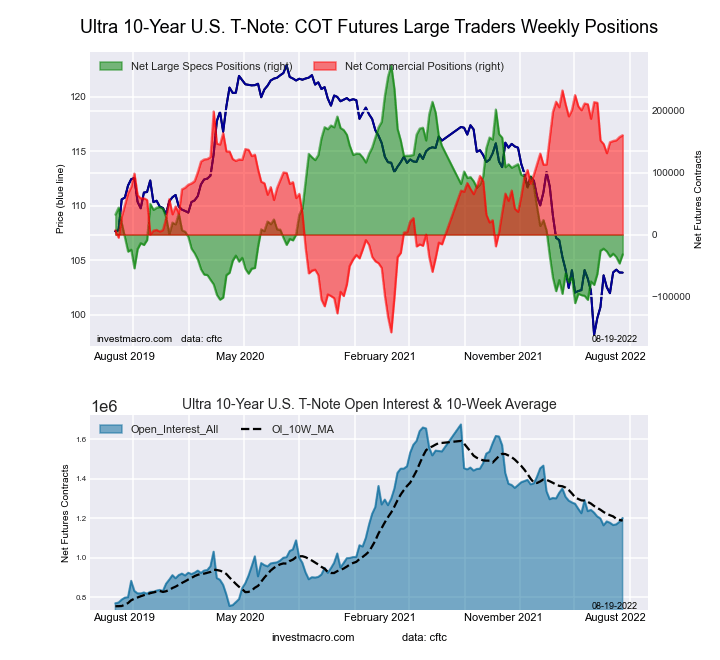
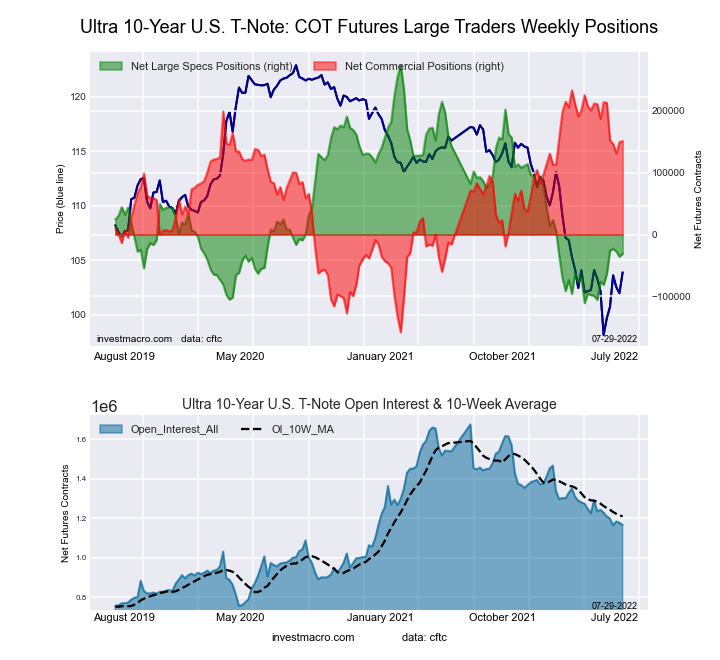
Ultra 10-Year Notes Futures:
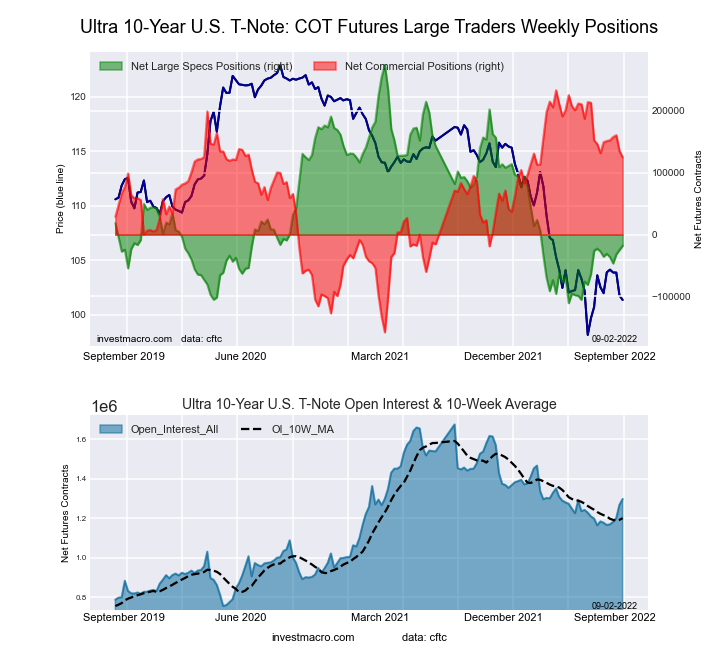 The Ultra 10-Year Notes large speculator standing this week equaled a net position of -17,986 contracts in the data reported through Tuesday. This was a weekly lift of 7,103 contracts from the previous week which had a total of -25,089 net contracts.
This week’s current strength score (the trader positioning range over the past three years, measured from 0 to 100) shows the speculators are currently Bearish with a score of 24.1 percent. The commercials are Bullish with a score of 72.3 percent and the small traders (not shown in chart) are Bullish with a score of 56.1 percent.
| Ultra 10-Year Notes Statistics | SPECULATORS | COMMERCIALS | SMALL TRADERS |
| – Percent of Open Interest Longs: | 5.2 | 80.1 | 10.0 |
| – Percent of Open Interest Shorts: | 6.5 | 70.5 | 18.2 |
| – Net Position: | -17,986 | 124,783 | -106,797 |
| – Gross Longs: | 66,830 | 1,039,205 | 129,753 |
| – Gross Shorts: | 84,816 | 914,422 | 236,550 |
| – Long to Short Ratio: | 0.8 to 1 | 1.1 to 1 | 0.5 to 1 |
| NET POSITION TREND: | |||
| – Strength Index Score (3 Year Range Pct): | 24.1 | 72.3 | 56.1 |
| – Strength Index Reading (3 Year Range): | Bearish | Bullish | Bullish |
| NET POSITION MOVEMENT INDEX: | |||
| – 6-Week Change in Strength Index: | 4.6 | -6.3 | 4.5 |
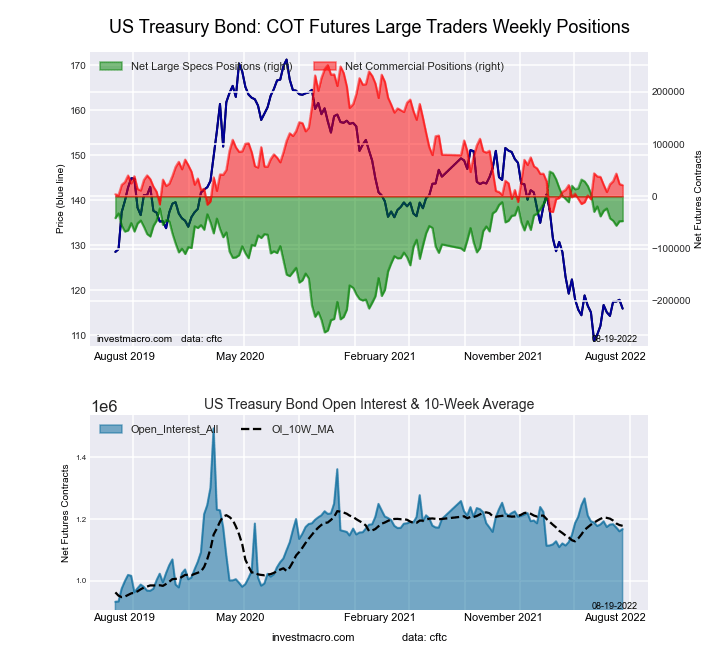
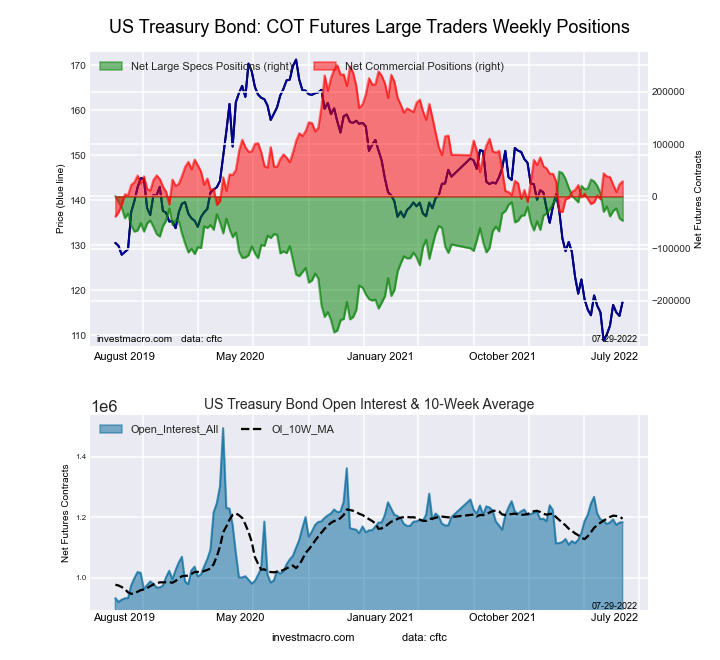
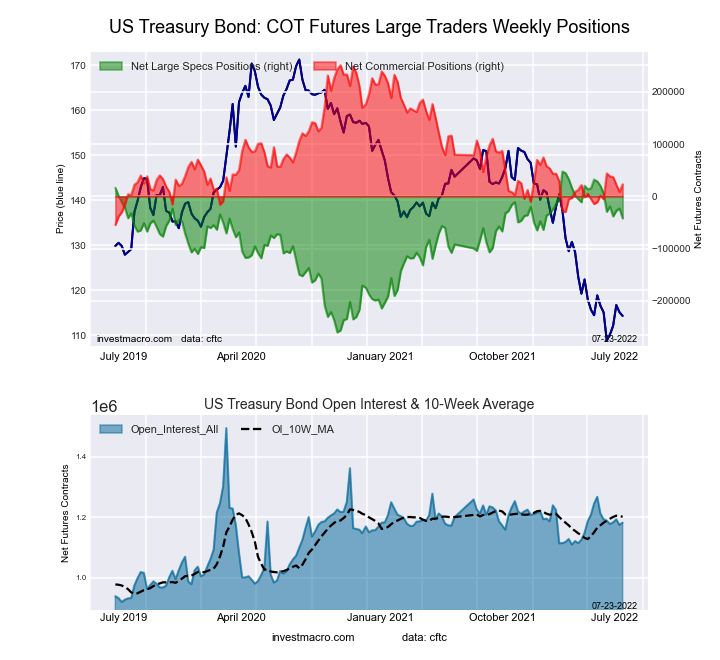
US Treasury Bonds Futures:
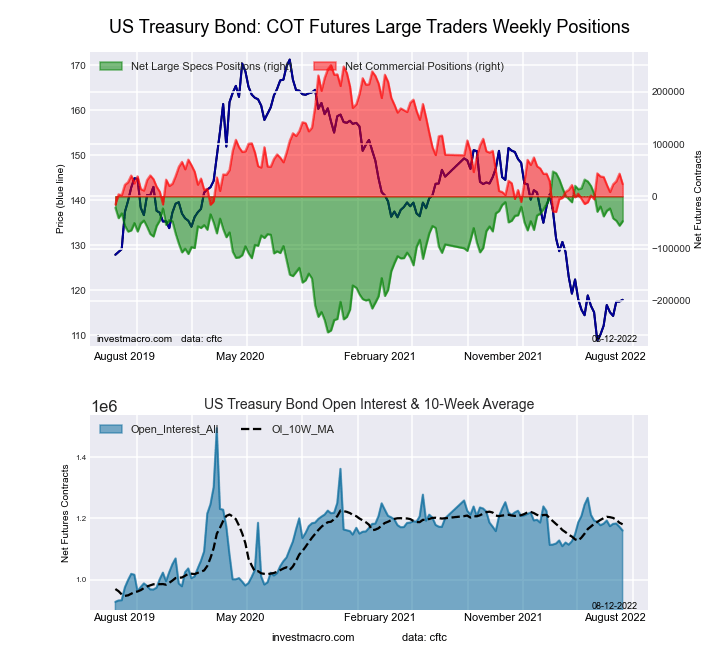
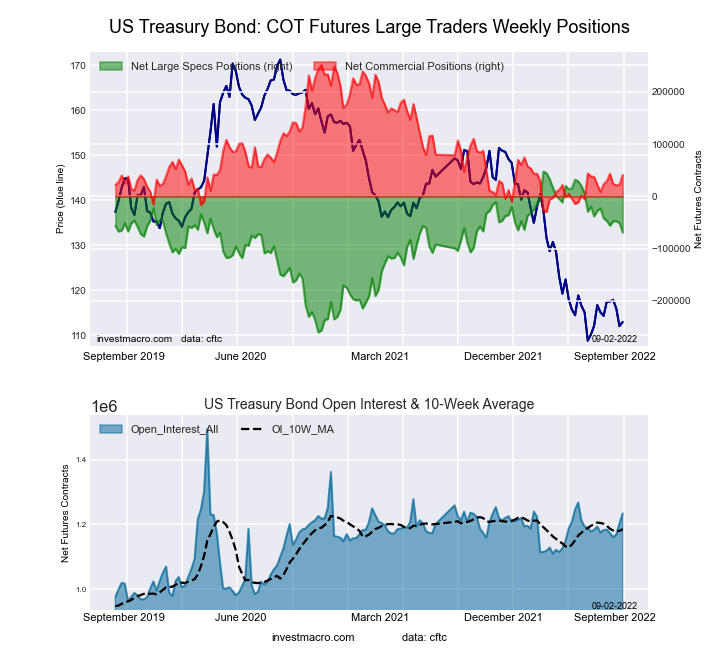 The US Treasury Bonds large speculator standing this week equaled a net position of -68,834 contracts in the data reported through Tuesday. This was a weekly lowering of -17,703 contracts from the previous week which had a total of -51,131 net contracts.
This week’s current strength score (the trader positioning range over the past three years, measured from 0 to 100) shows the speculators are currently Bullish with a score of 62.2 percent. The commercials are Bearish with a score of 25.2 percent and the small traders (not shown in chart) are Bullish with a score of 74.8 percent.
| US Treasury Bonds Statistics | SPECULATORS | COMMERCIALS | SMALL TRADERS |
| – Percent of Open Interest Longs: | 6.4 | 73.3 | 14.1 |
| – Percent of Open Interest Shorts: | 11.9 | 70.0 | 11.8 |
| – Net Position: | -68,834 | 40,789 | 28,045 |
| – Gross Longs: | 78,532 | 903,487 | 173,323 |
| – Gross Shorts: | 147,366 | 862,698 | 145,278 |
| – Long to Short Ratio: | 0.5 to 1 | 1.0 to 1 | 1.2 to 1 |
| NET POSITION TREND: | |||
| – Strength Index Score (3 Year Range Pct): | 62.2 | 25.2 | 74.8 |
| – Strength Index Reading (3 Year Range): | Bullish | Bearish | Bullish |
| NET POSITION MOVEMENT INDEX: | |||
| – 6-Week Change in Strength Index: | -8.7 | 6.3 | 7.1 |
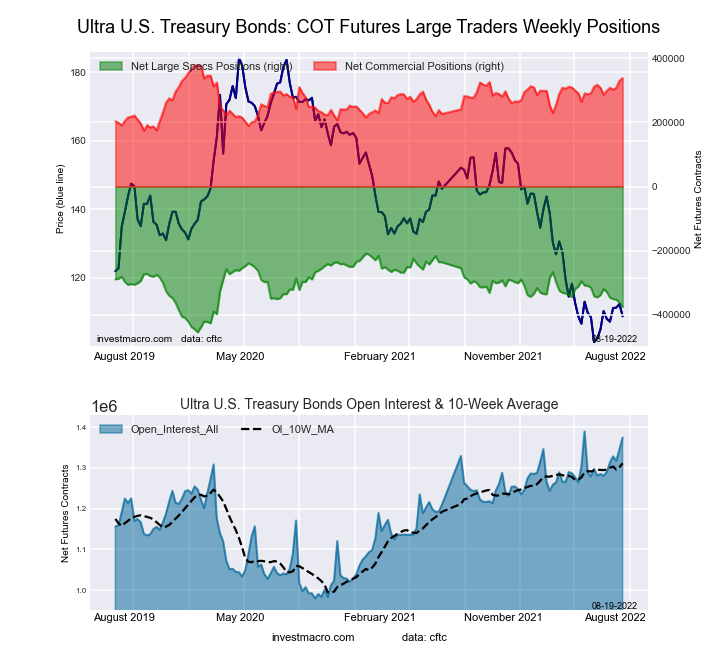
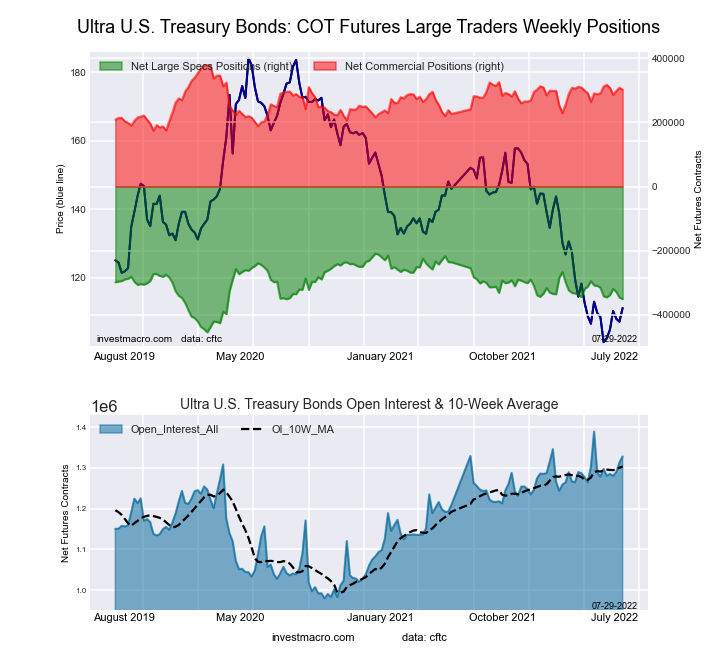
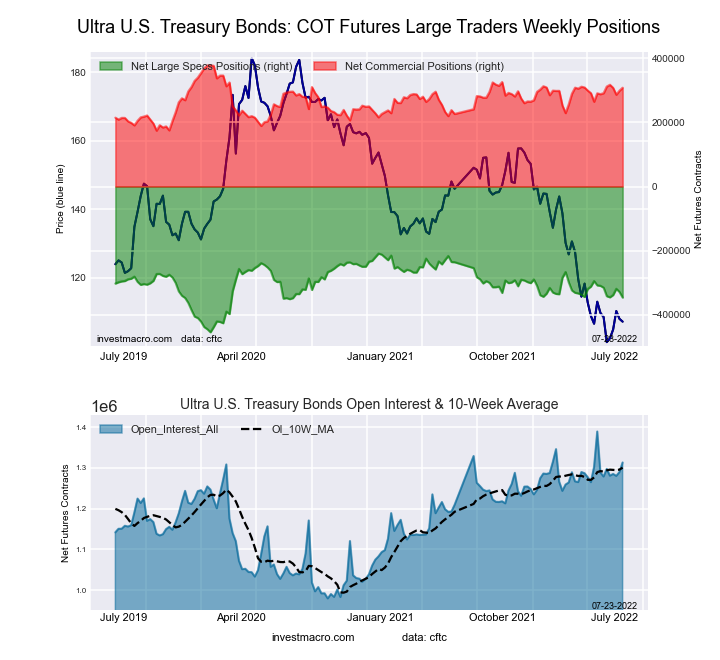
Ultra US Treasury Bonds Futures:
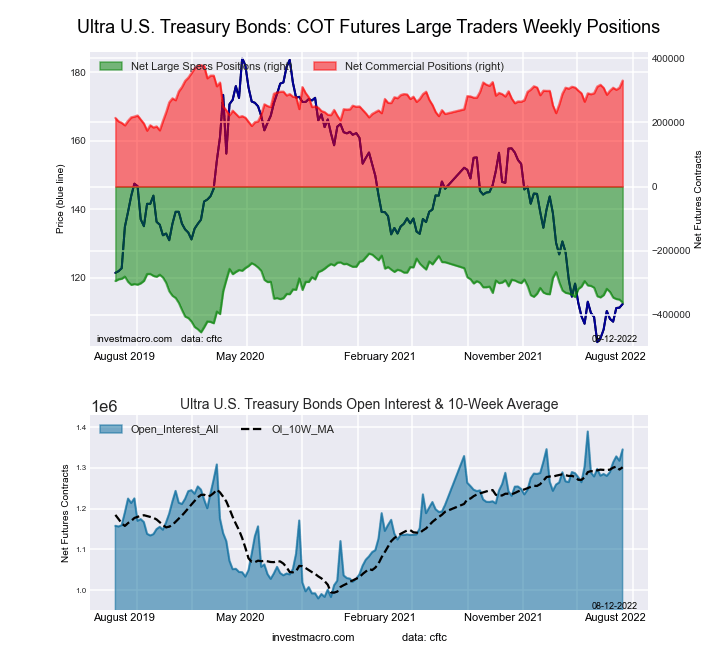
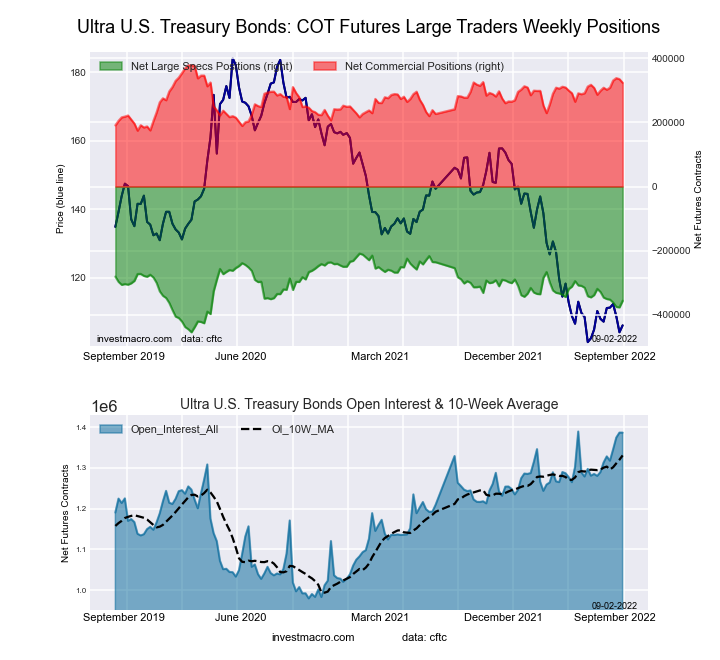 The Ultra US Treasury Bonds large speculator standing this week equaled a net position of -355,794 contracts in the data reported through Tuesday. This was a weekly boost of 20,439 contracts from the previous week which had a total of -376,233 net contracts.
This week’s current strength score (the trader positioning range over the past three years, measured from 0 to 100) shows the speculators are currently Bearish with a score of 40.1 percent. The commercials are Bullish with a score of 73.1 percent and the small traders (not shown in chart) are Bullish with a score of 51.7 percent.
| Ultra US Treasury Bonds Statistics | SPECULATORS | COMMERCIALS | SMALL TRADERS |
| – Percent of Open Interest Longs: | 5.6 | 81.7 | 10.8 |
| – Percent of Open Interest Shorts: | 31.3 | 58.4 | 8.5 |
| – Net Position: | -355,794 | 323,164 | 32,630 |
| – Gross Longs: | 77,899 | 1,132,704 | 150,042 |
| – Gross Shorts: | 433,693 | 809,540 | 117,412 |
| – Long to Short Ratio: | 0.2 to 1 | 1.4 to 1 | 1.3 to 1 |
| NET POSITION TREND: | |||
| – Strength Index Score (3 Year Range Pct): | 40.1 | 73.1 | 51.7 |
| – Strength Index Reading (3 Year Range): | Bearish | Bullish | Bullish |
| NET POSITION MOVEMENT INDEX: | |||
| – 6-Week Change in Strength Index: | -4.1 | 7.6 | -3.9 |
Article By InvestMacro – Receive our weekly COT Reports by Email
*COT Report: The COT data, released weekly to the public each Friday, is updated through the most recent Tuesday (data is 3 days old) and shows a quick view of how large speculators or non-commercials (for-profit traders) were positioned in the futures markets.
The CFTC categorizes trader positions according to commercial hedgers (traders who use futures contracts for hedging as part of the business), non-commercials (large traders who speculate to realize trading profits) and nonreportable traders (usually small traders/speculators) as well as their open interest (contracts open in the market at time of reporting). See CFTC criteria here.


