As of Wednesday, the Dow Jones Index (US30) rose by 0.18%. The S&P 500 Index (US500) gained 0.73%, and the tech-heavy Nasdaq Index (US100) closed up by 1.21%. The US stocks rose as investors reacted to strong corporate earnings and a major announcement from Apple, which pledged to invest an additional $100 billion in US manufacturing. Despite positive earnings reports from companies like Disney and Uber, some stocks, such as AMD, Snap, and Super Micro Computer, plunged due to disappointing results. Investor sentiment was supported by rising expectations of a Fed rate cut in September, with odds climbing to over 93% following soft labor market data. However, trade tensions flared again after President Trump imposed an additional 25% tariff on Indian goods due to continued imports of Russian oil, adding uncertainty.
European stock markets mostly rose yesterday. Germany’s DAX (DE40) increased by 0.33%, France’s CAC 40 (FR40) closed up 0.18%, Spain’s IBEX 35 (ES35) gained 0.90%, and the UK’s FTSE 100 (UK100) ended 0.24% higher. The Frankfurt DAX closed higher at 23,924, marking its third consecutive session of gains as traders weighed corporate earnings and looming US tariffs. President Trump is expected to impose broad tariffs on August 7 against countries that have not concluded trade deals. While the EU and US are finalizing their agreement, 15% tariffs on EU goods will take effect tomorrow, with Trump warning of a possible increase to 35% if the promised European investments are not fulfilled. He also confirmed plans to introduce tariffs on pharmaceutical imports “within the next week or so.”
WTI crude oil prices reversed earlier gains on Wednesday and fell by 1.2% to $64.30 per barrel, marking the fifth consecutive decline and hitting a new six-week low. Prices initially rose on supply concerns following President Trump’s decree imposing 25% tariffs on Indian goods due to Russian oil imports. Temporary support also came from a larger-than-expected US crude inventory draw of 3 million barrels. However, gains were dampened after US Secretary of State Marco Rubio stated that an announcement regarding potential sanctions against Russia could come later in the day, adding uncertainty to the market.
Asian markets mostly rose yesterday. Japan’s Nikkei 225 (JP225) climbed by 0.60%, China’s FTSE China A50 (CHA50) dipped by 0.07%, Hong Kong’s Hang Seng (HK50) edged up 0.03%, and Australia’s ASX 200 (AU200) closed with a solid 0.84% gain.
The Australian dollar strengthened to USD 0.648 on Wednesday, extending gains from the previous session, as rising expectations of a Fed rate cut in September boosted risk sentiment. Meanwhile, with little data expected this week, the Aussie may face headwinds as markets fully price in a 25 bp RBA rate cut to 3.60% on August 12.
The New Zealand dollar rose to USD 0.592 on Wednesday, rebounding from multi-week lows. However, the Kiwi’s upside may be limited by weaker-than-expected local employment data. New Zealand’s unemployment rate in Q2 rose to nearly a five-year high of 5.2%, slightly below expectations of 5.3%. This strengthened expectations that the Reserve Bank of New Zealand may cut rates at its upcoming August meeting. Markets currently price in a 90% chance of a 25 bp cut, with further easing to 2.75% expected by year-end or early next year. Additional concern comes from the Trump administration’s imposition of 15% tariffs on New Zealand exports starting August 7, which could place further pressure on the export-driven economy.
The offshore yuan remained stable around 7.18 per dollar on Thursday as investors digested the latest trade data. China’s trade surplus in July 2025 rose to $98.24 billion from $85.27 billion a year earlier. Export growth reached a three-month high of 7.2% year-over-year, significantly beating market expectations of 5.4%, mainly due to a temporary easing in tariff pressures ahead of the looming August deadline. Meanwhile, imports unexpectedly rose to an annual high, increasing 4.1% year-over-year, defying expectations for a 1.0% decline. In light of recent developments tied to a trade truce, President Donald Trump stated that the US and China are “very close” to extending the agreement set to expire on August 12.
S&P 500 (US500) 6,345.06 +45.87 (+0.73%)
Dow Jones (US30) 44,193.12 +81.38 (+0.18%)
DAX (DE40) 23,924.36 +78.29 (+0.33%)
FTSE 100 (UK100) 9,164.31 +21.58 (+0.24%)
USD Index 98.23 −0.55 (−0.55%)
News feed for: 2025.08.07
Australia Trade Balance (m/m) at 04:30 (GMT+3);
New Zealand Inflation Expectations (q/q) at 06:00 (GMT+3);
China Trade Balance (m/m) at 06:00 (GMT+3);
German Industrial Production (m/m) at 09:00 (GMT+3);
German Trade Balance (m/m) at 09:00 (GMT+3);
UK BoE Interest Rate Decision (m/m) at 14:00 (GMT+3);
UK BoE Monetary Policy Statement (m/m) at 14:00 (GMT+3);
Mexico Inflation Rate (m/m) at 15:00 (GMT+3);
US Initial Jobless Claims (m/m) at 15:30 (GMT+3);
Canada Ivey PMI (m/m) at 17:00 (GMT+3);
US Natural Gas Storage (w/w) at 17:30 (GMT+3);
Mexico Banxico Interest Rate Decision at 22:00 (GMT+3).
This article reflects a personal opinion and should not be interpreted as an investment advice, and/or offer, and/or a persistent request for carrying out financial transactions, and/or a guarantee, and/or a forecast of future events.
The GBP/USD pair climbed to 1.3355 on Thursday as markets braced for today’s Bank of England (BoE) meeting. Traders are closely watching two key factors: the voting split among Monetary Policy Committee (MPC) members and any signals regarding future rate moves.
The central bank is widely expected to cut interest rates by 25 basis points (bps) to 4.00%. However, there is speculation that some members, such as Swati Dingra or Alan Taylor, could push for a more aggressive 50 bps reduction, as seen in May. Should this occur, particularly if accompanied by a shift away from the BoE’s usual cautious tone, the pound could come under significant selling pressure.
Currently, markets have largely priced in a quarter-point cut. Yet, uncertainty remains around the future path of interest rates. While UK inflation remains elevated at 3.6%, well above the 2% target, the economy is weakening, and the labour market is showing signs of strain.
The baseline scenario suggests the BoE will maintain a gradual, data-dependent approach, with potential quarterly cuts. However, any deviation, such as a more aggressive voting split or dovish guidance, could significantly shift market sentiment.
Technical Analysis: GBP/USD
H4 Chart:
The GBP/USD pair has retraced to 1.3366 in a technical correction. A fifth downward wave towards 1.2942 is likely, potentially followed by a corrective rebound to 1.3366. This outlook is supported by the MACD indicator, with its signal line hovering near zero, signalling that downside momentum may soon resume.
H1 Chart:
A corrective wave is forming following the recent decline. The pair is currently consolidating around 1.3273 –a break above this range could see a push towards 1.3377. However, upon reaching this area, a fresh decline towards 1.3160 is anticipated. A breakdown below this would open the path to 1.2942. This bearish scenario is supported by the Stochastic oscillator, with the signal line below 80 and trending sharply down towards 20.
Conclusion
The pound remains vulnerable ahead of the BoE’s decision, with risks skewed towards further weakness if the central bank adopts a more dovish stance. Technically, the setup points to a resumption of the downtrend, with key levels at 1.3160 and 1.2942 in focus.
Disclaimer
Any forecasts contained herein are based on the author’s particular opinion. This analysis may not be treated as trading advice. RoboForex bears no responsibility for trading results based on trading recommendations and reviews contained herein
Stephen McBride of The Rational Optimist shares his thoughts on how nuclear energy can be reshaped.
A tiny uranium pellet the size of a gummy bear holds energy matching 140 oil barrels. It’s humanity’s most environmentally friendly, secure power resource.
Every legitimate expert acknowledges this fact.
So what’s preventing universal nuclear implementation?
In brief: We smothered brilliance with bureaucracy. Since the 70s, constructing new facilities has practically been prohibited in America. It demanded $30 billion plus 15+ years battling regulatory obstacles.
I’ve got exciting updates. During my recent visits to Austin and Detroit, I connected with top-tier nuclear innovators. I’ve known these innovators for some time and consider many friends. They unanimously shared something unprecedented:
“Regulation is finally becoming a solved problem.”
One entrepreneur mentioned his microreactor (a small nuclear reactor or “SMR”) could become operational within a year.
This represents massive progress! We’re developing an extensive analysis about SMRs and approximately twelve startups racing to launch one. More information coming soon.
Today, let’s examine remaining nuclear “challenges.” What about waste management? And fuel acquisition? We’ll explore entrepreneurs tackling both issues.
First, a quick overview of major regulatory shifts.
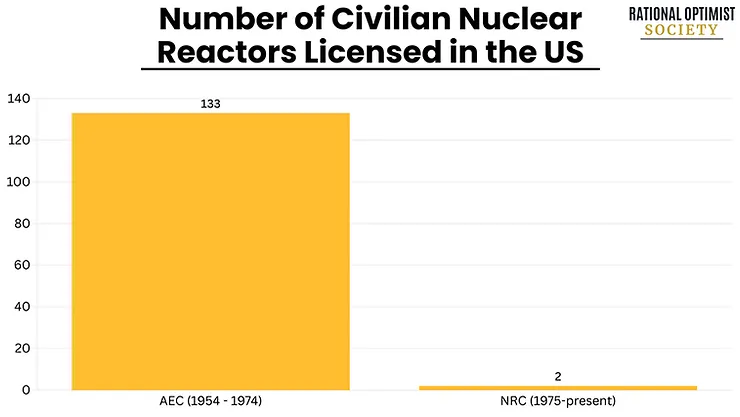
In 1974, a bureaucratic entity called the Nuclear Regulatory Commission (NRC) emerged. Guess how many innovative reactor designs it’s approved since inception?
None!
Just two reactors have begun commercial operations during the NRC’s existence, compared to 133 beforehand.
We’re finally addressing this imbalance. The President has authorized four executive directives to accelerate nuclear development. These orders initiate five significant changes:
Change 1: They establish a target of expanding America’s nuclear capacity fourfold by 2050.
Change 2: They accelerate “advanced nuclear” development (specifically small modular reactors or “SMRs”) through test programs and expedited environmental assessments. They mandate the NRC to authorize new reactors within 18 months.
Change 3: They instruct the Department of Energy (DoE) to sanction at least three reactors before mid-2026. Essentially, Trump wants three SMRs functioning for America’s 250th anniversary.
Change 4: They classify nuclear facilities powering AI operations as “defense-critical infrastructure.” Constructing nuclear-powered computing centers on military installations creates a brilliant workaround. It potentially enables projects to bypass lengthy NRC evaluations.
Change 5: Most crucially in my assessment: They request the NRC to reconsider its “As Low as Reasonably Achievable” (ALARA) regulation. You experience more radiation consuming a single banana than living beside a nuclear plant for twelve months. Yet under ALARA guidelines, even that isn’t considered sufficiently safe!
This “zero banana rule” has effectively prohibited nuclear construction in America. I believe the President should have commanded the NRC to eliminate this rule completely. Nevertheless, this represents advancement.
Nuclear entrepreneurs have anticipated this opportunity throughout their careers.
As Matt Loszak, founder of Aalo Atomics said, “We just have to wait for the executive orders to be implemented and we’re off to the races.”
In Detroit, Valar Atomics founder Isaiah Taylor said. . .
“The problem is no longer in the policy side. It’s now in the engineering side.”
One engineering challenge involves fuel acquisition.
Stephen with Valar Atomics founder Isaiah Taylor
Fuel access concerned many entrepreneurs I encountered. Even if prepared to activate their microreactors immediately, many would face obstacles. They lack necessary fuel.
Converting uranium from extraction to reactor-ready involves four fundamental stages:
Mining. Organizations like Cameco Corp. (CCO:TSX; CCJ:NYSE) (Canada) mine uranium in locations including Canada, Kazakhstan, Australia, Namibia, Niger, and Russia. These six nations produce over 85% of global uranium. Raw materials undergo processing into a substance called yellowcake.
Conversion. Yellowcake undergoes milling and conversion into uranium hexafluoride (UF6) enabling gasification for enrichment. Orano (France) and Rosatom (Russia) dominate over 50% of this market.
Enrichment. Nuclear “gas” undergoes enrichment through centrifugal spinning. Three corporations, Urenco (European consortium), Orano, and Rosatom control the enrichment market.
Fuel creation. Companies including Westinghouse (U.S.) and Framatome (France) compress and heat enriched uranium powder into solid ceramic pieces.
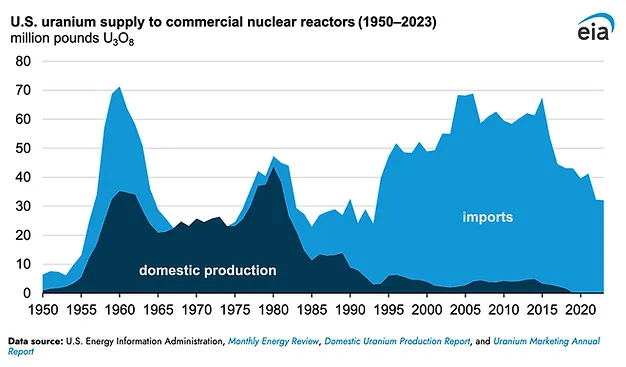
America possesses abundant underground uranium reserves. However, excessive regulation has minimized processing capabilities.
By 2023, 99% of fuel utilized in U.S. reactors was imported— with substantial quantities from Russia.
Meet innovators addressing this crisis . . .
Scott Nolan, partner at Peter Thiel’s investment firm Founders Fund, was among earliest backers of Radiant Nuclear, a venture developing portable microreactors. But Radiant encountered a major obstacle: fuel scarcity.
Specifically, limited access to high-assay low-enriched uranium (HALEU), premium uranium ideal for powering most microreactors.
Only Russia and China manufacture HALEU at scale. However, the U.S. plans to prohibit Russian uranium imports starting 2028. Leaving China — an unpredictable trade partner.
Accessing HALEU in America resembles Soviet-era bread queues. The DoE maintains limited reserves. Entrepreneurs must complete paperwork, endure months-long waits, and hope for allocations – merely to test prototypes. “Please sir, can I have some more?”
Scott Nolan established General Matter to produce HALEU fuel and revitalize America’s enrichment industry.
Meeting Scott at Detroit’s Reindustrialize summit, he shared “I spent over a year at Founders Fund searching for an American enrichment company to invest in, only to find there wasn’t one. So, we built our own.”
General Matter assembled elite professionals from organizations including SpaceX, Tesla, Anduril, and several American national nuclear laboratories. It was among four companies selected by the DoE to initiate American HALEU production.
If General Matter succeeds, it will achieve for uranium enrichment what SpaceX accomplished for rocketry: restore American competitiveness.
J.D. Rockefeller amassed historic wealth through Standard Oil.
Not through oil drilling. But by controlling the supply chain’s most valuable component: crude refinement.
Standard Nuclear aims to replicate this for nuclear energy. Its mission: become a scalable, affordable, entirely American nuclear fuel provider — the nuclear industry’s Standard Oil.
HALEU, optimal fuel for next-generation reactors, often comes encased in ceramic protection called TRISO, maintaining fuel density and safety.
TRISO appears as indestructible billiard ball-sized spheres. Each contains sufficient energy to power thousands of households.
Source: Kairos Power
TRISO resists melting. It prevents leakage. It contains radioactivity internally, even during extreme accidents. That’s why the DoE designates it Earth’s most robust nuclear fuel. Even the NRC acknowledges it as ‘functional containment.’
One entrepreneur described TRISO’s remarkable properties: “You know those giant concrete containment domes that surround old reactors in case something goes wrong? With TRISO, we’ve basically engineered the dome into every single fuel particle.”
TRISO provides microreactors with clean, compact, uninterrupted power, eliminating meltdown risks and massive containment structures.
China recently conducted safety testing by deactivating a nuclear reactor’s cooling system. The TRISO-powered reactor absorbed heat. The core cooled naturally. No alternative nuclear fuel demonstrates this capability.
Predictably, China remains the sole nation producing significant TRISO quantities.
Standard Nuclear will help America catch up.
Standard Nuclear represents genuine innovation. The company emerged following another company’s bankruptcy after its primary investor died. The team was commercializing TRISO, previously produced exclusively in America’s national laboratories.
Following the investor’s death, their commitment remained so strong that over 40 employees continued working approximately eight months without compensation. Some sold homes or downsized to maintain operations.
Their perseverance succeeded. In 2024, the organization reemerged as Standard Nuclear with $42 million in funding.
Standard Nuclear operates from Oak Ridge, Tennessee, formerly known as “Atomic City,” where Manhattan Project uranium enrichment occurred. It currently represents the largest TRISO manufacturing facility outside China.
Standard Nuclear recently secured $5 million in contracts and established offtake agreements exceeding $100 million with microreactor ventures including Radiant, Antares, and
NANO Nuclear Energy Inc. (NNE:NASDAQ).
“ROS never addresses the problem of nuclear waste storage.”
ROS Member John D highlighted this omission. Let me correct this.
Imagining radioactive material seeping from corroded containers seems frightening. Reality shows nuclear waste represents a resolved challenge. Innovators are transforming it into another opportunity.
Fundamentals: All nuclear waste ever generated throughout America — spanning 60 years — would occupy a single football field, stacked under 20 feet high.
Atomic byproducts have never harmed any American. Spent materials remain securely stored in sealed containers across 60+ locations throughout 34 states.
Why merely store it? SMR startups are creating reactors utilizing waste.
Oklo Inc.’s (OKLO:NYSE) Aurora microreactor, compact enough for a spacious living room, converts used fuel into fresh energy. Like automobiles running on exhaust fumes!
The most frustrating aspect regarding nuclear waste “problems” involves ignoring existing solutions for 60 years. Argonne National Laboratory constructed reactors capable of recycling nuclear waste into fuel during the 1960s!
Why isn’t fuel recycling standard practice? Blame political decisions. President Carter suspended reprocessing during the 1970s. Reagan reversed the prohibition, but companies had already pivoted elsewhere.
Consider Deep Isolation. I recently spoke with CEO Rod Baltzer. His company developed a methodology for permanently securing nuclear waste underground, utilizing directional drilling technology and their Universal Canister System.
Deep Isolation drills tunnels approximately pizza-box width into solid rock formations, reaching three miles beneath surface level. The tunnel’s bottom curves, creating an L-shaped pathway. They then insert sealed, corrosion-resistant containers filled with nuclear waste, designed for millennial timeframes.
Deep Isolation ensures waste disappears safely, permanently, and economically.
The genuine threat isn’t nuclear waste. It’s unrealized nuclear facilities, leaving us dependent on dirtier energy alternatives. Innovators are transforming perceived problems into productive power solutions.
Envision July 4, 2026. . .
We’re celebrating America’s 250th anniversary. The initial three microreactors operate on American soil. These engineered marvels generate clean, safe, “constantly available” energy.
After meeting numerous nuclear entrepreneurs, I recognize their determination toward this objective. Teams sleep in production facilities. Engineers work 18-hour shifts. Founders dedicate their lives toward achieving that July 2026 milestone.
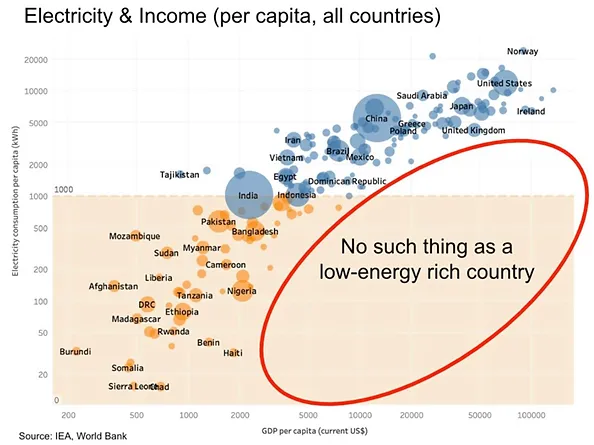
America’s prosperous future requires expanded energy access, not reduction. Remember: Rich, low-energy nations don’t exist.
In 1973 President Nixon proposed establishing 1,000 nuclear power plants before 2000. Better delayed than abandoned.
With 1,000 microreactors distributed across America, we could desalinate seawater and transform arid deserts into fertile land. Following hurricanes, mobile reactors could deploy, powering medical facilities and water systems within hours.
Building this future depends on communities nationwide embracing nuclear technology.
That’s where your role begins. Demonstrate to friends and relatives that nuclear represents our cleanest, safest energy resource. Challenge misinformed opposition.
Address questions resembling this inquiry: “What might terrorists accomplish capturing a microreactor?” Simple answer: they’d have years of clean energy, but concerns about weaponization are unfounded.
Perhaps most importantly, share nuclear innovation stories with younger generations! The Second Nuclear Age will create talent shortages. It requires engineers, technicians, machinists, and policy advocates.
The primary career aspiration among children today is… social media influencer. Disappointing. Let’s transform that to nuclear engineer!
At the Rational Optimist Society, we’re embracing nuclear technology and much more. We help our members understand, appreciate, and take advantage of the innovations revolutionizing our world for the better, so they can confidently flourish as change continues to accelerate.
As of the date of this article, officers and/or employees of Streetwise Reports LLC (including members of their household) own securities of Cameco Corp.
Stephen McBride: I, or members of my immediate household or family, own securities of: None. My company has a financial relationship with: None. My company has purchased stocks mentioned in this article for my management clients: None. I determined which companies would be included in this article based on my research and understanding of the sector.
Statements and opinions expressed are the opinions of the author and not of Streetwise Reports, Street Smart, or their officers. The author is wholly responsible for the accuracy of the statements. Streetwise Reports was not paid by the author to publish or syndicate this article. Streetwise Reports requires contributing authors to disclose any shareholdings in, or economic relationships with, companies that they write about. Any disclosures from the author can be found below. Streetwise Reports relies upon the authors to accurately provide this information and Streetwise Reports has no means of verifying its accuracy.
This article does not constitute investment advice and is not a solicitation for any investment. Streetwise Reports does not render general or specific investment advice and the information on Streetwise Reports should not be considered a recommendation to buy or sell any security. Each reader is encouraged to consult with his or her personal financial adviser and perform their own comprehensive investment research. By opening this page, each reader accepts and agrees to Streetwise Reports’ terms of use and full legal disclaimer. Streetwise Reports does not endorse or recommend the business, products, services or securities of any company.
As of Tuesday’s close, the Dow Jones Index (US30) declined by 0.14%. The S&P 500 Index (US500) fell by 0.49%, and the tech-heavy Nasdaq (US100) ended lower by 0.65%. The US stocks closed lower on Tuesday as investors grappled with disappointing economic data, escalating trade tensions, and mixed corporate earnings. Stagflation concerns resurfaced after the ISM Services Index showed activity stalled in July. Meanwhile, President Trump’s threats to impose steep tariffs of up to 250% on pharmaceutical imports, along with potential tariffs on semiconductors, heightened market anxiety amid ongoing trade uncertainty with India, Switzerland, and China. On the earnings front, Palantir rose by 7.8% after raising its revenue expectations, while Pfizer gained 5.2% following a strong quarterly report.
In June 2025, Canada’s trade deficit widened to CAD 5.9 billion (seasonally adjusted), up from the revised figure of CAD 5.5 billion in the previous month. Imports increased by 1.4% from a six-month low to CAD 67.6 billion, marking the first increase in four months. Exports to the US, subject to sectoral and country-specific tariffs, rose 3.1% from the previous month but remained 12.5% lower year-over-year.
European stock markets mostly rose yesterday. Germany’s DAX (DE40) gained 0.37%, France’s CAC 40 (FR40) closed down 0.14%, Spain’s IBEX35 (ES35) rose by 0.15%, and the UK’s FTSE 100 (UK100) closed up 0.16%. The DAX in Frankfurt gave up early gains and closed 0.4% higher on Tuesday as investors continued to monitor earnings season and trade developments, with US tariffs set to take effect on August 7. Under the US-EU deal, most EU exporters will face a unified 15% US tariff — half the 30% Trump had previously threatened. In return, the EU pledged to lower its own tariffs on certain goods and boost energy imports from the US by $750 billion over the remaining three and a half years of Trump’s presidency. However, Trump warned he could impose 35% tariffs on the EU if Brussels fails to meet its $600 billion investment commitment in US infrastructure.
WTI crude oil prices rose above $65 per barrel on Wednesday, snapping a four-day losing streak and rebounding from a five-week low amid supply disruption concerns. Investors assessed potential supply interruptions, as India may reduce imports of Russian oil in response to President Trump’s tariff threats over continued purchases. Trump warned of raising tariffs on Indian goods within 24 hours to pressure Russian President Vladimir Putin to end the war in Ukraine. Additional support for bulls came from API data showing a 4.2 million barrel drop in US crude inventories last week, exceeding market expectations of a 1.8 million barrel decline and signaling stronger-than-expected demand.
Silver held near $37.8 per ounce on Wednesday after rising for three straight sessions, supported by growing expectations of Federal Reserve rate cuts. The latest ISM Services PMI for July pointed to sluggish growth, a decline in employment, and persistent price pressures, reinforcing signs of labor market cooling after last week’s weaker-than-expected payroll report. Markets are now pricing in two Fed rate cuts by year-end, with the first potentially in September.
Asian markets mostly rose yesterday. Japan’s Nikkei 225 (JP225) gained 0.64%, China’s FTSE China A50 (CHA50) increased by 0.94%, Hong Kong’s Hang Seng (HK50) rose by 0.68%, and Australia’s ASX 200 (AU200) posted a strong performance, up 1.23%.
The Reserve Bank of India (RBI), at its August meeting, held the key repo rate steady at 5.50%, maintaining a neutral stance after cutting the rate by 50 basis points in June, more than usual and in line with expectations. The rate remains at its lowest level since August 2022. The decision came amid easing inflation and the recent US announcement of 25% tariffs on Indian imports. On the economic outlook, the RBI maintained its GDP growth expectations at 6.5% for the 2025/26 fiscal year and 6.6% for the following year. Meanwhile, inflation expectations were revised downward to 3.1% from 3.7%, remaining within the RBI’s target range of 2-6%.
Vietnam’s annual inflation rate fell to 3.19% in July 2025 from 3.57% in June, marking the lowest level in three months. Meanwhile, core inflation, excluding volatile items, slowed to 3.30% in July from 3.46% in June, also a three-month low. On a monthly basis, consumer prices rose by 0.11%, down from a 0.48% increase in the previous period.
In June 2025, the unemployment rate in New Zealand rose to 5.2%, which is slightly higher than the previous figure of 5.1% and in line with market expectations. The number of unemployed increased to 158,000 people compared to 156,000 in March, representing an annual increase of 16,000 people, or 11.1%. This data indicates growing slack in the labor market, putting pressure on policymakers as economic dynamics continue to weaken.
S&P 500 (US500) 6,299.19 −30.75 (−0.49%)
Dow Jones (US30) 44,111.74 −61.90 (−0.14%)
DAX (DE40) 23,846.07 +88.38 (+0.37%)
FTSE 100 (UK100) 9,142.73 +14.43 (+0.16%)
USD Index 98.76 −0.03 (−0.03%)
News feed for: 2025.08.06
New Zealand Unemployment Rate (q/q) at 01:45 (GMT+3);
Japan Average Cash Earnings (y/y) at 02:30 (GMT+3);
This article reflects a personal opinion and should not be interpreted as an investment advice, and/or offer, and/or a persistent request for carrying out financial transactions, and/or a guarantee, and/or a forecast of future events.
On Wednesday, the price of gold dipped to 3,375 USD per troy ounce but remained close to a two-week high, retaining most of its recent gains.
The market remains buoyed by demand for defensive assets amid expectations of a more dovish Federal Reserve policy.
The previous day saw the release of US ISM data, which showed the services sector business activity index for July falling to 50.1 points – below forecasts. The figures indicated sluggish growth, slowing employment, and mounting price pressures. Earlier data also pointed to a weakening labour market and declining consumer spending.
These developments have bolstered expectations that the Fed may cut interest rates as early as September, with markets now pricing in a 90% probability of such a move.
Further support for gold comes from new trade tariffs announced by US President Donald Trump, alongside investor concerns over the Federal Reserve’s independence following the resignation of Board of Governors member Lisa Kugler. Her departure paves the way for Trump to appoint a more accommodative successor.
Technical Analysis: XAU/USD
H4 Chart:
The XAU/USD pair is forming a broad consolidation range around 3,346 USD on the H4 chart. The market has corrected to 3,390 USD. Today, we assess the likelihood of a new downward wave developing towards 3,333 USD. A break below this level could extend the decline to a minimum of 3,255 USD. This scenario is technically supported by the MACD indicator, where the signal line remains above zero near recent highs but shows signs of an impending downturn.
H1 Chart:
On the H1 chart, the market has completed a corrective structure to 3,390 USD. A consolidation range is now forming below this level, with a downward breakout likely to extend the decline towards 3,320 USD. A breach of this support could signal further downside momentum, potentially targeting 3,200 USD. The Stochastic oscillator corroborates this outlook, with its signal line below 50 and trending sharply downward towards 20.
Conclusion
Gold remains resilient near recent highs, supported by macroeconomic uncertainties and shifting Federal Reserve expectations. However, technical indicators suggest potential near-term downside, with key support levels at 3,333 USD (H4) and 3,320 USD (H1) in focus.
Disclaimer
Any forecasts contained herein are based on the author’s particular opinion. This analysis may not be treated as trading advice. RoboForex bears no responsibility for trading results based on trading recommendations and reviews contained herein.
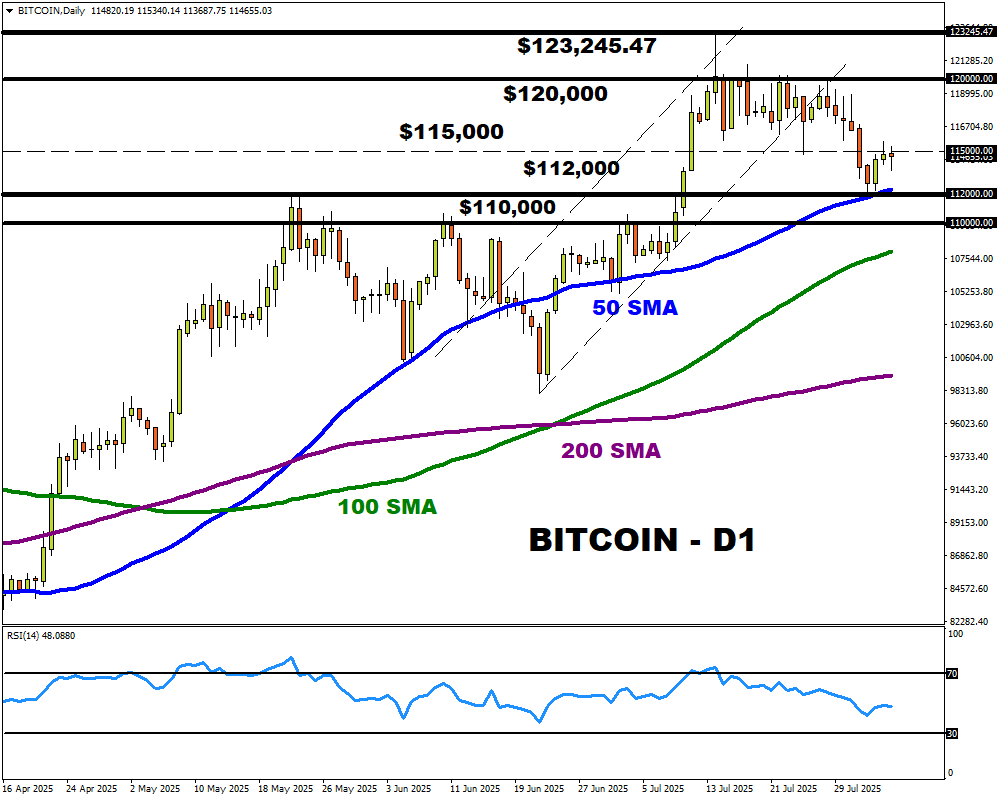
Bitcoin remains in standby mode with prices lingering around $115k in the absence of a fresh directional catalyst.
Despite the action witnessed last Friday, the “OG” crypto remains trapped within a range with support identified at the 50-day SMA.
This period of calm could come to an end amid Trump’s tariff drama and market bets around the Fed cutting interest rates.
As of now, the massive ETF outflow of $812 million last Friday suggests that bears could strike. This was the biggest single-day outflow seen since late February 2025, when Bitcoin ended the month 17% lower.
Considering how Trump’s updated tariffs come into effect on Thursday, 7th August, risk assets, including Bitcoin could be exposed to downside risks.
Beyond the tariff drama, Bitcoin could also be influenced by US economic data and Fed cut expectations. Should US data support the argument around lower interest rates, this may support Bitcoin. The same can be said vice versa.
Potential scenarios:
Bullish Scenario: A clean breakout above $115k could push prices toward $120k and $123k.
Bearish Scenario: Weakness below $115k may trigger a decline back toward $112k and $110k.
The EUR/USD pair edged lower on Tuesday, dipping to 1.1556 amid subdued trading activity. Market participants are cautiously assessing the latest trade signals and recalibrating their expectations for monetary policy.
Trade tensions resurfaced as US President Donald Trump threatened India with steep tariff hikes over its continued purchases of Russian oil. Meanwhile, the European Union postponed retaliatory tariffs against the US by six months, with both sides pledging further negotiations.
The US dollar faced downward pressure last week following the release of a disappointing US employment report. July’s figures fell short of forecasts, reinforcing market bets on a Fed rate cut in September. Investors are now pricing in over 60 basis points’ worth of easing by year-end.
Political uncertainty also weighed on sentiment. The resignation of a Federal Reserve Board member and the dismissal of a key statistical agency head under Trump’s administration have fuelled concerns over stability in the US economic leadership.
Market focus now shifts to June’s foreign trade data and the latest ISM PMI report, which could offer fresh insights into the health of the US economy.
Technical Analysis: EUR/USD
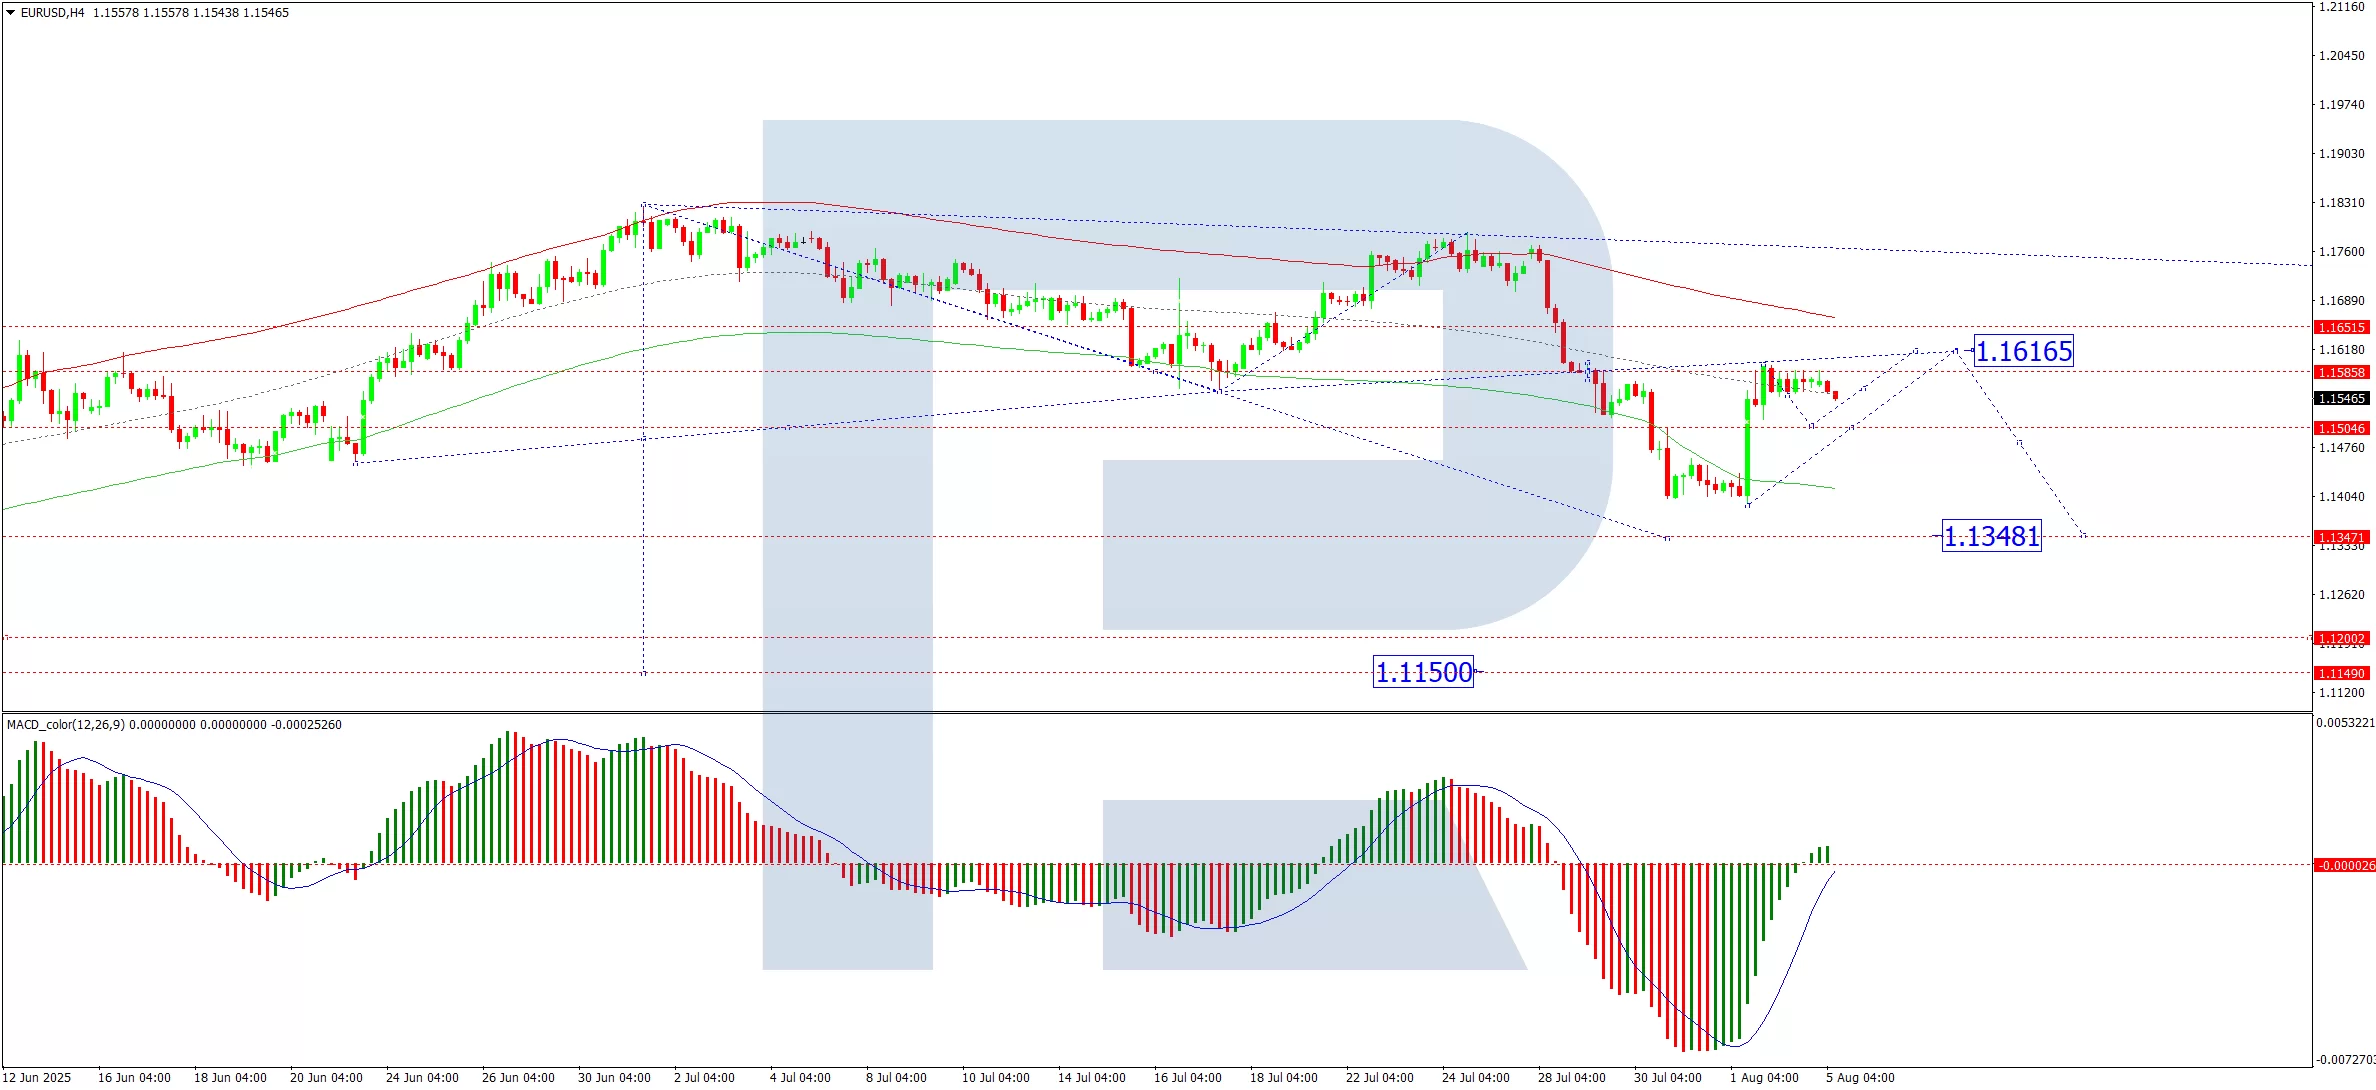
H4 Chart:
The EUR/USD corrected to 1.1590 before entering consolidation below this level. A breakout towards 1.1615 remains possible, but the primary expectation is a resumption of the downtrend, targeting 1.1348 as the next key support. This bearish view is supported by the MACD indicator, with its signal line firmly below zero and pointing downward.
H1 Chart:
The pair has formed a consolidation range around 1.1555, with the minimum correction target already met. A downside breakout is anticipated, initiating the fifth wave of decline towards 1.1348. The Stochastic oscillator reinforces this outlook, with its signal line below 50 and trending sharply downward towards 20.
Conclusion
The EUR/USD remains vulnerable to further losses, driven by a combination of weakening technical structure and external macroeconomic pressures. Traders should monitor US economic data for signals on near-term direction, as the broader downtrend remains intact.
Disclaimer
Any forecasts contained herein are based on the author’s particular opinion. This analysis may not be treated as trading advice. RoboForex bears no responsibility for trading results based on trading recommendations and reviews contained herein.
The Dow Jones Index (US30) rose by 1.34% by the end of Monday. The S&P 500 Index (US500) gained 1.47%, and the tech-heavy Nasdaq (US100) closed 1.95% higher. The indexes’ growth was fueled by renewed hopes for a September Fed rate cut following a weak July employment report and a downward revision of data from previous months. In response, President Trump fired the head of the Bureau of Labor Statistics and stated he would name a replacement this week. Meanwhile, updated tariffs ranging from 10% to 41% added additional pressure, although Switzerland and the EU signaled an openness to negotiations. Mega-cap tech stocks led the gains as traders focused on strong earnings, with 82% of S&P 500 companies reporting better-than-expected results so far. Palantir jumped 4.2% ahead of its post-market earnings release, Nvidia was up 3.5%, and Amazon gained 1.5%.
European stock markets were mostly higher yesterday. The German DAX (DE40) increased by 1.42%, the French CAC 40 (FR40) closed up 1.14%, the Spanish IBEX35 (ES35) gained 1.84%, and the British FTSE 100 (UK100) closed 0.66% higher on Monday. The FTSE 100’s Monday gains were driven by a sharp rise in British bank stocks after a favorable Supreme Court ruling on a motor finance case. Shares of Lloyds Banking Group surged over 8% to their highest level since 2015, while Barclays climbed 1.5%. HSBC and Standard Chartered also saw gains. The ruling overturned a lower court decision, easing fears of massive compensation payouts related to mis-selling car loans. The Financial Conduct Authority is now estimating a potential redress amount of £9 billion, significantly lower than earlier market fears of up to £30 billion. The ratings agency RBC upgraded Lloyds, the largest player in the UK car finance market, calling the court decision an “event that removes significant pressure on the stock.” BP shares also rose nearly 2% ahead of its earnings report as investors anticipate new insights into the company’s return to traditional energy sources.
The Swiss franc weakened to 0.81 against the US dollar as concerns about newly announced US tariffs overshadowed modest Swiss inflation growth. On August 1st, the Trump administration announced 39% tariffs on Swiss exports, higher than the 31% tariffs announced in April, with the measures taking effect on August 7th. If the tariffs remain in place, they are expected to intensify disinflationary pressure in Switzerland. Meanwhile, inflation in July grew slightly to 0.2% year-over-year, which was higher than the 0.1% expectation but still near zero. The subdued price growth, combined with rising external risks, suggests that the Swiss National Bank may resort to further negative interest rate cuts. The Swiss Manufacturing PMI fell to 48.8 in July from 49.6 in June, signaling a deeper downturn in the sector.
WTI crude oil prices fell to $66.3 per barrel on Monday as traders digested the OPEC+ decision to increase production and growing geopolitical uncertainty. The group confirmed a widely anticipated production increase of 547,000 barrels per day starting in September, completing the phased unwinding of voluntary cuts enacted in 2023. While the move was expected, it heightened expectations that global oil supply could outpace demand this year, potentially leading to a buildup in inventories. Traders are also monitoring potential US actions on Russian oil flows. President Trump has threatened to impose additional sanctions on countries buying Russian oil, specifically targeting India, with possible measures taking effect as early as August 8th.
The US natural gas prices fell below the $3/ 3/MMBtu mark, nearing a low not seen since November 2024, as production outpaces demand. According to LSEG, average output in the Lower 48 states reached 107.5 billion cubic feet per day in July, surpassing June’s record of 106.4 billion cubic feet per day. As a result, the latest EIA data showed a larger-than-expected injection into storage of 48 billion cubic feet for the week ending July 25th, exceeding forecasts of 38 billion cubic feet.
Asian markets were mostly higher yesterday. The Japanese Nikkei 225 (JP225) fell by 1.25%, the Chinese FTSE China A50 (CHA50) rose by 0.52%, the Hong Kong Hang Seng (HK50) gained 0.92%, and the Australian ASX 200 (AU200) had a positive result of 0.02% yesterday.
Hong Kong stocks dropped to 24,711 on Tuesday morning, reversing the previous session’s gains. Investors cautiously awaited China’s July trade data and upcoming inflation figures amid concerns over rising trade barriers and weak domestic demand. Consumer stocks fell while real estate, financial, and tech stocks saw modest gains. Further losses were contained by an overnight rally on Wall Street amid some bargain hunting after Friday’s decline and increased bets on a September rate cut. Meanwhile, according to a private survey, China’s services activity grew at its fastest pace in 14 months in July.
S&P 500 (US500) 6,329.94 +91.93 (+1.47%)
Dow Jones (US30) 44,173.64 +585.06 (+1.34%)
DAX (DE40) 23,757.69 +331.72 (+1.42%)
FTSE 100 (UK100) 9,128.30 +59.72 (+0.66%)
USD index 98.79 −0.36 (−0.36%)
News feed for: 2025.08.05
Australia Services PMI (m/m) at 02:00 (GMT+3);
Japan Monetary Policy Meeting Minutes at 02:50 (GMT+3);
Japan Services PMI (m/m) at 03:30 (GMT+3);
China Caixin Services PMI (m/m) at 04:45 (GMT+3);
German Services PMI (m/m) at 10:55 (GMT+3);
Eurozone Services PMI (m/m) at 11:00 (GMT+3);
UK Services PMI (m/m) at 11:30 (GMT+3);
Eurozone Producer Price Index (m/m) at 12:00 (GMT+3);
This article reflects a personal opinion and should not be interpreted as an investment advice, and/or offer, and/or a persistent request for carrying out financial transactions, and/or a guarantee, and/or a forecast of future events.
On Friday, the Dow Jones Index (US30) declined by 1.23% (-3.02% for the week). The S&P 500 Index (US500) dropped by 1.60% (-2.50% for the week), and the Nasdaq Tech Index (US100) closed down by 1.96% (-2.48% for the week). The US stocks fell on Friday as investors reacted to weak July employment data and a new round of tariffs announced by President Trump. Non-farm payrolls increased by just 73,000 in July, well below expectations, and sharp downward revisions to previous months’ data pointed to deeper labor market weakness. Treasury yields fell, and the probability of a Fed rate cut in September rose above 80%. Sentiment also soured after the US imposed new tariffs ranging from 10% to 41% on imports from key partners, including Canada, India, and Taiwan. On the corporate front, Amazon dropped nearly 8% due to disappointing cloud forecasts, dragging the broader market, while Apple fell 2.9% despite strong results. Exxon (-1.8%) and Chevron (-0.1%) beat expectations, Eli Lilly rose by 3% on hopes of drug coverage, while Moderna plunged 6.6% amid renewed vaccine concerns.
The Mexican peso fell to a one-month low, breaking through 18.80 per USD, despite broad dollar weakness, primarily reflecting domestic factors and tariff concerns weighing on the currency. The S&P Global Manufacturing PMI for July remained at 49.1 for the thirteenth consecutive month, while the business confidence index stayed below the 49.4 threshold, indicating falling export demand and reduced capital expenditures.
The Canadian dollar strengthened to 1.38 per USD, rebounding from a two-month low as the dollar weakened following the weak US non-farm payroll report showing just 73,000 new jobs vs. 110,000 expected, and a net downward revision of 258,000 positions. This boosted bets on a Fed rate cut in September. At the same time, Canada’s economy showed surprising resilience: after a 0.1% GDP contraction in May, a 0.1% increase is expected in June, with manufacturing output rising by 0.7%. This supports the Bank of Canada’s decision to hold rates steady at 2.75%, standing in sharp contrast to the Fed’s more dovish stance. Although President Trump’s surprise announcement of 35% tariffs briefly shook markets, Canadian exemptions under USMCA effectively cap export taxes at around 5%, softening any major impact on cross-border trade flows.
European stock markets mostly declined on Friday. Germany’s DAX (DE40) fell 2.66% (weekly: -4.09%), France’s CAC 40 (FR40) closed down 2.91% (weekly: -4.77%), Spain’s IBEX35 (ES35) dropped 1.88% (weekly: -1.68%), and the UK’s FTSE 100 (UK100) closed Friday 0.70% (weekly: -0.57%). European equities closed sharply lower on Friday, following a steep global market sell-off as the US government expanded the range of imports subject to tariffs. While the base tariff remained at 10%, rates were sharply increased for India (25%), Canada (35%), and Switzerland (39%). Overall, the average US tariff rate will rise to 15%, compared to roughly 2% in 2024. Additionally, banks and industrial giants fell sharply following the pessimistic US labor report: Siemens, Intesa Sanpaolo, ING, BNP Paribas, and Schneider dropped more than 4%.
WTI crude oil prices fell by 2.7% to $67.3 per barrel on Friday amid reports that OPEC and its allies may soon agree to raise output. Market sentiment also deteriorated following newly signed tariffs by President Trump on imports from dozens of countries, including Canada, India, and Taiwan, which will take effect on August 7.
Silver hovered around $37 per ounce on Monday after rising nearly 1% in the previous session, supported by rising expectations of a Fed rate cut following the weak July jobs report. A falling dollar and lower Treasury yields further boosted silver’s appeal.
Asian markets mostly declined last week. Japan’s Nikkei 225 (JP225) dropped by 1.73%, China’s FTSE China A50 (CHA50) fell by 2.19%, Hong Kong’s Hang Seng (HK50) declined by 3.74%, while Australia’s ASX 200 (AU200) posted a slight weekly loss of 0.06%.
On Monday, the offshore yuan held its recent gains at 7.19 per USD after the People’s Bank of China announced the formation of a new committee on macroprudential and financial stability. The central bank reaffirmed its accommodative stance, pledging to manage key financial risks and maintain ample liquidity in H2 with an “appropriately loose” monetary policy. Lending to strategic sectors such as technology and green development has surged, reflecting policy priorities. Meanwhile, investors are watching the key October policy plenum, where officials are expected to present countermeasures to persistent deflationary pressure, excess industrial capacity, and the ongoing real estate downturn. Recent signals from the Politburo point to more stimulus through bond issuance and demand-boosting measures.
S&P 500 (US500) 6,238.01 −101.38 (−1.60%)
Dow Jones (US30) 43,588.58 −542.40 (−1.23%)
DAX (DE40) 23,425.97 −639.50 (−2.66%)
FTSE 100 (UK100) 9,068.58 −64.23 (−0.70%)
USD index 98.69 −1.28 (−1.28%)
News feed for: 2025.08.04
Switzerland Consumer Price Index (m/m) at 09:30 (GMT+3);
Switzerland Manufacturing PMI (m/m) at 10:30 (GMT+3).
This article reflects a personal opinion and should not be interpreted as an investment advice, and/or offer, and/or a persistent request for carrying out financial transactions, and/or a guarantee, and/or a forecast of future events.
The USD/JPY pair climbed to 147.67 on Monday as the Japanese yen underwent a correction following Friday’s volatile trading session, with investors closely monitoring macroeconomic developments.
Market focus remains on shifting US Federal Reserve policy expectations after the release of softer labour market data. Although Friday’s report bolstered predictions of a rate cut, Fed officials have maintained a cautious tone, citing persistent inflation risks. Proposed large-scale tariffs from US President Donald Trump have further amplified these concerns.
Against this backdrop, the US dollar has partially regained strength, exerting downward pressure on the yen.
Investors are now awaiting the release of the Bank of Japan (BoJ) meeting minutes, hoping for clues on the timing of a potential rate hike. Last week, the Japanese central bank left interest rates unchanged but raised its inflation forecast and highlighted growing uncertainty due to global trade risks.
Overall, the outlook for the JPY remains subdued. The BoJ has ample room to delay rate hikes, justifying its stance with ongoing caution.
Technical Analysis: USD/JPY
H4 Chart:
On the H4 chart, USD/JPY completed an upward wave to 150.90 before entering a correction phase. A further decline towards 146.52 is anticipated today. Once this level is reached, the pair may initiate a new growth wave, potentially targeting 151.00, with a longer-term prospect of extending the trend to 153.10. This scenario is supported by the MACD indicator, where the signal line remains above zero but is trending sharply downward.
H1 Chart:
On the H1 chart, USD/JPY is forming a corrective structure towards 146.52. A temporary rebound to 148.70 (testing from below) is expected today, followed by a possible resumption of the correction to 146.52. Once this correction concludes, a fresh upward wave towards 151.00 could materialise. The Stochastic oscillator validates this outlook, with its signal line positioned above 50 and pointing upwards.
Conclusion
The yen remains under pressure amid shifting Fed expectations and cautious BoJ signals. Technically, USD/JPY is poised for further correction before potentially resuming its uptrend.
Disclaimer
Any forecasts contained herein are based on the author’s particular opinion. This analysis may not be treated as trading advice. RoboForex bears no responsibility for trading results based on trading recommendations and reviews contained herein.