
By Analytical Department RoboForex
Gold fell below 4,700 USD per troy ounce on Monday, extending last week’s losses. Pressure on the precious metal has intensified following the breakdown of attempts to resume negotiations between the US and Iran, as well as the continued closure of the Strait of Hormuz, supporting inflationary risks.
Donald Trump cancelled the US delegation’s trip to Islamabad for negotiations, while Tehran stated that it would not participate in dialogue under pressure or while under blockade.
Meanwhile, oil prices are rising. The Middle East conflict has now entered its ninth week. According to the IEA, it has triggered the largest supply shock in the energy market in recent history.
High inflationary risks are increasing expectations that central banks will keep interest rates elevated for longer, or even tighten policy further, putting pressure on gold as a non-yielding asset.
The Federal Reserve, for its part, remains cautious. The market still anticipates a gradual rate cut, but not in the near term.
Free Reports:
 Download Our Metatrader 4 Indicators – Put Our Free MetaTrader 4 Custom Indicators on your charts when you join our Weekly Newsletter
 Get our Weekly Commitment of Traders Reports - See where the biggest traders (Hedge Funds and Commercial Hedgers) are positioned in the futures markets on a weekly basis.
Technical Analysis
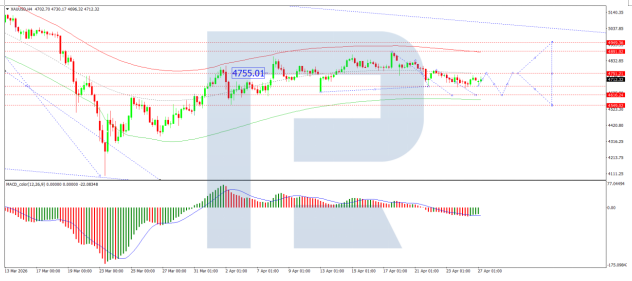
On the H4 XAU/USD chart, gold is trading within a consolidation range around the 4,690 USD level. An upside breakout could push prices towards 4,751 USD, while a downside break could lead to a move lower towards 4,616 USD. The MACD indicator confirms the current downside momentum, with its signal line below the centre line and pointing firmly downwards.
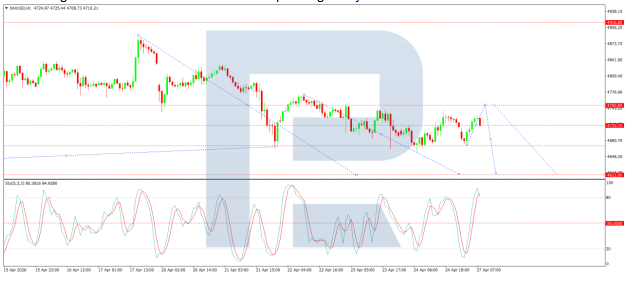
On the H1 chart, gold has broken below the 4,710 USD level and continues to move lower towards 4,680 USD. A corrective rebound towards 4,750 USD (testing from below) is likely, followed by a possible decline to 4,610 USD. The Stochastic oscillator supports this scenario, with its signal line below 80 and pointing firmly downwards towards 20.
Conclusion
Gold continues to decline as geopolitical tensions show no signs of easing. The breakdown of US-Iran negotiations, combined with the ongoing blockade of the Strait of Hormuz, has pushed oil prices higher and heightened inflationary risks. With the conflict now in its ninth week and the IEA describing it as the largest supply shock in energy markets, central banks are expected to maintain or even tighten policy rates for longer. This environment remains unfavourable for non-yielding gold. The Fed’s cautious stance offers little immediate relief. Technical indicators point firmly lower, with further downside towards 4,616–4,610 USD likely in the near term.
Disclaimer
Any forecasts contained herein are based on the author’s particular opinion. This analysis may not be treated as trading advice. RoboForex bears no responsibility for trading results based on trading recommendations and reviews contained herein.

- Oil prices fall back to pre‑war levels. Silver drops to a 7‑month low Jun 25, 2026
- Gold Falls to an Eight-Month Low: This May Not Be the Bottom Jun 25, 2026
- Stock indices came under heavy selling pressure amid growing skepticism about AI investments Jun 24, 2026
- The Pound Is Pressured Not by Politics, but by a Strong US Dollar Jun 24, 2026
- Global crude oil prices continued to decline. The AUD/USD exchange rate hit an 11‑week low Jun 23, 2026
- EUR/USD Remains Under Sellers’ Control as the Dollar Stays Strong Jun 23, 2026
- Gold Falls for the Third Consecutive Week: Is There Still Upside Potential? Jun 22, 2026
- Bank Indonesia raised its interest rate. Norges Bank and the SNB left rates unchanged Jun 19, 2026
- EUR/USD Loses Ground as Market Sentiment Favours the US Dollar Jun 19, 2026
- GBPUSD Awaits Bank of England Meeting Near April Lows Jun 18, 2026