
By InvestMacro
Here are the latest charts and statistics for the Commitment of Traders (COT) reports data published by the Commodities Futures Trading Commission (CFTC).
The latest COT data is updated through Tuesday February 3rd and shows a quick view of how large traders (for-profit speculators and commercial hedgers) were positioned in the futures markets.
Weekly Speculator Changes led by SOFR 1-Months, SOFR 3-Months & Ultra 10-Year Bonds
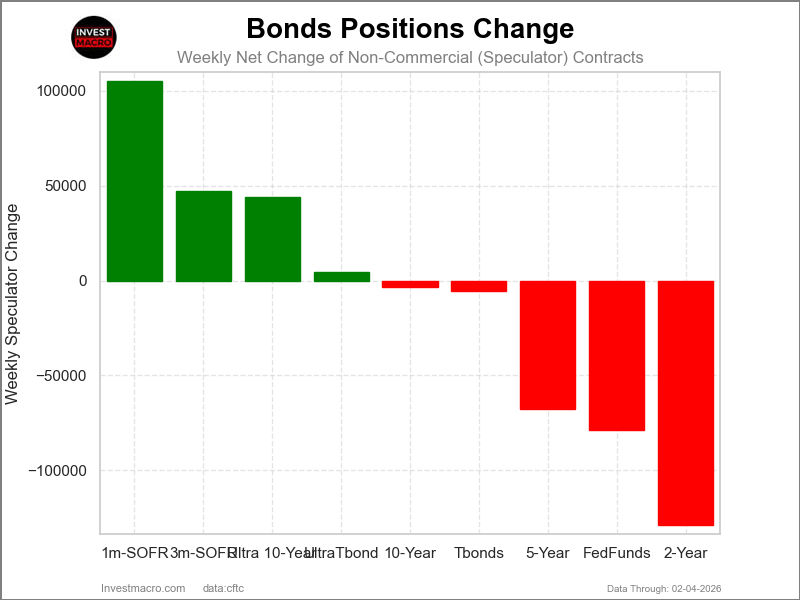
The COT bond market speculator bets were overall lower this week as four out of the nine bond markets we cover had higher positioning while the other five markets had lower speculator contracts.
Leading the gains for the bond markets was the SOFR 1-Month (104,956 contracts) with the SOFR 3-Months (47,235 contracts), the Ultra 10-Year Bonds (44,056 contracts) and the Ultra Treasury Bonds (4,382 contracts) also having positive weeks.
The bond markets with declines in speculator bets for the week were the 2-Year Bonds (-128,603 contracts), the 5-Year Bonds (-67,934 contracts), the Fed Funds (-78,674 contracts), the US Treasury Bonds (-5,437 contracts) and with the 10-Year Bonds (-3,263 contracts) also registering lower bets on the week.
Free Reports:
 Get our Weekly Commitment of Traders Reports - See where the biggest traders (Hedge Funds and Commercial Hedgers) are positioned in the futures markets on a weekly basis.
 Sign Up for Our Stock Market Newsletter – Get updated on News, Charts & Rankings of Public Companies when you join our Stocks Newsletter
Overall in the bond market standings, speculator net positions continue to be bearish for all the bond markets we cover ranging from a small bearish position in the long US Treasury Bond (-13,604 contracts) to large bearish levels in the 2-Year Bonds (-1,347,602 contracts) and even larger bearish levels for the 5-Year Bonds (-2,158,980 contracts).
Bond Market Price Performances were led by the long US Treasury Bond
The bond market prices were mixed this week and were led by the US Treasury bond which was the highest mover on the week with a 0.47% increase. The 10-Year Note was also marginally higher by 0.14% while the 1-Month SOFR was up by 0.03% and followed by the 3-Month SOFR which saw an uptick of 0.02%.
On the downside, the 5-Year Bond fell by -0.03% while the Fed Funds was down by -0.04% and the 2-Year Bond was marginally lower by -0.16%.
Bonds Data:
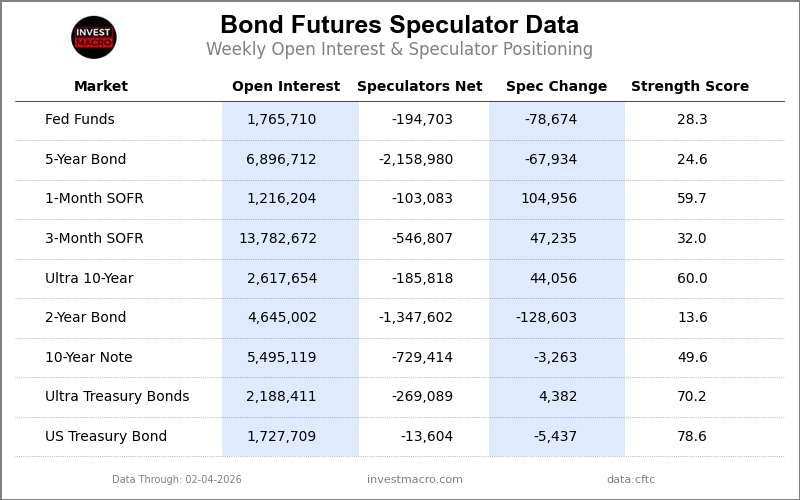
Legend: Open Interest | Speculators Current Net Position | Weekly Specs Change | Specs Strength Score compared to last 3-Years (0-100 range)
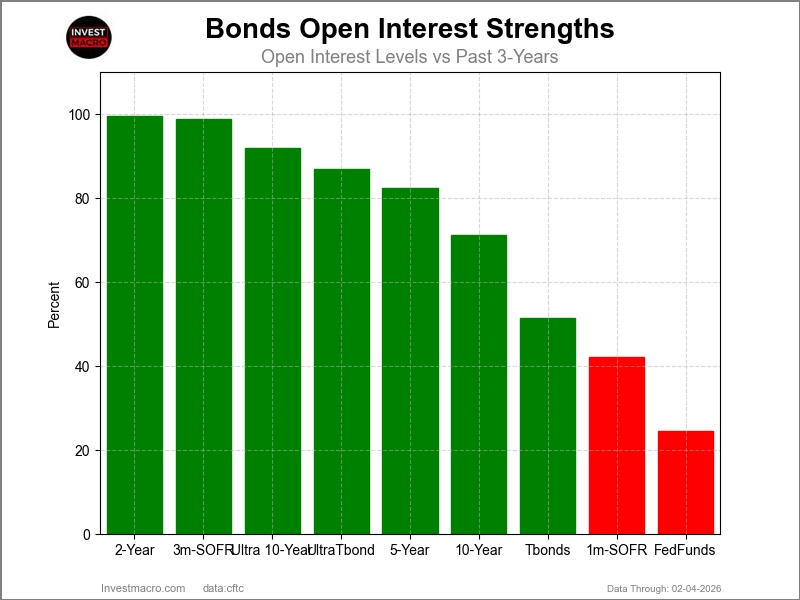
Strength Scores led by US Treasury Bonds & Ultra Treasury Bonds
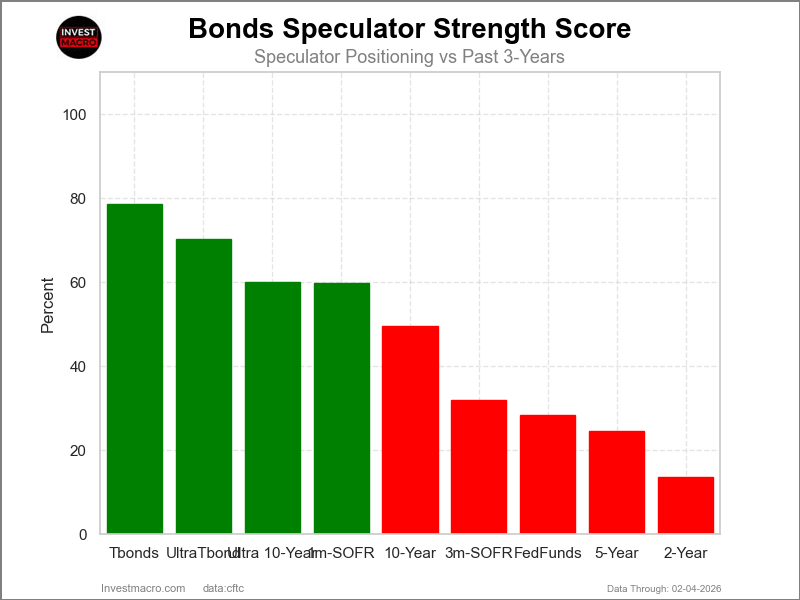
COT Strength Scores (a normalized measure of Speculator positions over a 3-Year range, from 0 to 100 where above 80 is Extreme-Bullish and below 20 is Extreme-Bearish) showed that the US Treasury Bonds (79 percent) and the Ultra Treasury Bonds (70 percent) lead the bond markets this week. The Ultra 10-Year Bonds (60 percent) comes in as the next highest in the weekly strength scores.
On the downside, the 2-Year Bond (14 percent) come in at the lowest strength level currently and is in Extreme-Bearish territory (below 20 percent). The next lowest strength scores were the 5-Year Bonds (25 percent) and the Fed Funds (28 percent).
Strength Statistics:
Fed Funds (28.3 percent) vs Fed Funds previous week (39.4 percent)
2-Year Bond (13.6 percent) vs 2-Year Bond previous week (26.2 percent)
5-Year Bond (24.6 percent) vs 5-Year Bond previous week (27.8 percent)
10-Year Bond (49.6 percent) vs 10-Year Bond previous week (50.0 percent)
Ultra 10-Year Bond (60.0 percent) vs Ultra 10-Year Bond previous week (48.1 percent)
US Treasury Bond (78.6 percent) vs US Treasury Bond previous week (80.5 percent)
Ultra US Treasury Bond (70.2 percent) vs Ultra US Treasury Bond previous week (68.6 percent)
SOFR 1-Month (59.7 percent) vs SOFR 1-Month previous week (41.4 percent)
SOFR 3-Months (32.0 percent) vs SOFR 3-Months previous week (29.6 percent)
SOFR 1-Month & Ultra 10-Year Bonds top the 6-Week Strength Trends
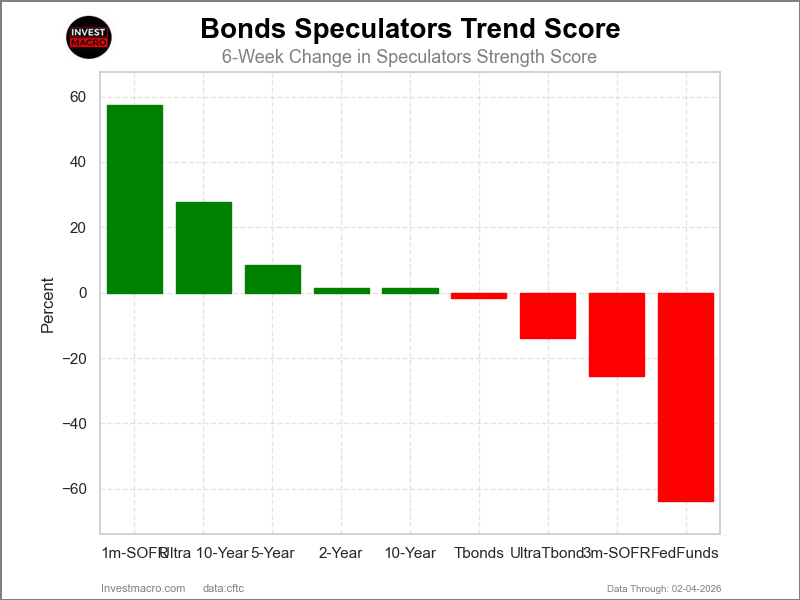
COT Strength Score Trends (or move index, calculates the 6-week changes in strength scores) showed that the SOFR 1-Month (58 percent) and the Ultra 10-Year Bonds (28 percent) lead the past six weeks trends for bonds. The 5-Year Bonds (9 percent) are the next highest positive movers in the latest trends data.
The Fed Funds (-64 percent) leads the downside trend scores currently with the the SOFR 3-Months (-26 percent) following next with lower trend scores.
Strength Trend Statistics:
Fed Funds (-63.8 percent) vs Fed Funds previous week (-55.1 percent)
2-Year Bond (1.5 percent) vs 2-Year Bond previous week (12.9 percent)
5-Year Bond (8.5 percent) vs 5-Year Bond previous week (9.7 percent)
10-Year Bond (1.5 percent) vs 10-Year Bond previous week (-6.7 percent)
Ultra 10-Year Bond (27.8 percent) vs Ultra 10-Year Bond previous week (17.0 percent)
US Treasury Bond (-1.7 percent) vs US Treasury Bond previous week (13.4 percent)
Ultra US Treasury Bond (-13.9 percent) vs Ultra US Treasury Bond previous week (-8.7 percent)
SOFR 1-Month (57.5 percent) vs SOFR 1-Month previous week (41.4 percent)
SOFR 3-Months (-25.5 percent) vs SOFR 3-Months previous week (-21.7 percent)
30-Day Federal Funds Futures:
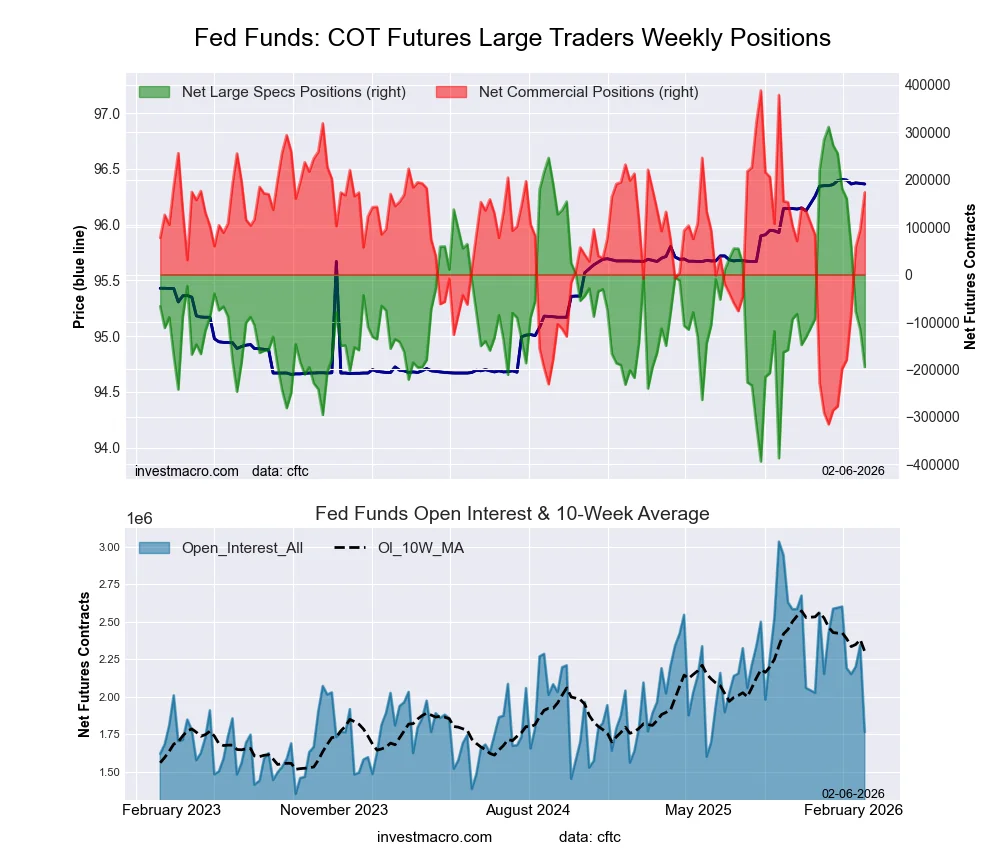 The 30-Day Federal Funds large speculator standing this week came in at a net position of -194,703 contracts in the data reported through Tuesday. This was a weekly fall of -78,674 contracts from the previous week which had a total of -116,029 net contracts.
This week’s current strength score (the trader positioning range over the past three years, measured from 0 to 100) shows the speculators are currently Bearish with a score of 28.3 percent. The commercials are Bullish with a score of 69.5 percent and the small traders (not shown in chart) are Bullish-Extreme with a score of 90.4 percent.
Price Trend-Following Model: Uptrend
Our weekly trend-following model classifies the current market price position as: Uptrend.
| 30-Day Federal Funds Statistics | SPECULATORS | COMMERCIALS | SMALL TRADERS |
| – Percent of Open Interest Longs: | 10.3 | 65.8 | 2.7 |
| – Percent of Open Interest Shorts: | 21.3 | 56.0 | 1.5 |
| – Net Position: | -194,703 | 173,303 | 21,400 |
| – Gross Longs: | 181,635 | 1,162,282 | 47,582 |
| – Gross Shorts: | 376,338 | 988,979 | 26,182 |
| – Long to Short Ratio: | 0.5 to 1 | 1.2 to 1 | 1.8 to 1 |
| NET POSITION TREND: | |||
| – Strength Index Score (3 Year Range Pct): | 28.3 | 69.5 | 90.4 |
| – Strength Index Reading (3 Year Range): | Bearish | Bullish | Bullish-Extreme |
| NET POSITION MOVEMENT INDEX: | |||
| – 6-Week Change in Strength Index: | -63.8 | 64.1 | -1.4 |
Secured Overnight Financing Rate (3-Month) Futures:
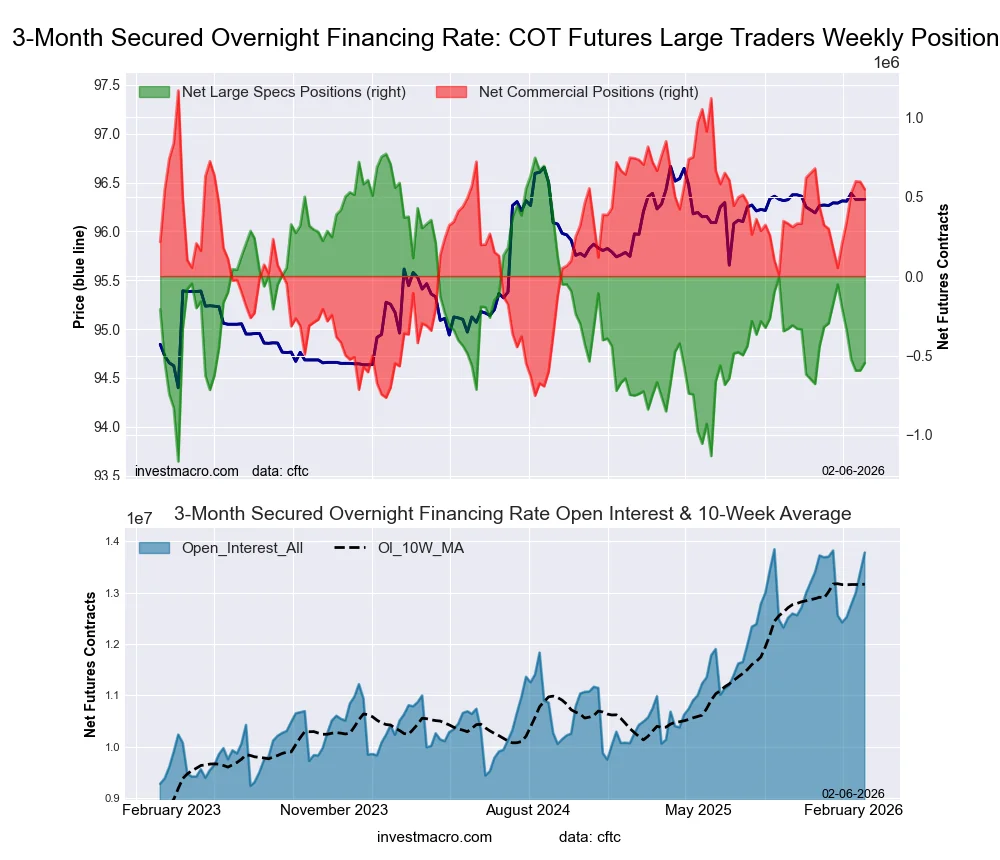 The Secured Overnight Financing Rate (3-Month) large speculator standing this week came in at a net position of -546,807 contracts in the data reported through Tuesday. This was a weekly gain of 47,235 contracts from the previous week which had a total of -594,042 net contracts.
This week’s current strength score (the trader positioning range over the past three years, measured from 0 to 100) shows the speculators are currently Bearish with a score of 32.0 percent. The commercials are Bullish with a score of 67.9 percent and the small traders (not shown in chart) are Bullish with a score of 78.4 percent.
Price Trend-Following Model: Weak Uptrend
Our weekly trend-following model classifies the current market price position as: Weak Uptrend.
| SOFR 3-Months Statistics | SPECULATORS | COMMERCIALS | SMALL TRADERS |
| – Percent of Open Interest Longs: | 11.7 | 58.2 | 0.3 |
| – Percent of Open Interest Shorts: | 15.7 | 54.2 | 0.3 |
| – Net Position: | -546,807 | 546,500 | 307 |
| – Gross Longs: | 1,616,585 | 8,021,109 | 40,586 |
| – Gross Shorts: | 2,163,392 | 7,474,609 | 40,279 |
| – Long to Short Ratio: | 0.7 to 1 | 1.1 to 1 | 1.0 to 1 |
| NET POSITION TREND: | |||
| – Strength Index Score (3 Year Range Pct): | 32.0 | 67.9 | 78.4 |
| – Strength Index Reading (3 Year Range): | Bearish | Bullish | Bullish |
| NET POSITION MOVEMENT INDEX: | |||
| – 6-Week Change in Strength Index: | -25.5 | 25.6 | -0.2 |
Individual Bond Markets:
Secured Overnight Financing Rate (1-Month) Futures:
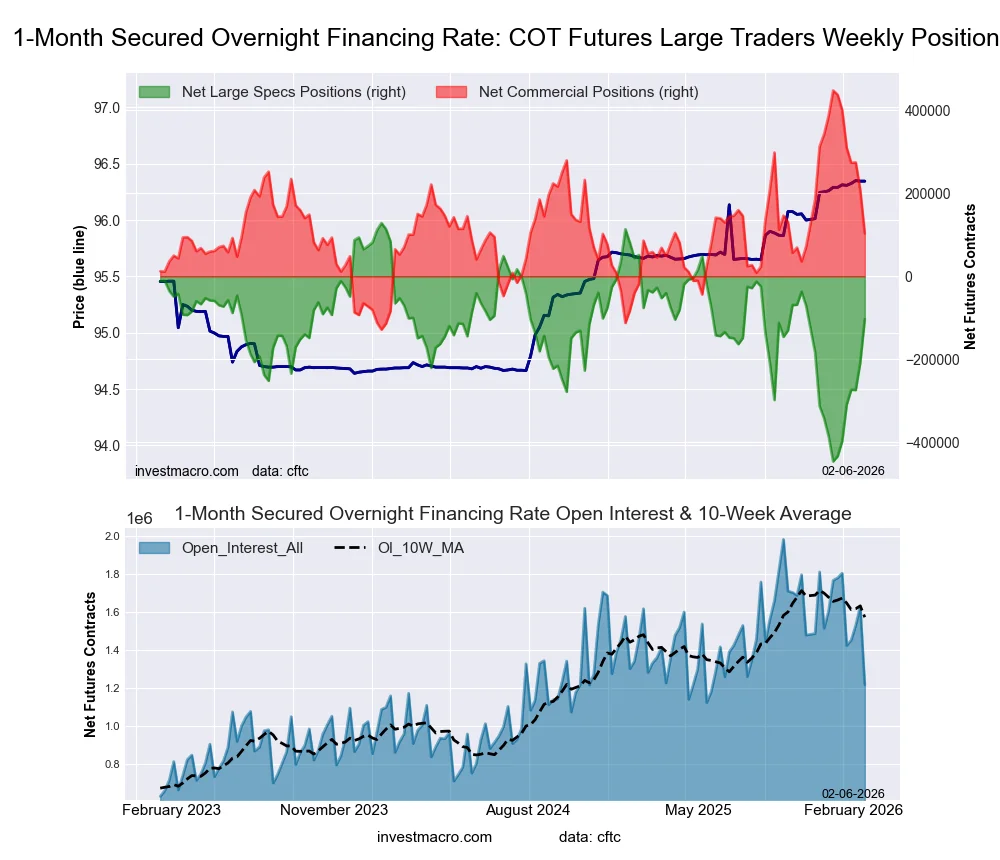 The Secured Overnight Financing Rate (1-Month) large speculator standing this week came in at a net position of -103,083 contracts in the data reported through Tuesday. This was a weekly gain of 104,956 contracts from the previous week which had a total of -208,039 net contracts.
This week’s current strength score (the trader positioning range over the past three years, measured from 0 to 100) shows the speculators are currently Bullish with a score of 59.7 percent. The commercials are Bearish with a score of 40.3 percent and the small traders (not shown in chart) are Bullish with a score of 66.6 percent.
Price Trend-Following Model: Uptrend
Our weekly trend-following model classifies the current market price position as: Uptrend.
| SOFR 1-Month Statistics | SPECULATORS | COMMERCIALS | SMALL TRADERS |
| – Percent of Open Interest Longs: | 18.6 | 64.0 | 0.0 |
| – Percent of Open Interest Shorts: | 27.1 | 55.5 | 0.0 |
| – Net Position: | -103,083 | 103,205 | -122 |
| – Gross Longs: | 226,426 | 778,656 | 120 |
| – Gross Shorts: | 329,509 | 675,451 | 242 |
| – Long to Short Ratio: | 0.7 to 1 | 1.2 to 1 | 0.5 to 1 |
| NET POSITION TREND: | |||
| – Strength Index Score (3 Year Range Pct): | 59.7 | 40.3 | 66.6 |
| – Strength Index Reading (3 Year Range): | Bullish | Bearish | Bullish |
| NET POSITION MOVEMENT INDEX: | |||
| – 6-Week Change in Strength Index: | 57.5 | -57.9 | 6.9 |
2-Year Treasury Note Futures:
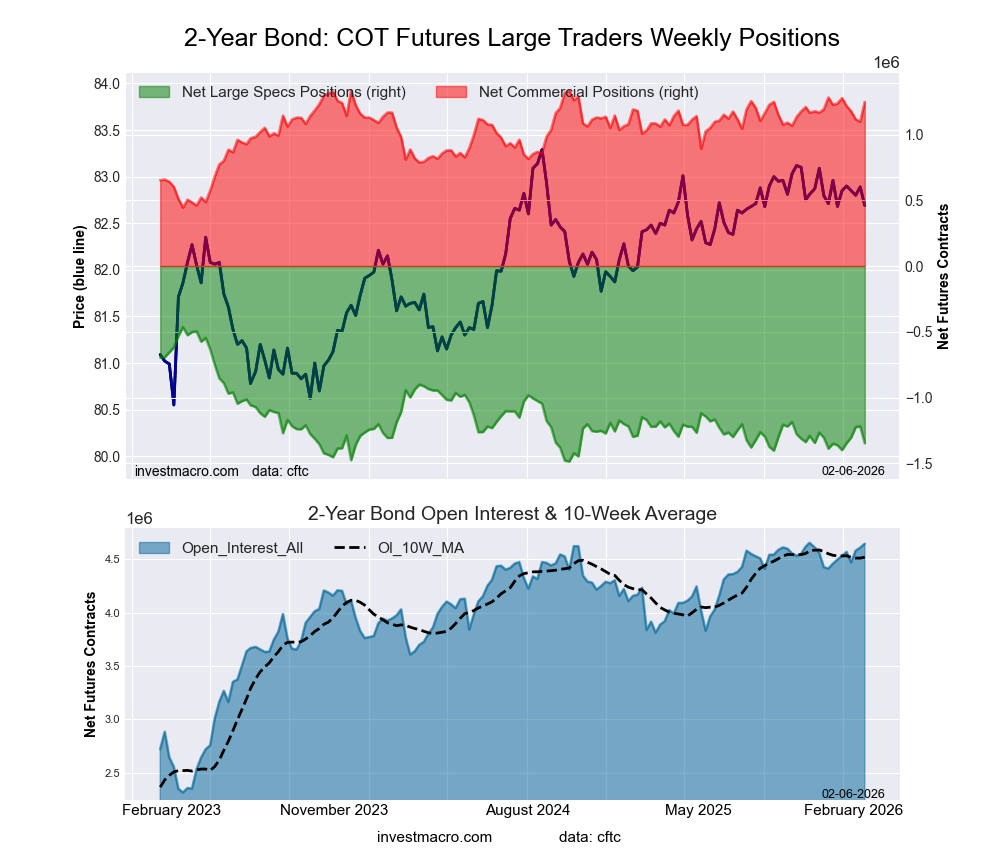 The 2-Year Treasury Note large speculator standing this week came in at a net position of -1,347,602 contracts in the data reported through Tuesday. This was a weekly lowering of -128,603 contracts from the previous week which had a total of -1,218,999 net contracts.
This week’s current strength score (the trader positioning range over the past three years, measured from 0 to 100) shows the speculators are currently Bearish-Extreme with a score of 13.6 percent. The commercials are Bullish-Extreme with a score of 90.2 percent and the small traders (not shown in chart) are Bearish with a score of 39.4 percent.
Price Trend-Following Model: Downtrend
Our weekly trend-following model classifies the current market price position as: Downtrend.
| 2-Year Treasury Note Statistics | SPECULATORS | COMMERCIALS | SMALL TRADERS |
| – Percent of Open Interest Longs: | 16.3 | 75.3 | 5.1 |
| – Percent of Open Interest Shorts: | 45.3 | 48.4 | 2.9 |
| – Net Position: | -1,347,602 | 1,247,780 | 99,822 |
| – Gross Longs: | 755,987 | 3,495,535 | 234,959 |
| – Gross Shorts: | 2,103,589 | 2,247,755 | 135,137 |
| – Long to Short Ratio: | 0.4 to 1 | 1.6 to 1 | 1.7 to 1 |
| NET POSITION TREND: | |||
| – Strength Index Score (3 Year Range Pct): | 13.6 | 90.2 | 39.4 |
| – Strength Index Reading (3 Year Range): | Bearish-Extreme | Bullish-Extreme | Bearish |
| NET POSITION MOVEMENT INDEX: | |||
| – 6-Week Change in Strength Index: | 1.5 | 1.2 | -12.0 |
5-Year Treasury Note Futures:
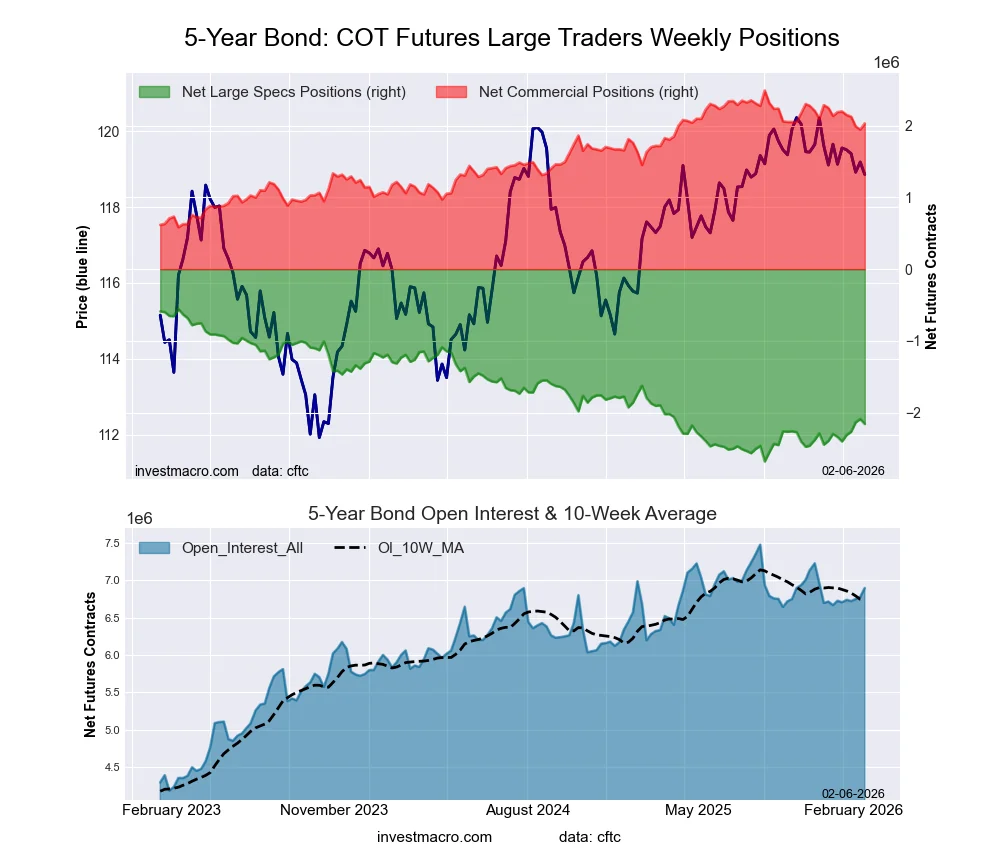 The 5-Year Treasury Note large speculator standing this week came in at a net position of -2,158,980 contracts in the data reported through Tuesday. This was a weekly decrease of -67,934 contracts from the previous week which had a total of -2,091,046 net contracts.
This week’s current strength score (the trader positioning range over the past three years, measured from 0 to 100) shows the speculators are currently Bearish with a score of 24.6 percent. The commercials are Bullish with a score of 75.9 percent and the small traders (not shown in chart) are Bullish with a score of 62.6 percent.
Price Trend-Following Model: Downtrend
Our weekly trend-following model classifies the current market price position as: Downtrend.
| 5-Year Treasury Note Statistics | SPECULATORS | COMMERCIALS | SMALL TRADERS |
| – Percent of Open Interest Longs: | 7.9 | 82.6 | 6.4 |
| – Percent of Open Interest Shorts: | 39.2 | 53.1 | 4.5 |
| – Net Position: | -2,158,980 | 2,030,958 | 128,022 |
| – Gross Longs: | 543,500 | 5,693,498 | 440,462 |
| – Gross Shorts: | 2,702,480 | 3,662,540 | 312,440 |
| – Long to Short Ratio: | 0.2 to 1 | 1.6 to 1 | 1.4 to 1 |
| NET POSITION TREND: | |||
| – Strength Index Score (3 Year Range Pct): | 24.6 | 75.9 | 62.6 |
| – Strength Index Reading (3 Year Range): | Bearish | Bullish | Bullish |
| NET POSITION MOVEMENT INDEX: | |||
| – 6-Week Change in Strength Index: | 8.5 | -8.3 | -7.0 |
10-Year Treasury Note Futures:
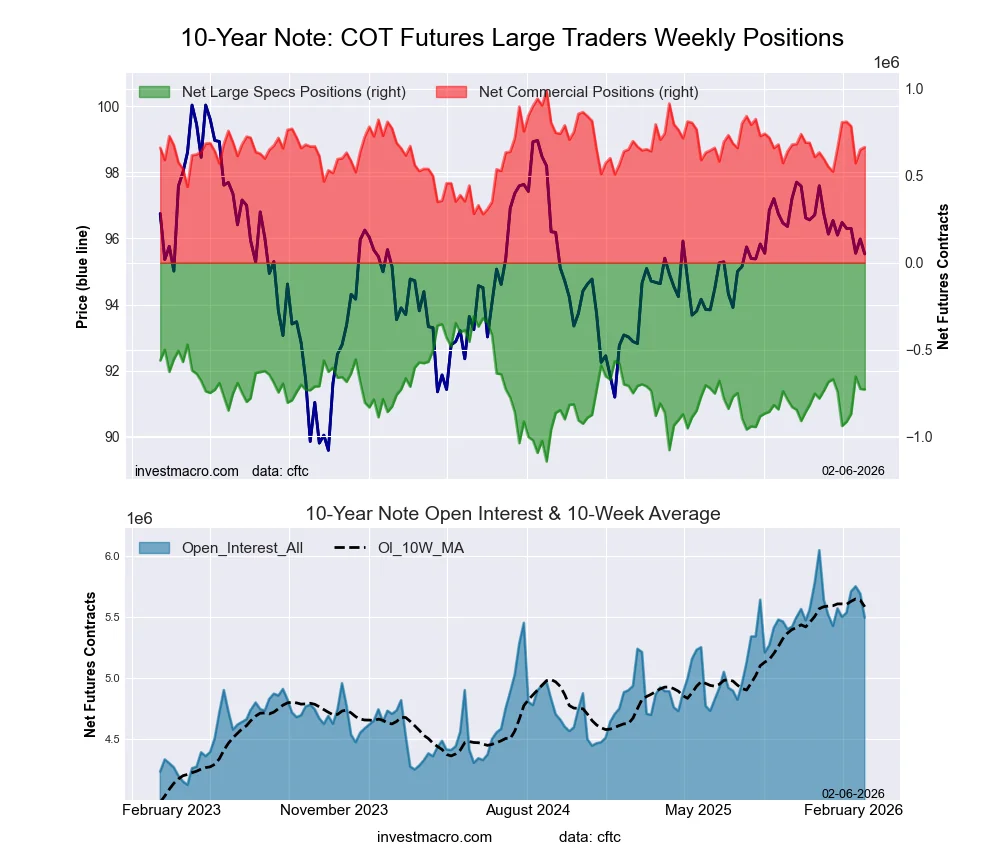 The 10-Year Treasury Note large speculator standing this week came in at a net position of -729,414 contracts in the data reported through Tuesday. This was a weekly lowering of -3,263 contracts from the previous week which had a total of -726,151 net contracts.
This week’s current strength score (the trader positioning range over the past three years, measured from 0 to 100) shows the speculators are currently Bearish with a score of 49.6 percent. The commercials are Bullish with a score of 54.2 percent and the small traders (not shown in chart) are Bullish with a score of 61.6 percent.
Price Trend-Following Model: Strong Downtrend
Our weekly trend-following model classifies the current market price position as: Strong Downtrend.
| 10-Year Treasury Note Statistics | SPECULATORS | COMMERCIALS | SMALL TRADERS |
| – Percent of Open Interest Longs: | 12.7 | 75.7 | 7.7 |
| – Percent of Open Interest Shorts: | 26.0 | 63.6 | 6.5 |
| – Net Position: | -729,414 | 664,990 | 64,424 |
| – Gross Longs: | 698,068 | 4,160,322 | 423,256 |
| – Gross Shorts: | 1,427,482 | 3,495,332 | 358,832 |
| – Long to Short Ratio: | 0.5 to 1 | 1.2 to 1 | 1.2 to 1 |
| NET POSITION TREND: | |||
| – Strength Index Score (3 Year Range Pct): | 49.6 | 54.2 | 61.6 |
| – Strength Index Reading (3 Year Range): | Bearish | Bullish | Bullish |
| NET POSITION MOVEMENT INDEX: | |||
| – 6-Week Change in Strength Index: | 1.5 | 0.9 | -6.5 |
Ultra 10-Year Notes Futures:
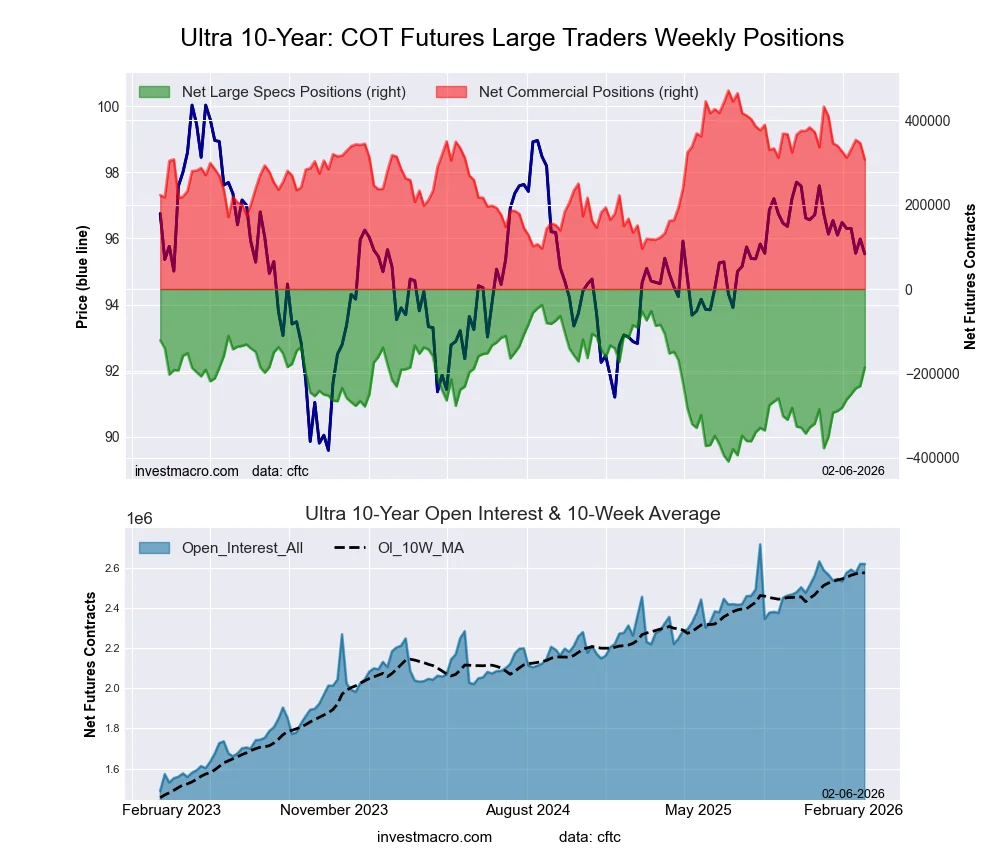 The Ultra 10-Year Notes large speculator standing this week came in at a net position of -185,818 contracts in the data reported through Tuesday. This was a weekly rise of 44,056 contracts from the previous week which had a total of -229,874 net contracts.
This week’s current strength score (the trader positioning range over the past three years, measured from 0 to 100) shows the speculators are currently Bullish with a score of 60.0 percent. The commercials are Bullish with a score of 56.3 percent and the small traders (not shown in chart) are Bearish-Extreme with a score of 0.0 percent.
Price Trend-Following Model: Strong Downtrend
Our weekly trend-following model classifies the current market price position as: Strong Downtrend.
| Ultra 10-Year Notes Statistics | SPECULATORS | COMMERCIALS | SMALL TRADERS |
| – Percent of Open Interest Longs: | 11.1 | 78.9 | 7.9 |
| – Percent of Open Interest Shorts: | 18.2 | 67.2 | 12.5 |
| – Net Position: | -185,818 | 306,416 | -120,598 |
| – Gross Longs: | 291,036 | 2,065,570 | 207,872 |
| – Gross Shorts: | 476,854 | 1,759,154 | 328,470 |
| – Long to Short Ratio: | 0.6 to 1 | 1.2 to 1 | 0.6 to 1 |
| NET POSITION TREND: | |||
| – Strength Index Score (3 Year Range Pct): | 60.0 | 56.3 | 0.0 |
| – Strength Index Reading (3 Year Range): | Bullish | Bullish | Bearish-Extreme |
| NET POSITION MOVEMENT INDEX: | |||
| – 6-Week Change in Strength Index: | 27.8 | -8.7 | -63.0 |
US Treasury Bonds Futures:
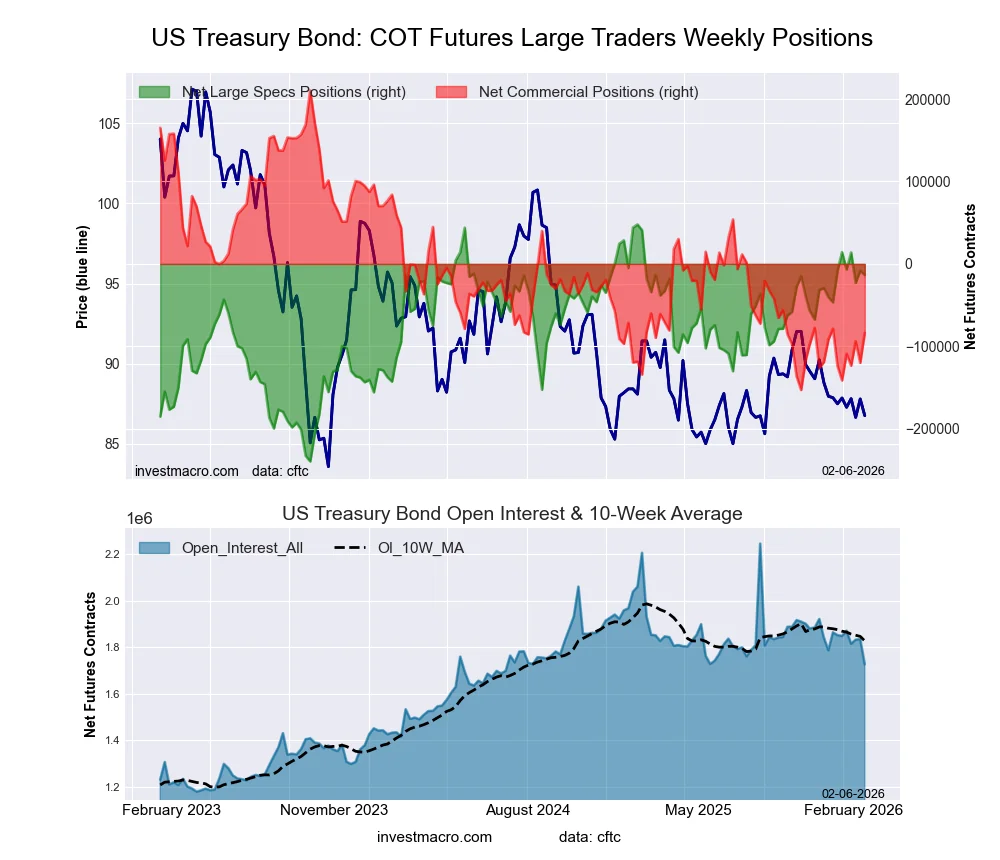 The US Treasury Bonds large speculator standing this week came in at a net position of -13,604 contracts in the data reported through Tuesday. This was a weekly decline of -5,437 contracts from the previous week which had a total of -8,167 net contracts.
This week’s current strength score (the trader positioning range over the past three years, measured from 0 to 100) shows the speculators are currently Bullish with a score of 78.6 percent. The commercials are Bearish-Extreme with a score of 19.1 percent and the small traders (not shown in chart) are Bullish with a score of 53.7 percent.
Price Trend-Following Model: Downtrend
Our weekly trend-following model classifies the current market price position as: Downtrend.
| US Treasury Bonds Statistics | SPECULATORS | COMMERCIALS | SMALL TRADERS |
| – Percent of Open Interest Longs: | 10.0 | 74.4 | 13.8 |
| – Percent of Open Interest Shorts: | 10.8 | 79.2 | 8.1 |
| – Net Position: | -13,604 | -83,622 | 97,226 |
| – Gross Longs: | 173,194 | 1,285,239 | 237,672 |
| – Gross Shorts: | 186,798 | 1,368,861 | 140,446 |
| – Long to Short Ratio: | 0.9 to 1 | 0.9 to 1 | 1.7 to 1 |
| NET POSITION TREND: | |||
| – Strength Index Score (3 Year Range Pct): | 78.6 | 19.1 | 53.7 |
| – Strength Index Reading (3 Year Range): | Bullish | Bearish-Extreme | Bullish |
| NET POSITION MOVEMENT INDEX: | |||
| – 6-Week Change in Strength Index: | -1.7 | 11.1 | -23.1 |
Ultra US Treasury Bonds Futures:
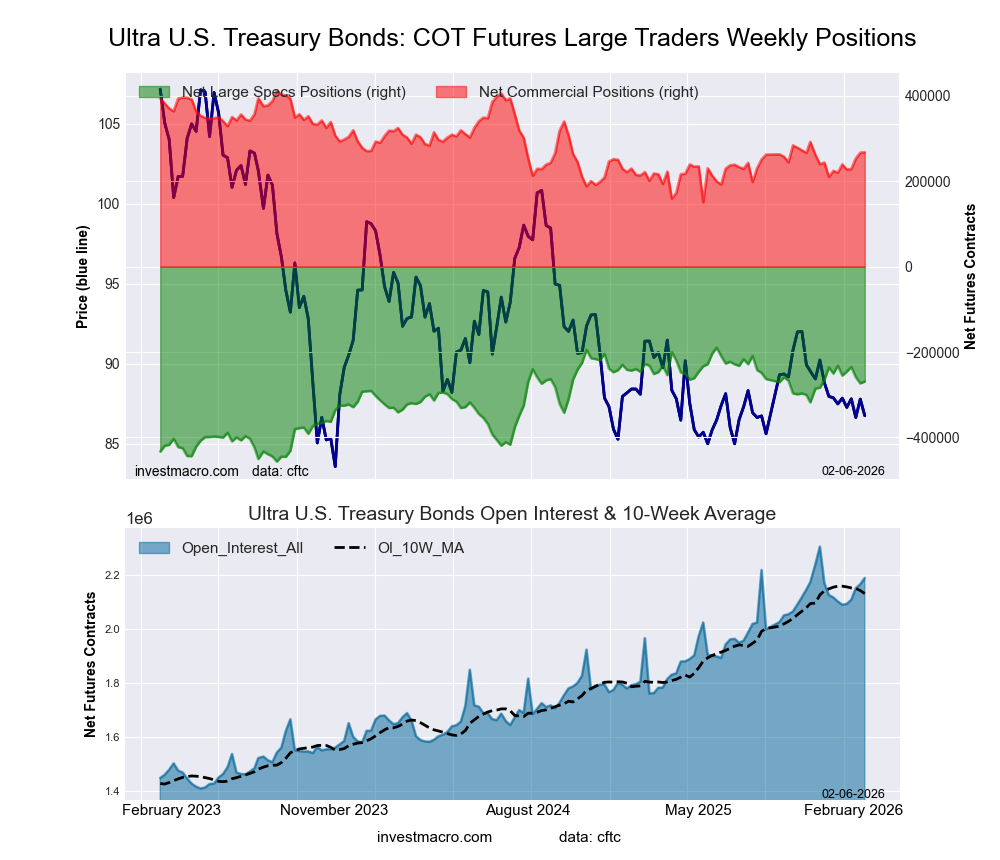 The Ultra US Treasury Bonds large speculator standing this week came in at a net position of -269,089 contracts in the data reported through Tuesday. This was a weekly boost of 4,382 contracts from the previous week which had a total of -273,471 net contracts.
This week’s current strength score (the trader positioning range over the past three years, measured from 0 to 100) shows the speculators are currently Bullish with a score of 70.2 percent. The commercials are Bearish with a score of 44.8 percent and the small traders (not shown in chart) are Bearish-Extreme with a score of 16.2 percent.
Price Trend-Following Model: Downtrend
Our weekly trend-following model classifies the current market price position as: Downtrend.
| Ultra US Treasury Bonds Statistics | SPECULATORS | COMMERCIALS | SMALL TRADERS |
| – Percent of Open Interest Longs: | 6.8 | 83.6 | 8.7 |
| – Percent of Open Interest Shorts: | 19.1 | 71.3 | 8.7 |
| – Net Position: | -269,089 | 268,015 | 1,074 |
| – Gross Longs: | 149,389 | 1,828,456 | 191,098 |
| – Gross Shorts: | 418,478 | 1,560,441 | 190,024 |
| – Long to Short Ratio: | 0.4 to 1 | 1.2 to 1 | 1.0 to 1 |
| NET POSITION TREND: | |||
| – Strength Index Score (3 Year Range Pct): | 70.2 | 44.8 | 16.2 |
| – Strength Index Reading (3 Year Range): | Bullish | Bearish | Bearish-Extreme |
| NET POSITION MOVEMENT INDEX: | |||
| – 6-Week Change in Strength Index: | -13.9 | 18.3 | -11.1 |
Article By InvestMacro – Receive our weekly COT Newsletter
*COT Report: The COT data, released weekly to the public each Friday, is updated through the most recent Tuesday (data is 3 days old) and shows a quick view of how large speculators or non-commercials (for-profit traders) were positioned in the futures markets.
The CFTC categorizes trader positions according to commercial hedgers (traders who use futures contracts for hedging as part of the business), non-commercials (large traders who speculate to realize trading profits) and nonreportable traders (usually small traders/speculators) as well as their open interest (contracts open in the market at time of reporting). See CFTC criteria here.

- RoboForex Brings Full-Scale Trading to Telegram Jul 7, 2026
- Your Bourse Integrates TradingView Charts and Trading Platform Library with Trade Server Jul 7, 2026
- Yen Still Under Pressure: Markets Await Action from Authorities Jul 7, 2026
- Germany’s DAX Index has updated its all‑time high. OPEC+ countries have agreed to increase production Jul 7, 2026
- Oil prices have stabilized. The Canadian dollar continues to trade near yearly lows. Jul 6, 2026
- EUR/USD in a Narrow Range: Focus on Fed Minutes Jul 6, 2026
- Oil prices have fallen to pre‑war levels. AI companies continue to sell off Jul 3, 2026
- Gold Rises Sharply as Markets Reassess Fed Rate Outlook Jul 3, 2026
- The Eurozone has shown a significant slowdown in inflation. Australia has recorded its largest trade deficit since 2015 Jul 2, 2026
- Natural gas prices are rising amid increasing electricity consumption Jul 1, 2026