
By InvestMacro
The latest update for the weekly Commitment of Traders (COT) report was released by the Commodity Futures Trading Commission (CFTC) on Friday for data ending on August 5th.
This weekly Extreme Positions report highlights the Most Bullish and Most Bearish Positions for the speculator category. Extreme positioning in these markets can foreshadow strong moves in the underlying market.
To signify an extreme position, we use the Strength Index (also known as the COT Index) of each instrument, a common method of measuring COT data. The Strength Index is simply a comparison of current trader positions against the range of positions over the previous 3 years. We use over 80 percent as extremely bullish and under 20 percent as extremely bearish. (Compare Strength Index scores across all markets in the data table or cot leaders table)
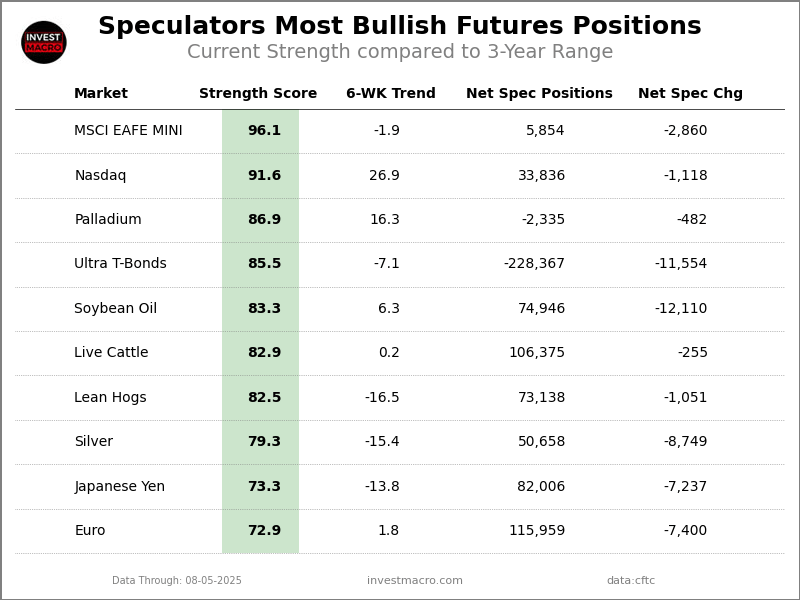
Here Are This Week’s Most Bullish Speculator Positions:
MSCI EAFE MINI
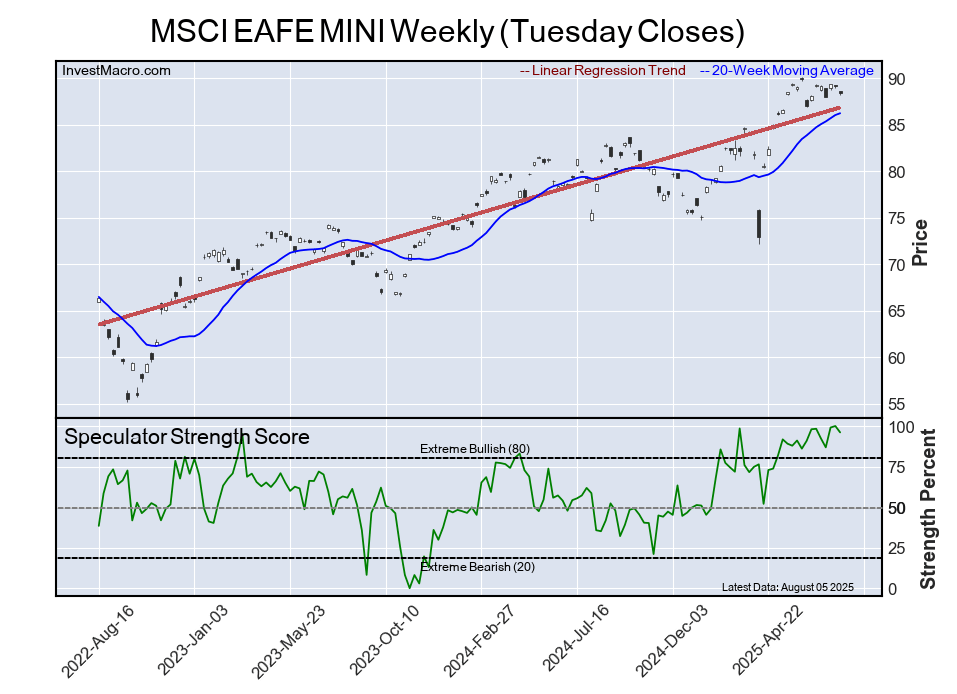
The MSCI EAFE MINI speculator position comes in at the top of the most extreme standings this week as the MSCI EAFE-Mini speculator level is at a 96 percent score of its 3-year range.
Free Reports:
 Get our Weekly Commitment of Traders Reports - See where the biggest traders (Hedge Funds and Commercial Hedgers) are positioned in the futures markets on a weekly basis.
 Sign Up for Our Stock Market Newsletter – Get updated on News, Charts & Rankings of Public Companies when you join our Stocks Newsletter
The six-week trend for the percent strength score was a dip by -2 percentage points this week. The speculator position registered 5,854 net contracts this week with a weekly decline of -2,860 contracts in speculator bets.
Speculators or Non-Commercials Notes:
Speculators, classified as non-commercial traders by the CFTC, are made up of large commodity funds, hedge funds and other significant for-profit participants. The Specs are generally regarded as trend-followers in their behavior towards price action – net speculator bets and prices tend to go in the same directions. These traders often look to buy when prices are rising and sell when prices are falling. To illustrate this point, many times speculator contracts can be found at their most extremes (bullish or bearish) when prices are also close to their highest or lowest levels.
These extreme levels can be dangerous for the large speculators as the trade is most crowded, there is less trading ammunition still sitting on the sidelines to push the trend further and prices have moved a significant distance. When the trend becomes exhausted, some speculators take profits while others look to also exit positions when prices fail to continue in the same direction. This process usually plays out over many months to years and can ultimately create a reverse effect where prices start to fall and speculators start a process of selling when prices are falling.
Nasdaq
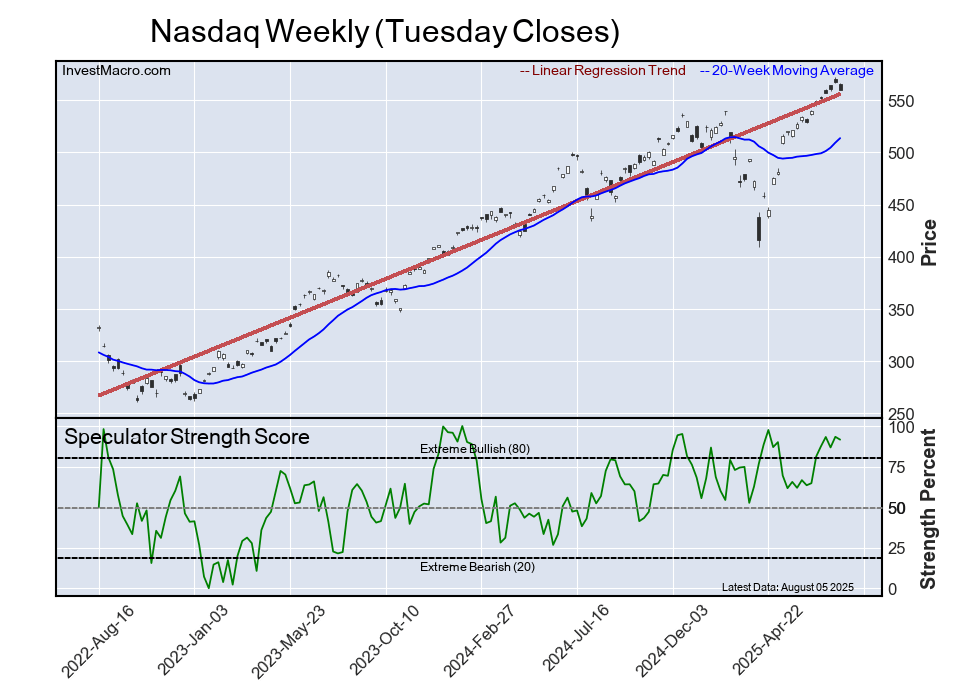
The Nasdaq speculator position comes in next this week in the extreme standings. The Nasdaq-Mini speculator level resides at a 92 percent score of its 3-year range.
The six-week trend for the speculator strength score came in at a gain of 27 percentage points this week. The overall speculator position was 33,836 net contracts this week with a small decrease of -1,118 contracts in the weekly speculator bets.
Palladium
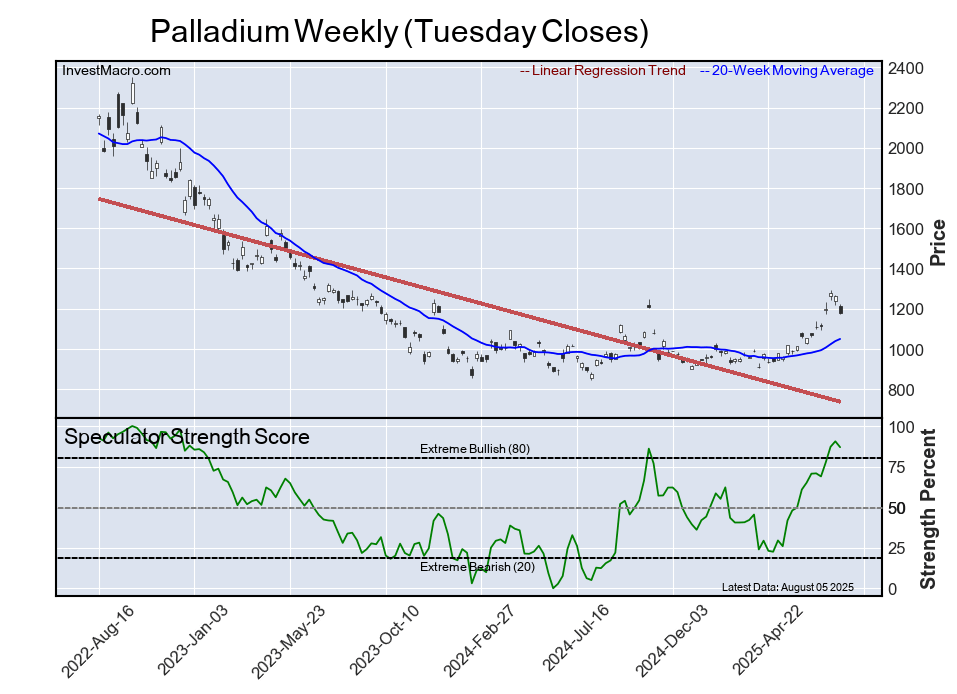
The Palladium speculator position takes the next position in the extreme standings this week with the Palladium speculator level sitting at a 87 percent score of its 3-year range.
The six-week trend for the speculator strength score totaled a rise of 16 percentage points this week. The overall speculator position was -2,335 net contracts this week with a drop of -482 contracts in the speculator bets.
Ultra U.S. Treasury Bonds
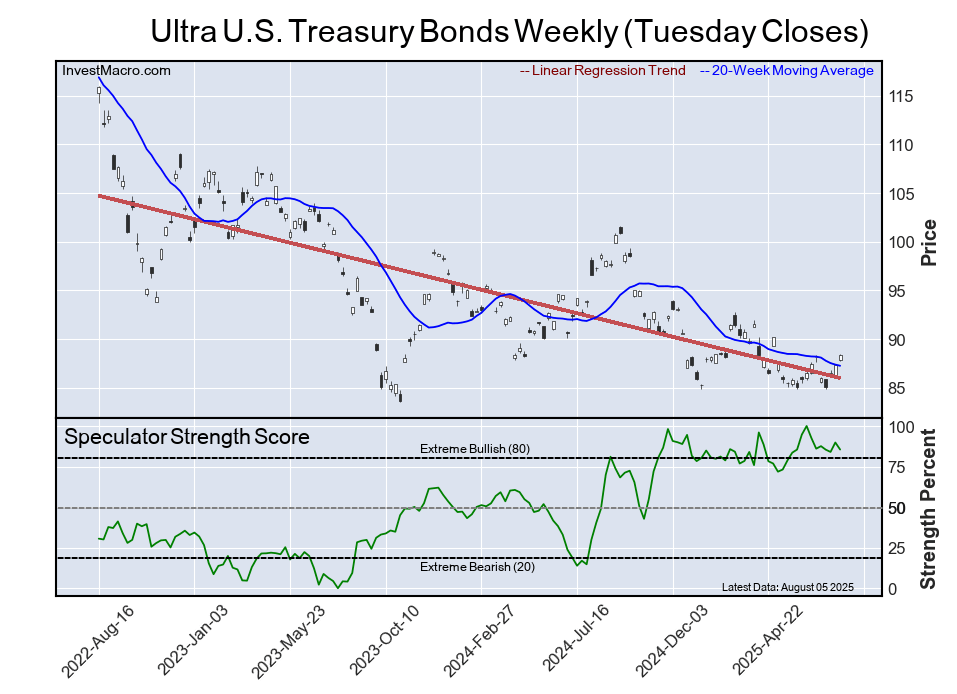
The Ultra U.S. Treasury Bonds speculator position slides in next in this week’s bullish extreme standings as the Ultra Long T-Bond speculator level sits at a 86 percent score of its 3-year range. The six-week trend for the speculator strength score was a decline of -7 percentage points this week.
The speculator position was -228,367 net contracts this week with a reduction of -11,554 contracts in the weekly speculator bets.
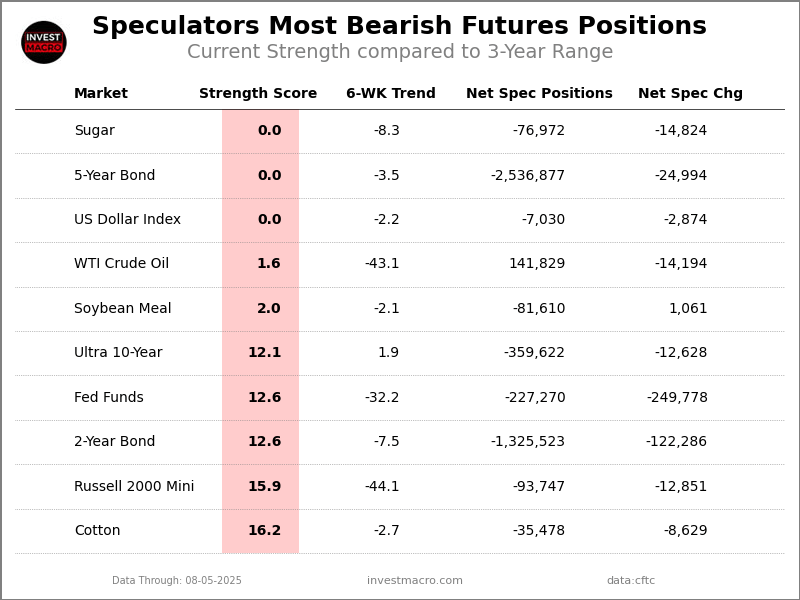
This Week’s Most Bearish Speculator Positions:
Sugar
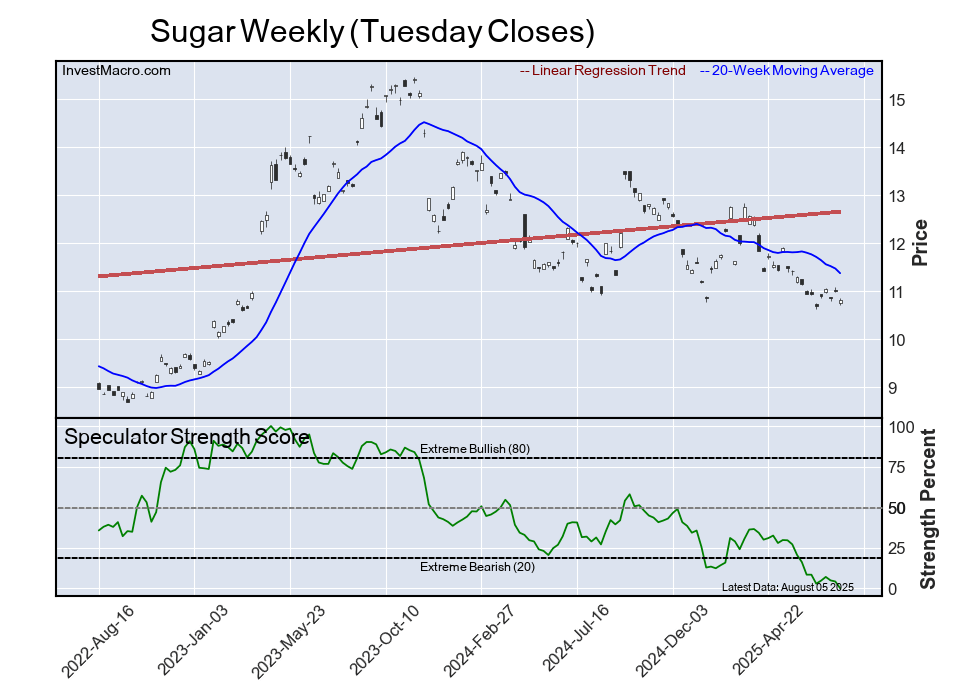
The Sugar speculator position comes in tied as the most bearish extreme standing of the week with the Sugar speculator level residing at a 0 percent score of its 3-year range.
The six-week trend for the speculator strength score was -8 percentage points this week. The overall speculator position was -76,972 net contracts this week with a reduction by -14,824 contracts in the speculator bets.
5-Year Bond
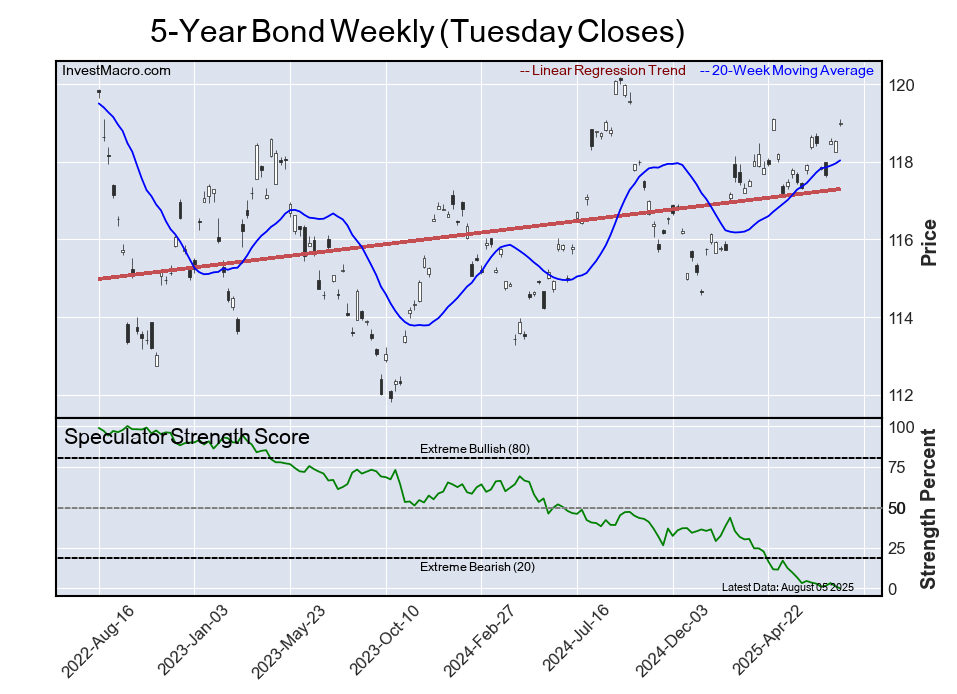
The 5-Year Bond speculator position comes in also tied as the most bearish extreme standing this week. The 5-Year speculator level is at a 0 percent score of its 3-year range.
The six-week trend for the speculator strength score was -3 percentage points this week. The overall speculator position was -2,536,877 net contracts this week with a decline of -24,994 contracts in the speculator bets.
US Dollar Index
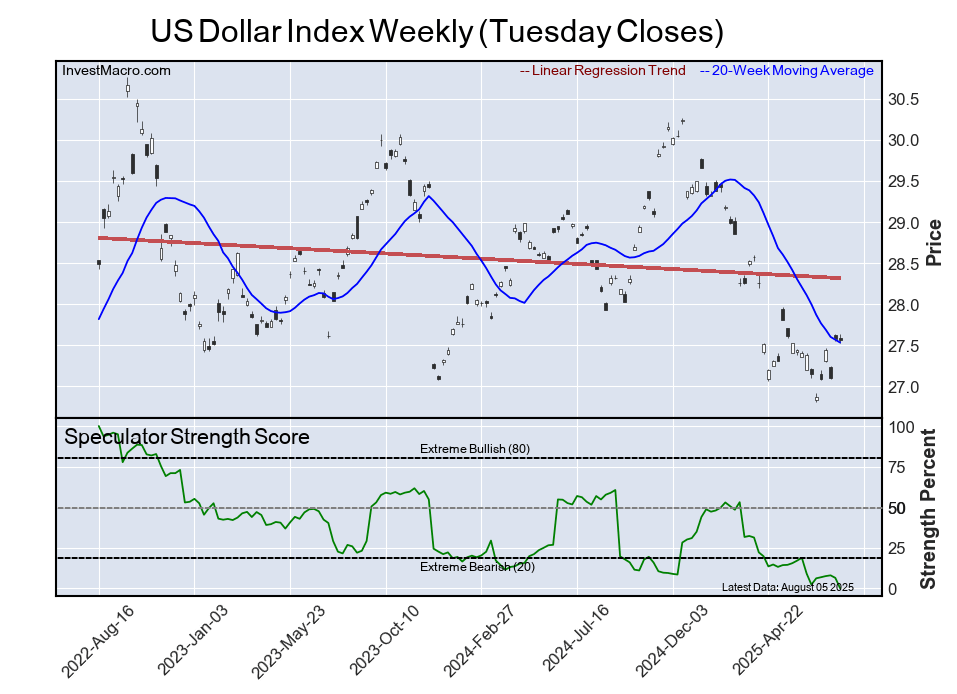
The US Dollar Index speculator position also comes in tied for the most bearish extreme standing on the week as the USD Index speculator level is at a 0 percent score of its 3-year range.
The six-week trend for the speculator strength score was a dip by -2 percentage points this week. The speculator position was -7,030 net contracts this week with a drop of -2,874 contracts in the weekly speculator bets.
WTI Crude Oil
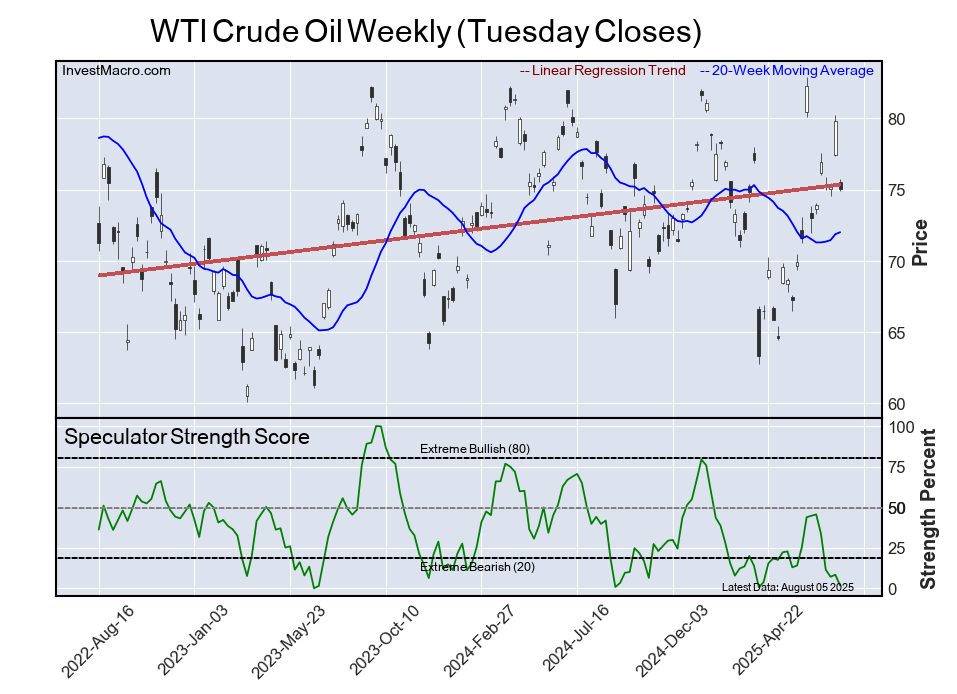
Next, the WTI Crude Oil speculator position comes in as the fourth most bearish extreme standing for this week. The WTI Crude speculator level is currently at a 2 percent score of its 3-year range.
The six-week trend for the speculator strength score was a drop by -43 percentage points this week. The speculator position was 141,829 net contracts this week with a reduction of -14,194 contracts in the weekly speculator bets.
Soybean Meal
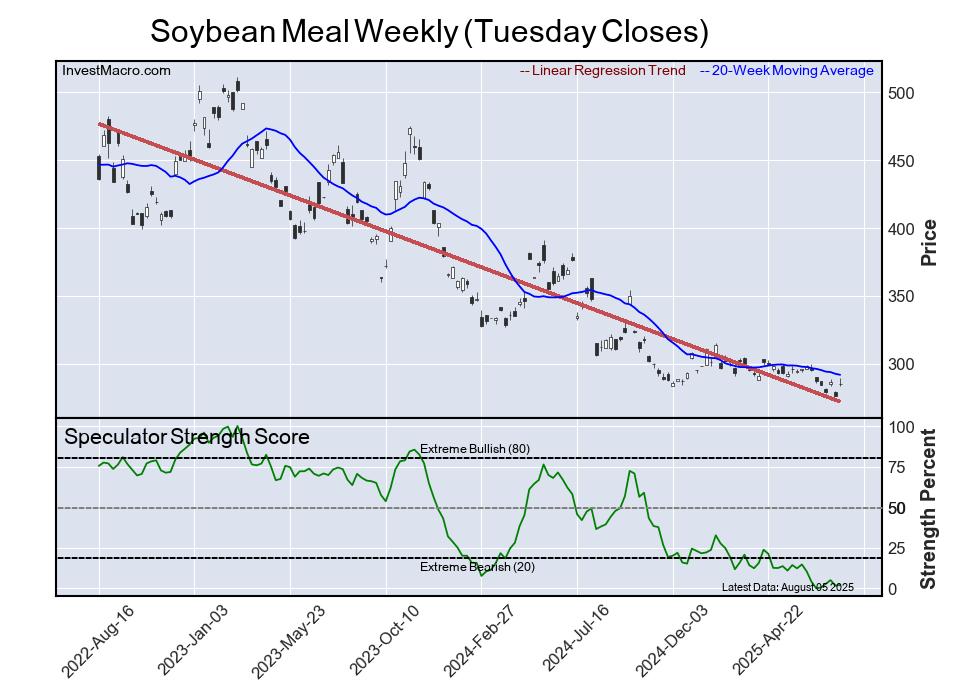
The Soybean Meal speculator position comes in as this week’s fifth most bearish extreme standing. The Soybean Meal speculator level is at a 2 percent score of its 3-year range.
The six-week trend for the speculator strength score was an edge lower by -2 percentage points this week. The speculator position was -81,610 net contracts this week with a small increase of 1,061 contracts in the weekly speculator bets.
Article By InvestMacro – Receive our weekly COT Newsletter
*COT Report: The COT data, released weekly to the public each Friday, is updated through the most recent Tuesday (data is 3 days old) and shows a quick view of how large speculators or non-commercials (for-profit traders) were positioned in the futures markets.
The CFTC categorizes trader positions according to commercial hedgers (traders who use futures contracts for hedging as part of the business), non-commercials (large traders who speculate to realize trading profits) and nonreportable traders (usually small traders/speculators) as well as their open interest (contracts open in the market at time of reporting). See CFTC criteria here.

- Bank Indonesia raised its interest rate. Norges Bank and the SNB left rates unchanged Jun 19, 2026
- EUR/USD Loses Ground as Market Sentiment Favours the US Dollar Jun 19, 2026
- GBPUSD Awaits Bank of England Meeting Near April Lows Jun 18, 2026
- Markets disliked the results of the FOMC meeting. HKMA followed the Fed and kept its rate unchanged. Jun 18, 2026
- Gold Surges 2% Since Week Opening Amid Geopolitical Shifts and Fed Expectations Jun 17, 2026
- Your Bourse and FXPRIMUS Bring 24/7 Synthetic Indices to the Global Broker Market Jun 16, 2026
- Institutional investors continue to reduce their presence in metals Jun 16, 2026
- USDJPY Driven by Emotions: Bank of Japan Raises Rate to Highest Level Since 1995 Jun 16, 2026
- The United States and Iran have signed a peace agreement – oil has fallen to 80 dollars per barrel. Jun 15, 2026
- EURUSD Ahead of the New Week: Expecting High Volatility Jun 15, 2026