
By InvestMacro
Here are the latest charts and statistics for the Commitment of Traders (COT) reports data published by the Commodities Futures Trading Commission (CFTC).
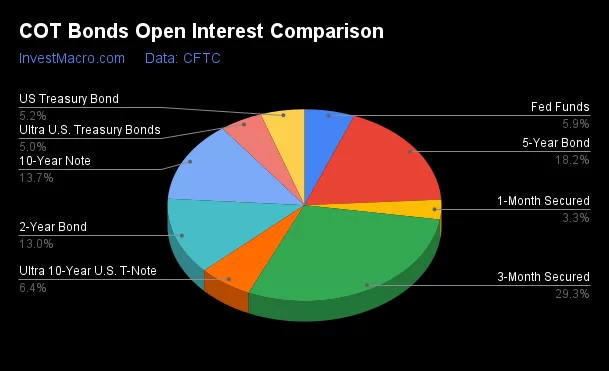
The latest COT data is updated through Tuesday October 15th and shows a quick view of how large traders (for-profit speculators and commercial hedgers) were positioned in the futures markets.
Weekly Speculator Changes led by 10-Year Bonds & US Treasury Bonds
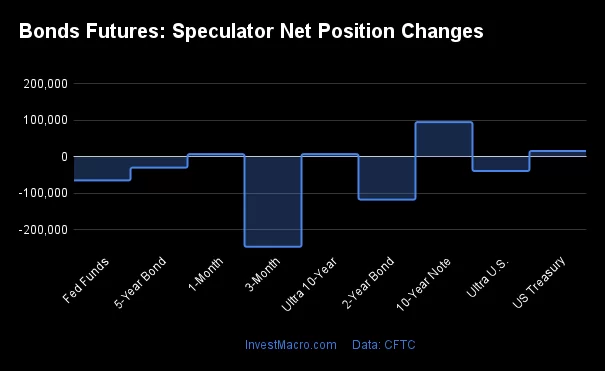
The COT bond market speculator bets were overall lower this week as four out of the nine bond markets we cover had higher positioning while the other five markets had lower speculator contracts.
Free Reports:
 Get our Weekly Commitment of Traders Reports - See where the biggest traders (Hedge Funds and Commercial Hedgers) are positioned in the futures markets on a weekly basis.
 Sign Up for Our Stock Market Newsletter – Get updated on News, Charts & Rankings of Public Companies when you join our Stocks Newsletter
Leading the gains for the bond markets was the 10-Year Bonds (95,064 contracts) with the US Treasury Bonds (15,997 contracts), the Ultra 10-Year Bonds (7,419 contracts) and the SOFR 1-Month (7,304 contracts) showing positive weeks as well.
The bond markets with declines in speculator bets for the week were the SOFR 3-Months (-246,502 contracts), the 2-Year Bonds (-117,224 contracts), the Fed Funds (-64,706 contracts), the 5-Year Bonds (-29,699 contracts) and the Ultra Treasury Bonds (-38,975 contracts) also registering lower bets on the week.
Bonds Net Speculators Leaderboard
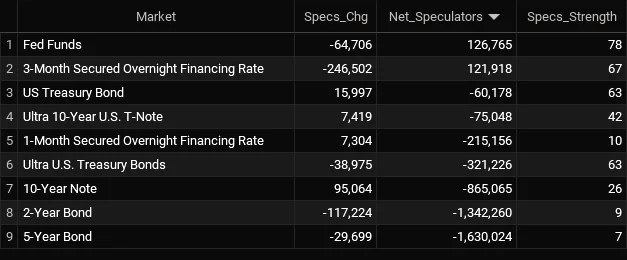
Legend: Weekly Speculators Change | Speculators Current Net Position | Speculators Strength Score compared to last 3-Years (0-100 range)
Strength Scores led by Fed Funds & SOFR 3-Months
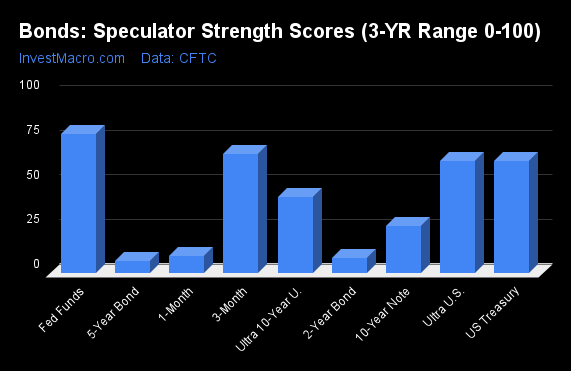
COT Strength Scores (a normalized measure of Speculator positions over a 3-Year range, from 0 to 100 where above 80 is Extreme-Bullish and below 20 is Extreme-Bearish) showed that the Fed Funds (78 percent) and the SOFR 3-Months (67 percent) lead the bond markets this week. The US Treasury Bonds (63 percent) come in as the next highest in the weekly strength scores.
On the downside, the 5-Year Bonds (7 percent), the 2-Year Bonds (9 percent) and the SOFR 1-Month (10 percent) come in at the lowest strength level currently and are in Extreme-Bearish territory (below 20 percent).
Strength Statistics:
Fed Funds (78.0 percent) vs Fed Funds previous week (90.0 percent)
2-Year Bond (8.6 percent) vs 2-Year Bond previous week (16.0 percent)
5-Year Bond (6.5 percent) vs 5-Year Bond previous week (8.4 percent)
10-Year Bond (26.4 percent) vs 10-Year Bond previous week (17.4 percent)
Ultra 10-Year Bond (42.3 percent) vs Ultra 10-Year Bond previous week (40.7 percent)
US Treasury Bond (62.5 percent) vs US Treasury Bond previous week (57.0 percent)
Ultra US Treasury Bond (62.5 percent) vs Ultra US Treasury Bond previous week (80.6 percent)
SOFR 1-Month (9.6 percent) vs SOFR 1-Month previous week (7.7 percent)
SOFR 3-Months (66.6 percent) vs SOFR 3-Months previous week (79.3 percent)
Fed Funds & 10-Year Bonds top the 6-Week Strength Trends
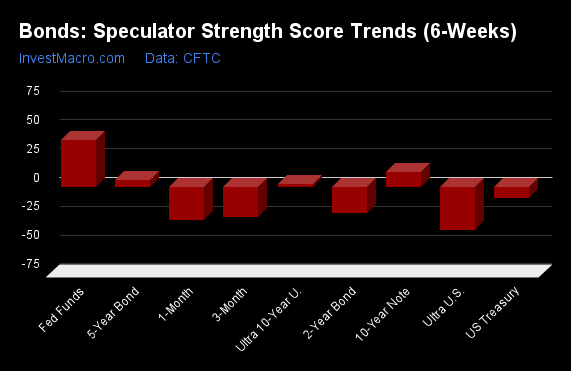
COT Strength Score Trends (or move index, calculates the 6-week changes in strength scores) showed that the Fed Funds (40 percent) and the 10-Year Bonds (13 percent) lead the past six weeks trends for bonds. The 5-Year Bonds (5 percent) are the next highest positive movers in the latest trends data.
The SOFR 1-Month (-29 percent), the SOFR 3-Months (-26 percent) and the 2-Year Bonds (-23 percent) lead the downside trend scores currently.
Strength Trend Statistics:
Fed Funds (40.2 percent) vs Fed Funds previous week (69.8 percent)
2-Year Bond (-23.0 percent) vs 2-Year Bond previous week (-12.5 percent)
5-Year Bond (5.4 percent) vs 5-Year Bond previous week (3.4 percent)
10-Year Bond (13.0 percent) vs 10-Year Bond previous week (-4.3 percent)
Ultra 10-Year Bond (1.8 percent) vs Ultra 10-Year Bond previous week (5.3 percent)
US Treasury Bond (-9.5 percent) vs US Treasury Bond previous week (-21.6 percent)
Ultra US Treasury Bond (-37.5 percent) vs Ultra US Treasury Bond previous week (-5.8 percent)
SOFR 1-Month (-29.2 percent) vs SOFR 1-Month previous week (-47.6 percent)
SOFR 3-Months (-26.3 percent) vs SOFR 3-Months previous week (-9.4 percent)
30-Day Federal Funds Futures:
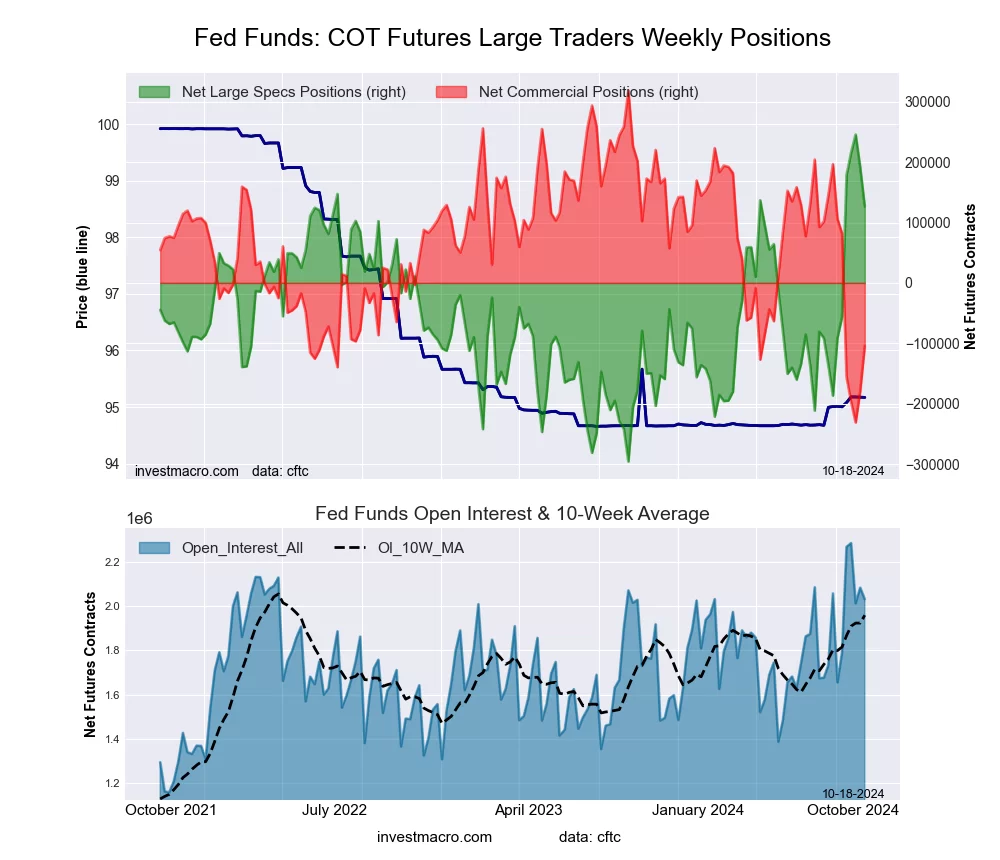 The 30-Day Federal Funds large speculator standing this week totaled a net position of 126,765 contracts in the data reported through Tuesday. This was a weekly decrease of -64,706 contracts from the previous week which had a total of 191,471 net contracts.
This week’s current strength score (the trader positioning range over the past three years, measured from 0 to 100) shows the speculators are currently Bullish with a score of 78.0 percent. The commercials are Bearish with a score of 23.0 percent and the small traders (not shown in chart) are Bearish with a score of 44.3 percent.
Price Trend-Following Model: Downtrend
Our weekly trend-following model classifies the current market price position as: Downtrend. The current action for the model is considered to be: Hold – Maintain Short Position.
| 30-Day Federal Funds Statistics | SPECULATORS | COMMERCIALS | SMALL TRADERS |
| – Percent of Open Interest Longs: | 20.8 | 54.6 | 1.6 |
| – Percent of Open Interest Shorts: | 14.6 | 59.8 | 2.7 |
| – Net Position: | 126,765 | -104,535 | -22,230 |
| – Gross Longs: | 422,543 | 1,109,596 | 31,783 |
| – Gross Shorts: | 295,778 | 1,214,131 | 54,013 |
| – Long to Short Ratio: | 1.4 to 1 | 0.9 to 1 | 0.6 to 1 |
| NET POSITION TREND: | |||
| – Strength Index Score (3 Year Range Pct): | 78.0 | 23.0 | 44.3 |
| – Strength Index Reading (3 Year Range): | Bullish | Bearish | Bearish |
| NET POSITION MOVEMENT INDEX: | |||
| – 6-Week Change in Strength Index: | 40.2 | -38.3 | -12.5 |
Secured Overnight Financing Rate (3-Month) Futures:
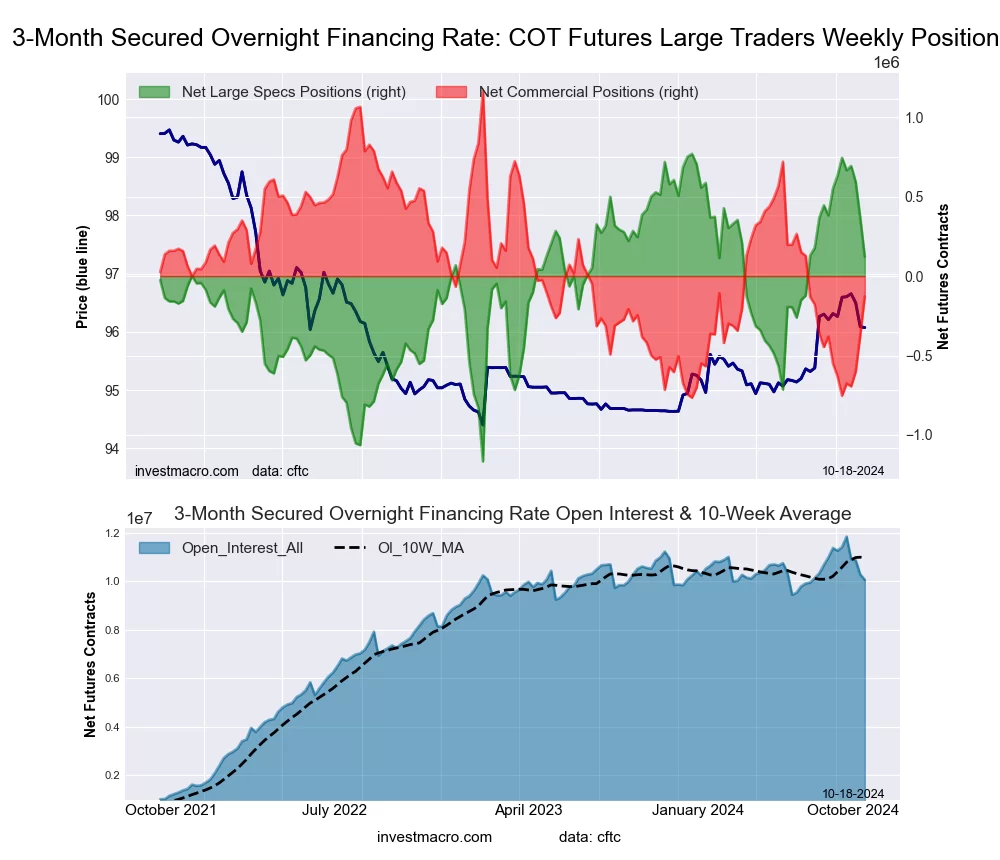 The Secured Overnight Financing Rate (3-Month) large speculator standing this week totaled a net position of 121,918 contracts in the data reported through Tuesday. This was a weekly reduction of -246,502 contracts from the previous week which had a total of 368,420 net contracts.
This week’s current strength score (the trader positioning range over the past three years, measured from 0 to 100) shows the speculators are currently Bullish with a score of 66.6 percent. The commercials are Bearish with a score of 33.0 percent and the small traders (not shown in chart) are Bullish-Extreme with a score of 90.8 percent.
Price Trend-Following Model: Weak Uptrend
Our weekly trend-following model classifies the current market price position as: Weak Uptrend. The current action for the model is considered to be: Hold – Maintain Long Position.
| SOFR 3-Months Statistics | SPECULATORS | COMMERCIALS | SMALL TRADERS |
| – Percent of Open Interest Longs: | 14.5 | 58.3 | 0.4 |
| – Percent of Open Interest Shorts: | 13.3 | 59.6 | 0.3 |
| – Net Position: | 121,918 | -127,329 | 5,411 |
| – Gross Longs: | 1,459,040 | 5,861,025 | 35,753 |
| – Gross Shorts: | 1,337,122 | 5,988,354 | 30,342 |
| – Long to Short Ratio: | 1.1 to 1 | 1.0 to 1 | 1.2 to 1 |
| NET POSITION TREND: | |||
| – Strength Index Score (3 Year Range Pct): | 66.6 | 33.0 | 90.8 |
| – Strength Index Reading (3 Year Range): | Bullish | Bearish | Bullish-Extreme |
| NET POSITION MOVEMENT INDEX: | |||
| – 6-Week Change in Strength Index: | -26.3 | 26.1 | 3.3 |
Individual Bond Markets:
Secured Overnight Financing Rate (1-Month) Futures:
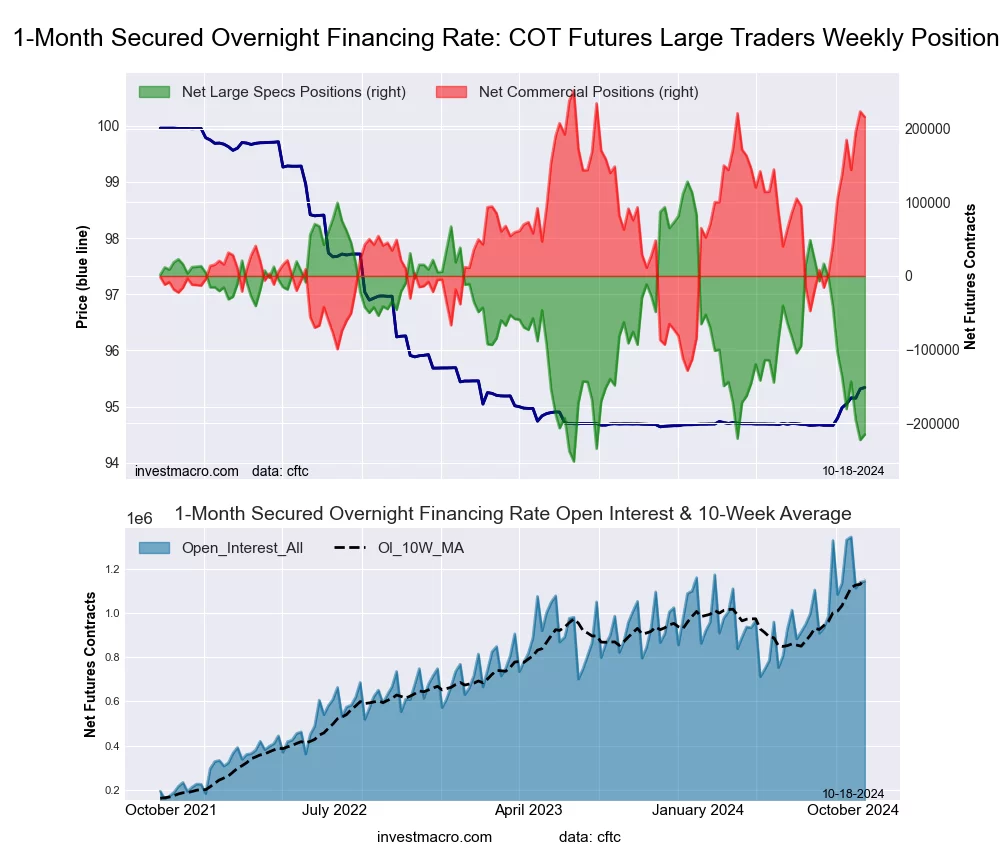 The Secured Overnight Financing Rate (1-Month) large speculator standing this week totaled a net position of -215,156 contracts in the data reported through Tuesday. This was a weekly boost of 7,304 contracts from the previous week which had a total of -222,460 net contracts.
This week’s current strength score (the trader positioning range over the past three years, measured from 0 to 100) shows the speculators are currently Bearish-Extreme with a score of 9.6 percent. The commercials are Bullish-Extreme with a score of 90.6 percent and the small traders (not shown in chart) are Bullish with a score of 51.7 percent.
Price Trend-Following Model: Strong Uptrend
Our weekly trend-following model classifies the current market price position as: Strong Uptrend.
| SOFR 1-Month Statistics | SPECULATORS | COMMERCIALS | SMALL TRADERS |
| – Percent of Open Interest Longs: | 12.3 | 67.1 | 0.0 |
| – Percent of Open Interest Shorts: | 31.1 | 48.2 | 0.1 |
| – Net Position: | -215,156 | 215,684 | -528 |
| – Gross Longs: | 140,428 | 766,626 | 556 |
| – Gross Shorts: | 355,584 | 550,942 | 1,084 |
| – Long to Short Ratio: | 0.4 to 1 | 1.4 to 1 | 0.5 to 1 |
| NET POSITION TREND: | |||
| – Strength Index Score (3 Year Range Pct): | 9.6 | 90.6 | 51.7 |
| – Strength Index Reading (3 Year Range): | Bearish-Extreme | Bullish-Extreme | Bullish |
| NET POSITION MOVEMENT INDEX: | |||
| – 6-Week Change in Strength Index: | -29.2 | 29.2 | 0.9 |
2-Year Treasury Note Futures:
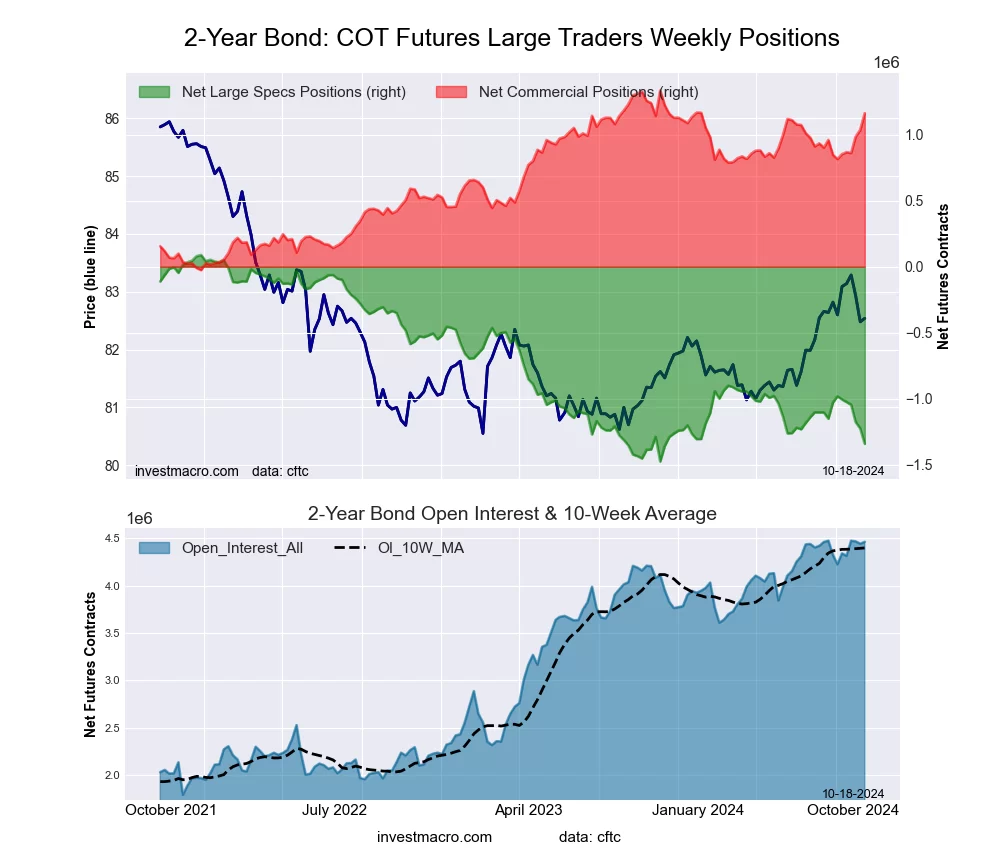 The 2-Year Treasury Note large speculator standing this week totaled a net position of -1,342,260 contracts in the data reported through Tuesday. This was a weekly reduction of -117,224 contracts from the previous week which had a total of -1,225,036 net contracts.
This week’s current strength score (the trader positioning range over the past three years, measured from 0 to 100) shows the speculators are currently Bearish-Extreme with a score of 8.6 percent. The commercials are Bullish-Extreme with a score of 87.4 percent and the small traders (not shown in chart) are Bullish-Extreme with a score of 92.6 percent.
Price Trend-Following Model: Uptrend
Our weekly trend-following model classifies the current market price position as: Uptrend.
| 2-Year Treasury Note Statistics | SPECULATORS | COMMERCIALS | SMALL TRADERS |
| – Percent of Open Interest Longs: | 12.5 | 79.3 | 6.2 |
| – Percent of Open Interest Shorts: | 42.6 | 53.2 | 2.2 |
| – Net Position: | -1,342,260 | 1,162,975 | 179,285 |
| – Gross Longs: | 557,715 | 3,535,657 | 276,550 |
| – Gross Shorts: | 1,899,975 | 2,372,682 | 97,265 |
| – Long to Short Ratio: | 0.3 to 1 | 1.5 to 1 | 2.8 to 1 |
| NET POSITION TREND: | |||
| – Strength Index Score (3 Year Range Pct): | 8.6 | 87.4 | 92.6 |
| – Strength Index Reading (3 Year Range): | Bearish-Extreme | Bullish-Extreme | Bullish-Extreme |
| NET POSITION MOVEMENT INDEX: | |||
| – 6-Week Change in Strength Index: | -23.0 | 25.6 | 3.6 |
5-Year Treasury Note Futures:
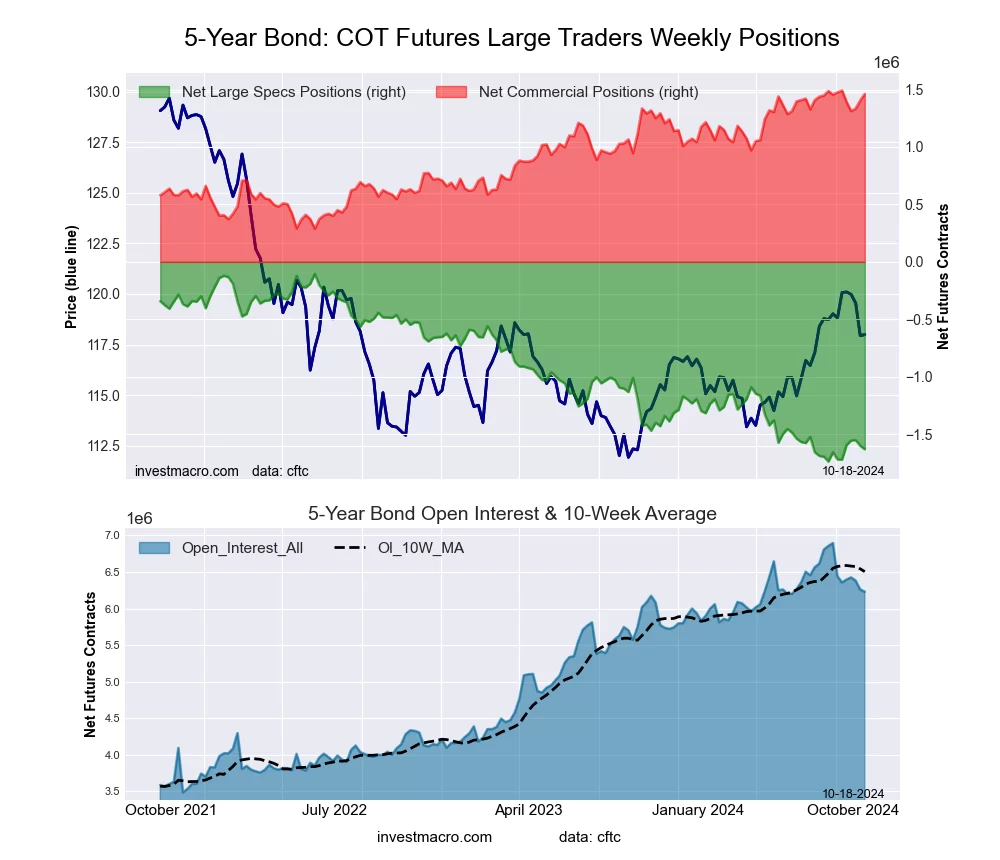 The 5-Year Treasury Note large speculator standing this week totaled a net position of -1,630,024 contracts in the data reported through Tuesday. This was a weekly decline of -29,699 contracts from the previous week which had a total of -1,600,325 net contracts.
This week’s current strength score (the trader positioning range over the past three years, measured from 0 to 100) shows the speculators are currently Bearish-Extreme with a score of 6.5 percent. The commercials are Bullish-Extreme with a score of 97.6 percent and the small traders (not shown in chart) are Bullish-Extreme with a score of 84.9 percent.
Price Trend-Following Model: Uptrend
Our weekly trend-following model classifies the current market price position as: Uptrend.
| 5-Year Treasury Note Statistics | SPECULATORS | COMMERCIALS | SMALL TRADERS |
| – Percent of Open Interest Longs: | 7.3 | 84.2 | 7.0 |
| – Percent of Open Interest Shorts: | 33.4 | 60.8 | 4.3 |
| – Net Position: | -1,630,024 | 1,461,880 | 168,144 |
| – Gross Longs: | 452,589 | 5,248,489 | 437,087 |
| – Gross Shorts: | 2,082,613 | 3,786,609 | 268,943 |
| – Long to Short Ratio: | 0.2 to 1 | 1.4 to 1 | 1.6 to 1 |
| NET POSITION TREND: | |||
| – Strength Index Score (3 Year Range Pct): | 6.5 | 97.6 | 84.9 |
| – Strength Index Reading (3 Year Range): | Bearish-Extreme | Bullish-Extreme | Bullish-Extreme |
| NET POSITION MOVEMENT INDEX: | |||
| – 6-Week Change in Strength Index: | 5.4 | -1.1 | -13.8 |
10-Year Treasury Note Futures:
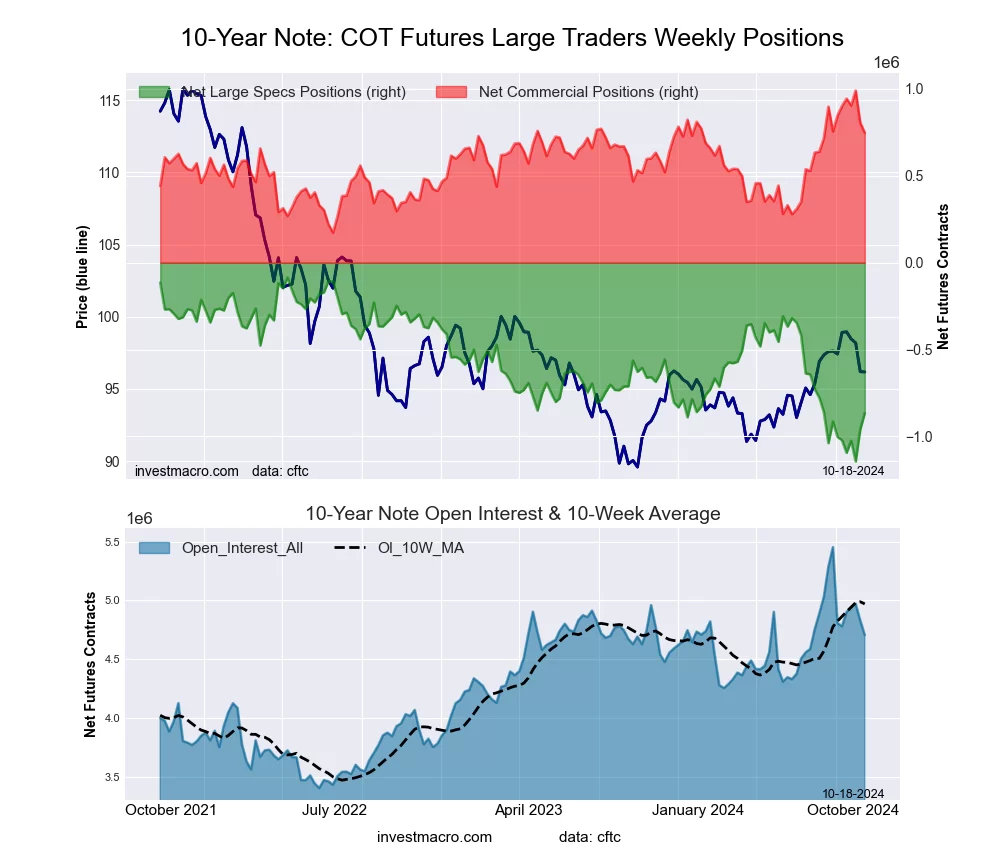 The 10-Year Treasury Note large speculator standing this week totaled a net position of -865,065 contracts in the data reported through Tuesday. This was a weekly lift of 95,064 contracts from the previous week which had a total of -960,129 net contracts.
This week’s current strength score (the trader positioning range over the past three years, measured from 0 to 100) shows the speculators are currently Bearish with a score of 26.4 percent. The commercials are Bullish with a score of 70.3 percent and the small traders (not shown in chart) are Bullish-Extreme with a score of 91.6 percent.
Price Trend-Following Model: Weak Uptrend
Our weekly trend-following model classifies the current market price position as: Weak Uptrend.
| 10-Year Treasury Note Statistics | SPECULATORS | COMMERCIALS | SMALL TRADERS |
| – Percent of Open Interest Longs: | 10.2 | 78.3 | 9.7 |
| – Percent of Open Interest Shorts: | 28.5 | 62.4 | 7.2 |
| – Net Position: | -865,065 | 747,361 | 117,704 |
| – Gross Longs: | 477,930 | 3,684,020 | 458,041 |
| – Gross Shorts: | 1,342,995 | 2,936,659 | 340,337 |
| – Long to Short Ratio: | 0.4 to 1 | 1.3 to 1 | 1.3 to 1 |
| NET POSITION TREND: | |||
| – Strength Index Score (3 Year Range Pct): | 26.4 | 70.3 | 91.6 |
| – Strength Index Reading (3 Year Range): | Bearish | Bullish | Bullish-Extreme |
| NET POSITION MOVEMENT INDEX: | |||
| – 6-Week Change in Strength Index: | 13.0 | -12.2 | -7.7 |
Ultra 10-Year Notes Futures:
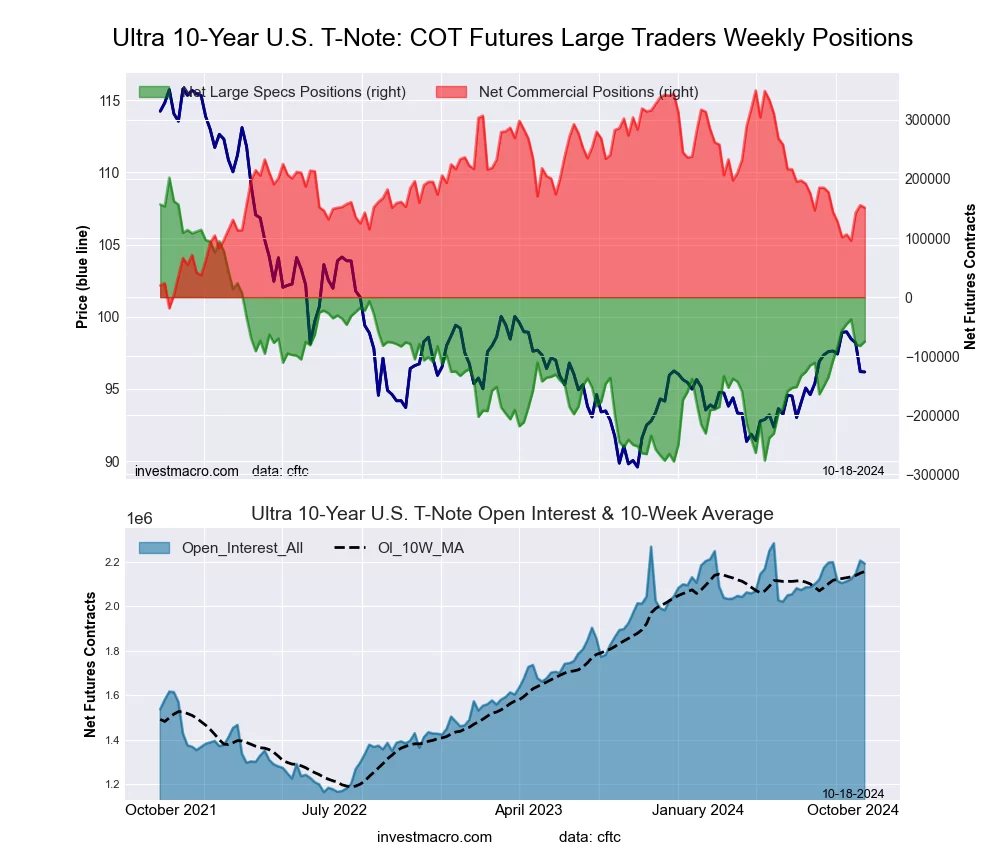 The Ultra 10-Year Notes large speculator standing this week totaled a net position of -75,048 contracts in the data reported through Tuesday. This was a weekly gain of 7,419 contracts from the previous week which had a total of -82,467 net contracts.
This week’s current strength score (the trader positioning range over the past three years, measured from 0 to 100) shows the speculators are currently Bearish with a score of 42.3 percent. The commercials are Bearish with a score of 46.2 percent and the small traders (not shown in chart) are Bullish with a score of 67.6 percent.
Price Trend-Following Model: Weak Uptrend
Our weekly trend-following model classifies the current market price position as: Weak Uptrend. The current action for the model is considered to be: Hold – Maintain Long Position.
| Ultra 10-Year Notes Statistics | SPECULATORS | COMMERCIALS | SMALL TRADERS |
| – Percent of Open Interest Longs: | 16.2 | 73.5 | 9.3 |
| – Percent of Open Interest Shorts: | 19.7 | 66.6 | 12.8 |
| – Net Position: | -75,048 | 151,418 | -76,370 |
| – Gross Longs: | 355,872 | 1,610,178 | 204,283 |
| – Gross Shorts: | 430,920 | 1,458,760 | 280,653 |
| – Long to Short Ratio: | 0.8 to 1 | 1.1 to 1 | 0.7 to 1 |
| NET POSITION TREND: | |||
| – Strength Index Score (3 Year Range Pct): | 42.3 | 46.2 | 67.6 |
| – Strength Index Reading (3 Year Range): | Bearish | Bearish | Bullish |
| NET POSITION MOVEMENT INDEX: | |||
| – 6-Week Change in Strength Index: | 1.8 | 6.4 | -18.9 |
US Treasury Bonds Futures:
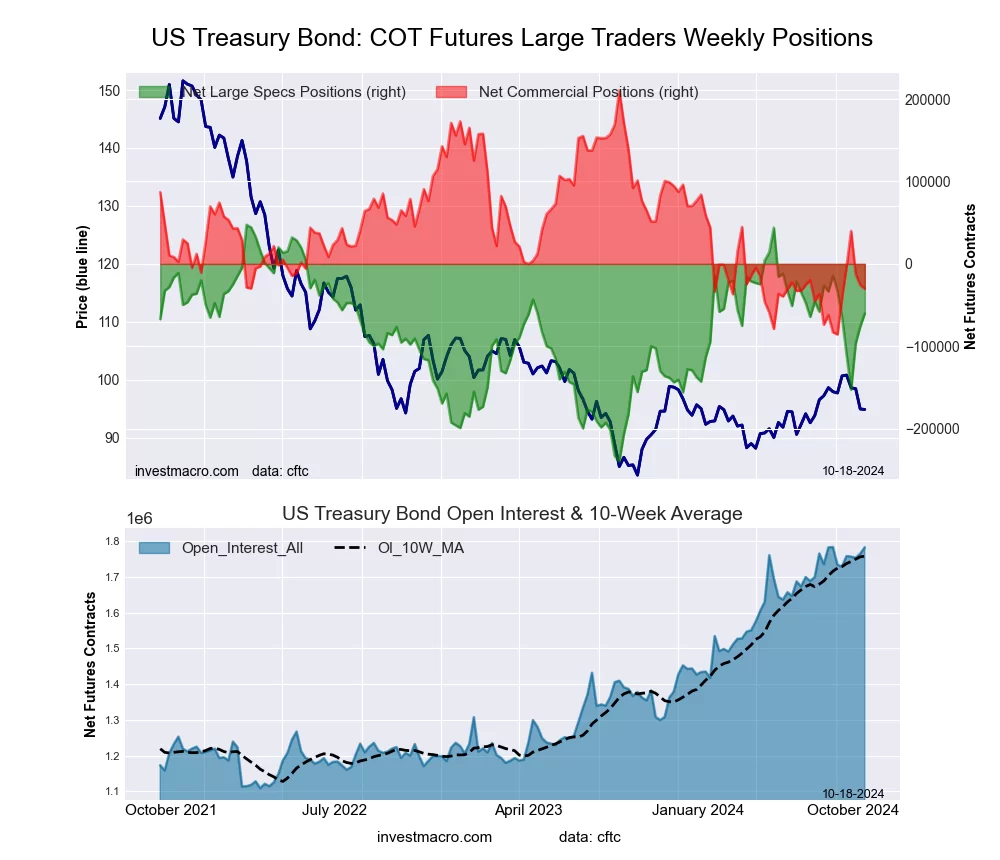 The US Treasury Bonds large speculator standing this week totaled a net position of -60,178 contracts in the data reported through Tuesday. This was a weekly lift of 15,997 contracts from the previous week which had a total of -76,175 net contracts.
This week’s current strength score (the trader positioning range over the past three years, measured from 0 to 100) shows the speculators are currently Bullish with a score of 62.5 percent. The commercials are Bearish-Extreme with a score of 18.7 percent and the small traders (not shown in chart) are Bullish-Extreme with a score of 80.7 percent.
Price Trend-Following Model: Weak Uptrend
Our weekly trend-following model classifies the current market price position as: Weak Uptrend.
| US Treasury Bonds Statistics | SPECULATORS | COMMERCIALS | SMALL TRADERS |
| – Percent of Open Interest Longs: | 21.8 | 64.4 | 12.9 |
| – Percent of Open Interest Shorts: | 25.2 | 66.1 | 7.8 |
| – Net Position: | -60,178 | -30,073 | 90,251 |
| – Gross Longs: | 388,158 | 1,148,257 | 229,519 |
| – Gross Shorts: | 448,336 | 1,178,330 | 139,268 |
| – Long to Short Ratio: | 0.9 to 1 | 1.0 to 1 | 1.6 to 1 |
| NET POSITION TREND: | |||
| – Strength Index Score (3 Year Range Pct): | 62.5 | 18.7 | 80.7 |
| – Strength Index Reading (3 Year Range): | Bullish | Bearish-Extreme | Bullish-Extreme |
| NET POSITION MOVEMENT INDEX: | |||
| – 6-Week Change in Strength Index: | -9.5 | 18.7 | -19.3 |
Ultra US Treasury Bonds Futures:
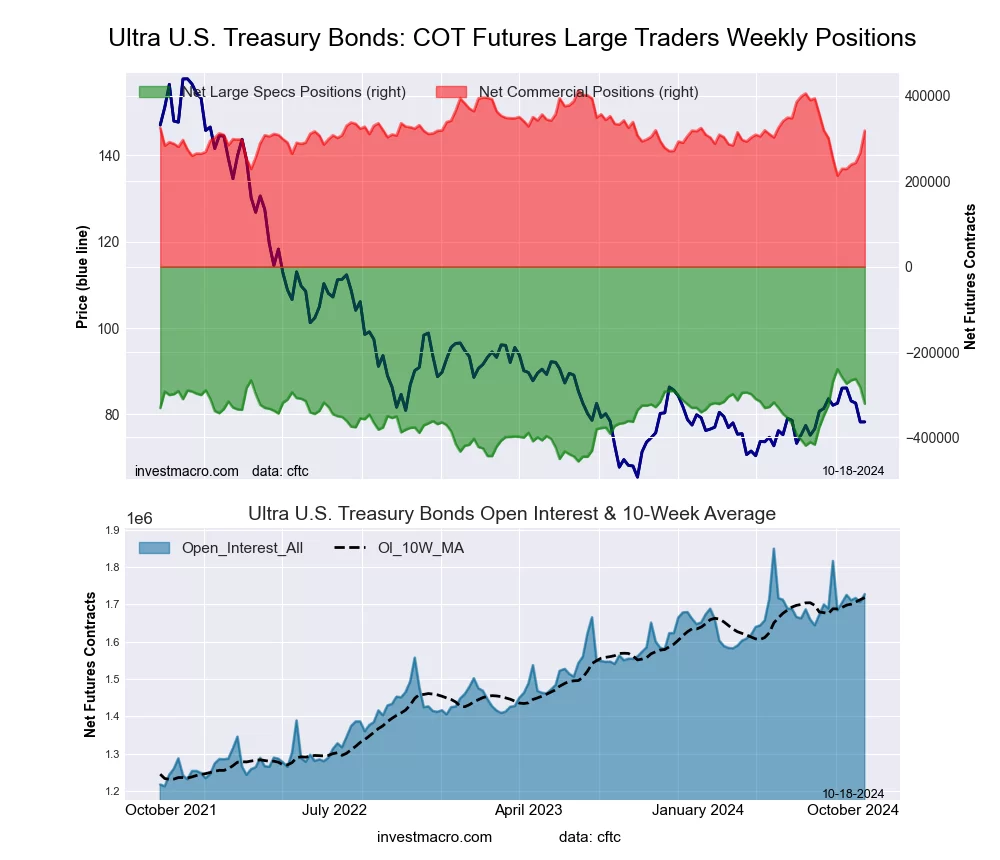 The Ultra US Treasury Bonds large speculator standing this week totaled a net position of -321,226 contracts in the data reported through Tuesday. This was a weekly reduction of -38,975 contracts from the previous week which had a total of -282,251 net contracts.
This week’s current strength score (the trader positioning range over the past three years, measured from 0 to 100) shows the speculators are currently Bullish with a score of 62.5 percent. The commercials are Bullish with a score of 52.9 percent and the small traders (not shown in chart) are Bearish-Extreme with a score of 9.4 percent.
Price Trend-Following Model: Weak Uptrend
Our weekly trend-following model classifies the current market price position as: Weak Uptrend.
| Ultra US Treasury Bonds Statistics | SPECULATORS | COMMERCIALS | SMALL TRADERS |
| – Percent of Open Interest Longs: | 9.5 | 80.2 | 10.2 |
| – Percent of Open Interest Shorts: | 28.1 | 61.7 | 10.0 |
| – Net Position: | -321,226 | 318,542 | 2,684 |
| – Gross Longs: | 164,282 | 1,384,793 | 175,351 |
| – Gross Shorts: | 485,508 | 1,066,251 | 172,667 |
| – Long to Short Ratio: | 0.3 to 1 | 1.3 to 1 | 1.0 to 1 |
| NET POSITION TREND: | |||
| – Strength Index Score (3 Year Range Pct): | 62.5 | 52.9 | 9.4 |
| – Strength Index Reading (3 Year Range): | Bullish | Bullish | Bearish-Extreme |
| NET POSITION MOVEMENT INDEX: | |||
| – 6-Week Change in Strength Index: | -37.5 | 52.9 | -35.0 |
Article By InvestMacro – Receive our weekly COT Newsletter
*COT Report: The COT data, released weekly to the public each Friday, is updated through the most recent Tuesday (data is 3 days old) and shows a quick view of how large speculators or non-commercials (for-profit traders) were positioned in the futures markets.
The CFTC categorizes trader positions according to commercial hedgers (traders who use futures contracts for hedging as part of the business), non-commercials (large traders who speculate to realize trading profits) and nonreportable traders (usually small traders/speculators) as well as their open interest (contracts open in the market at time of reporting). See CFTC criteria here.

- Oil prices fall back to pre‑war levels. Silver drops to a 7‑month low Jun 25, 2026
- Gold Falls to an Eight-Month Low: This May Not Be the Bottom Jun 25, 2026
- Stock indices came under heavy selling pressure amid growing skepticism about AI investments Jun 24, 2026
- The Pound Is Pressured Not by Politics, but by a Strong US Dollar Jun 24, 2026
- Global crude oil prices continued to decline. The AUD/USD exchange rate hit an 11‑week low Jun 23, 2026
- EUR/USD Remains Under Sellers’ Control as the Dollar Stays Strong Jun 23, 2026
- Gold Falls for the Third Consecutive Week: Is There Still Upside Potential? Jun 22, 2026
- Bank Indonesia raised its interest rate. Norges Bank and the SNB left rates unchanged Jun 19, 2026
- EUR/USD Loses Ground as Market Sentiment Favours the US Dollar Jun 19, 2026
- GBPUSD Awaits Bank of England Meeting Near April Lows Jun 18, 2026