
By InvestMacro | COT | Data Tables | COT Leaders | Downloads | COT Newsletter
Here are the latest charts and statistics for the Commitment of Traders (COT) data published by the Commodities Futures Trading Commission (CFTC).
The latest COT data is updated through Tuesday March 15th and shows a quick view of how large traders (for-profit speculators and commercial entities) were positioned in the futures markets.
Highlighting the COT metals data is this week’s pullback in the Gold futures bets. The speculative net position in the Gold futures retreated this week after surging higher and gaining by a total of +102,246 net contracts over the previous five weeks. The recent boost in the speculator sentiment had pushed the Gold bullish position to its highest level in the previous sixty-one weeks. This week saw a modest pullback from the highs of last week but keeps the total Gold speculator sentiment in a strong bullish position above the +250,000 net contract level for a third consecutive week. Gold prices, meanwhile, have retreated from their highs of the past couple weeks and sit right at a support line at the $1920 spot price level currently which sets up an interesting situation going forward between the bulls and bears.
Joining Gold (-12,600 contracts) in lower speculator bets this week were Silver (-743 contracts), Copper (-12,789 contracts), Platinum (-7,901 contracts) and Palladium (-737 contracts).
| Mar-15-2022 | OI | OI-Index | Spec-Net | Spec-Index | Com-Net | COM-Index | Smalls-Net | Smalls-Index |
|---|---|---|---|---|---|---|---|---|
| WTI Crude | 1,850,794 | 0 | 341,815 | 4 | -382,602 | 90 | 40,787 | 72 |
| Gold | 617,605 | 51 | 261,788 | 71 | -297,441 | 27 | 35,653 | 65 |
| Silver | 159,571 | 25 | 51,554 | 74 | -67,579 | 33 | 16,025 | 36 |
| Copper | 183,170 | 14 | 19,030 | 56 | -26,717 | 41 | 7,687 | 70 |
| Palladium | 6,992 | 2 | -1,009 | 16 | 220 | 78 | 789 | 91 |
| Platinum | 67,727 | 35 | 17,932 | 28 | -25,692 | 72 | 7,760 | 70 |
| Natural Gas | 1,082,746 | 0 | -146,560 | 35 | 105,856 | 64 | 40,704 | 82 |
| Brent | 192,679 | 34 | -18,961 | 79 | 17,343 | 22 | 1,618 | 31 |
| Heating Oil | 349,618 | 31 | 6,455 | 52 | -32,434 | 37 | 25,979 | 88 |
| Soybeans | 745,345 | 32 | 217,599 | 84 | -193,958 | 20 | -23,641 | 31 |
| Corn | 1,504,159 | 22 | 507,206 | 95 | -468,758 | 5 | -38,448 | 21 |
| Coffee | 224,693 | 3 | 45,500 | 82 | -48,838 | 22 | 3,338 | 11 |
| Sugar | 818,877 | 1 | 156,580 | 69 | -188,036 | 33 | 31,456 | 47 |
| Wheat | 339,904 | 2 | 10,930 | 56 | -5,252 | 36 | -5,678 | 91 |
Free Reports:
 Get our Weekly Commitment of Traders Reports - See where the biggest traders (Hedge Funds and Commercial Hedgers) are positioned in the futures markets on a weekly basis.
 Sign Up for Our Stock Market Newsletter – Get updated on News, Charts & Rankings of Public Companies when you join our Stocks Newsletter
Gold Comex Futures:
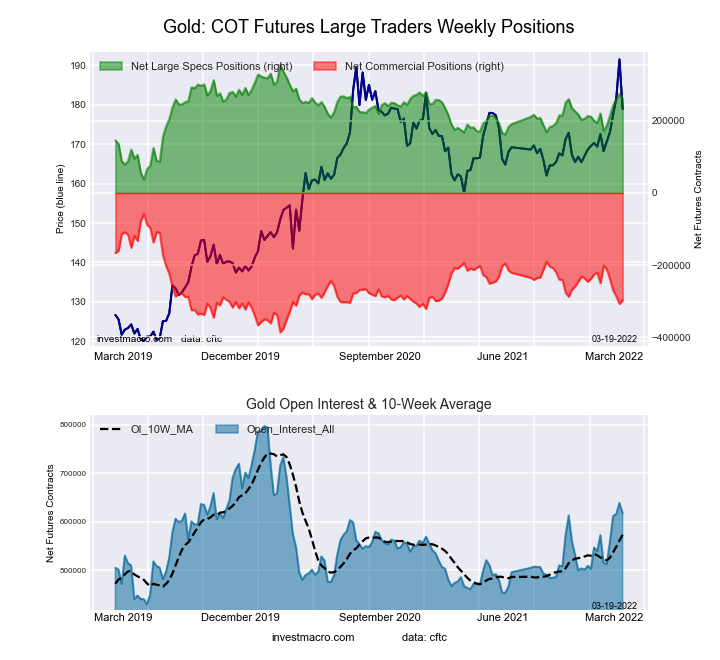 The Gold Comex Futures large speculator standing this week equaled a net position of 261,788 contracts in the data reported through Tuesday. This was a weekly lowering of -12,600 contracts from the previous week which had a total of 274,388 net contracts.
This week’s current strength score (the trader positioning range over the past three years, measured from 0 to 100) shows the speculators are currently Bullish with a score of 71.0 percent. The commercials are Bearish with a score of 26.9 percent and the small traders (not shown in chart) are Bullish with a score of 65.4 percent.
| Gold Futures Statistics | SPECULATORS | COMMERCIALS | SMALL TRADERS |
| – Percent of Open Interest Longs: | 56.1 | 24.5 | 8.8 |
| – Percent of Open Interest Shorts: | 13.8 | 72.6 | 3.0 |
| – Net Position: | 261,788 | -297,441 | 35,653 |
| – Gross Longs: | 346,731 | 151,045 | 54,330 |
| – Gross Shorts: | 84,943 | 448,486 | 18,677 |
| – Long to Short Ratio: | 4.1 to 1 | 0.3 to 1 | 2.9 to 1 |
| NET POSITION TREND: | |||
| – Strength Index Score (3 Year Range Pct): | 71.0 | 26.9 | 65.4 |
| – Strength Index Reading (3 Year Range): | Bullish | Bearish | Bullish |
| NET POSITION MOVEMENT INDEX: | |||
| – 6-Week Change in Strength Index: | 28.3 | -29.3 | 18.3 |
Silver Comex Futures:
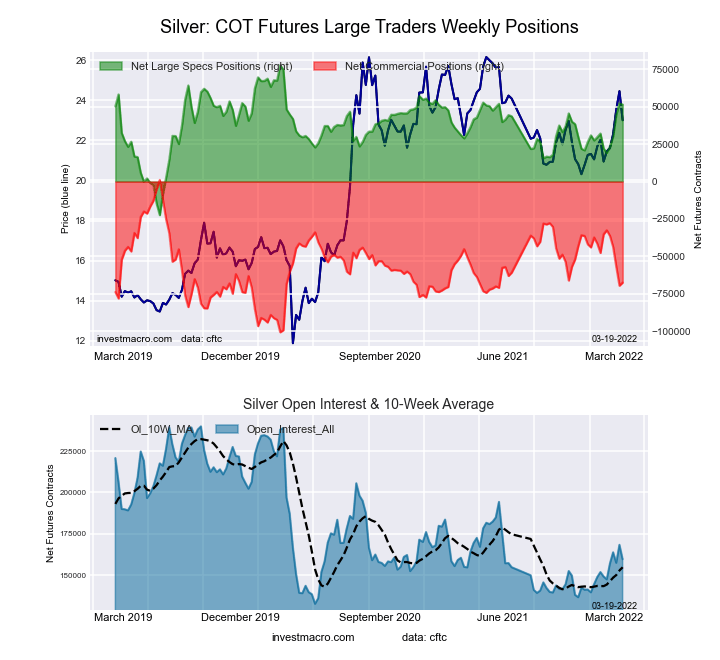 The Silver Comex Futures large speculator standing this week equaled a net position of 51,554 contracts in the data reported through Tuesday. This was a weekly decrease of -743 contracts from the previous week which had a total of 52,297 net contracts.
This week’s current strength score (the trader positioning range over the past three years, measured from 0 to 100) shows the speculators are currently Bullish with a score of 73.8 percent. The commercials are Bearish with a score of 32.6 percent and the small traders (not shown in chart) are Bearish with a score of 36.2 percent.
| Silver Futures Statistics | SPECULATORS | COMMERCIALS | SMALL TRADERS |
| – Percent of Open Interest Longs: | 46.4 | 27.8 | 16.5 |
| – Percent of Open Interest Shorts: | 14.1 | 70.1 | 6.4 |
| – Net Position: | 51,554 | -67,579 | 16,025 |
| – Gross Longs: | 74,044 | 44,324 | 26,270 |
| – Gross Shorts: | 22,490 | 111,903 | 10,245 |
| – Long to Short Ratio: | 3.3 to 1 | 0.4 to 1 | 2.6 to 1 |
| NET POSITION TREND: | |||
| – Strength Index Score (3 Year Range Pct): | 73.8 | 32.6 | 36.2 |
| – Strength Index Reading (3 Year Range): | Bullish | Bearish | Bearish |
| NET POSITION MOVEMENT INDEX: | |||
| – 6-Week Change in Strength Index: | 29.4 | -31.7 | 16.8 |
Copper Grade #1 Futures:
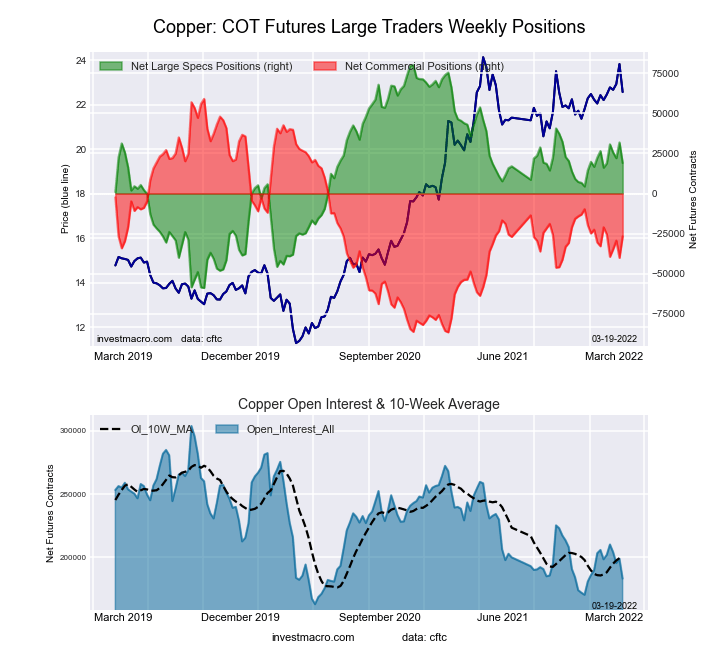 The Copper Grade #1 Futures large speculator standing this week equaled a net position of 19,030 contracts in the data reported through Tuesday. This was a weekly fall of -12,789 contracts from the previous week which had a total of 31,819 net contracts.
This week’s current strength score (the trader positioning range over the past three years, measured from 0 to 100) shows the speculators are currently Bullish with a score of 56.1 percent. The commercials are Bearish with a score of 41.1 percent and the small traders (not shown in chart) are Bullish with a score of 69.7 percent.
| Copper Futures Statistics | SPECULATORS | COMMERCIALS | SMALL TRADERS |
| – Percent of Open Interest Longs: | 40.0 | 42.0 | 9.8 |
| – Percent of Open Interest Shorts: | 29.6 | 56.6 | 5.6 |
| – Net Position: | 19,030 | -26,717 | 7,687 |
| – Gross Longs: | 73,338 | 76,948 | 17,878 |
| – Gross Shorts: | 54,308 | 103,665 | 10,191 |
| – Long to Short Ratio: | 1.4 to 1 | 0.7 to 1 | 1.8 to 1 |
| NET POSITION TREND: | |||
| – Strength Index Score (3 Year Range Pct): | 56.1 | 41.1 | 69.7 |
| – Strength Index Reading (3 Year Range): | Bullish | Bearish | Bullish |
| NET POSITION MOVEMENT INDEX: | |||
| – 6-Week Change in Strength Index: | 2.1 | -3.9 | 16.1 |
Platinum Futures:
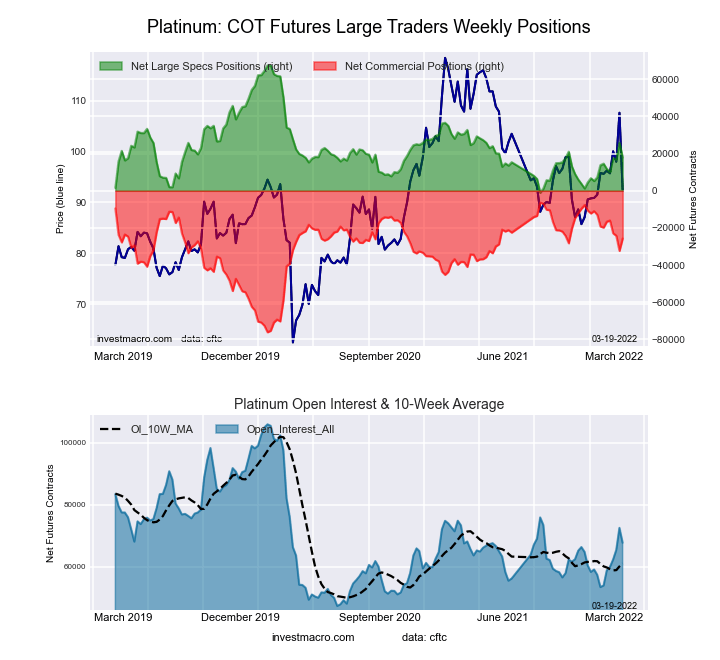 The Platinum Futures large speculator standing this week equaled a net position of 17,932 contracts in the data reported through Tuesday. This was a weekly lowering of -7,901 contracts from the previous week which had a total of 25,833 net contracts.
This week’s current strength score (the trader positioning range over the past three years, measured from 0 to 100) shows the speculators are currently Bearish with a score of 27.7 percent. The commercials are Bullish with a score of 72.3 percent and the small traders (not shown in chart) are Bullish with a score of 70.3 percent.
| Platinum Futures Statistics | SPECULATORS | COMMERCIALS | SMALL TRADERS |
| – Percent of Open Interest Longs: | 50.0 | 29.7 | 15.2 |
| – Percent of Open Interest Shorts: | 23.5 | 67.6 | 3.8 |
| – Net Position: | 17,932 | -25,692 | 7,760 |
| – Gross Longs: | 33,833 | 20,085 | 10,326 |
| – Gross Shorts: | 15,901 | 45,777 | 2,566 |
| – Long to Short Ratio: | 2.1 to 1 | 0.4 to 1 | 4.0 to 1 |
| NET POSITION TREND: | |||
| – Strength Index Score (3 Year Range Pct): | 27.7 | 72.3 | 70.3 |
| – Strength Index Reading (3 Year Range): | Bearish | Bullish | Bullish |
| NET POSITION MOVEMENT INDEX: | |||
| – 6-Week Change in Strength Index: | 4.9 | -8.5 | 35.7 |
Palladium Futures:
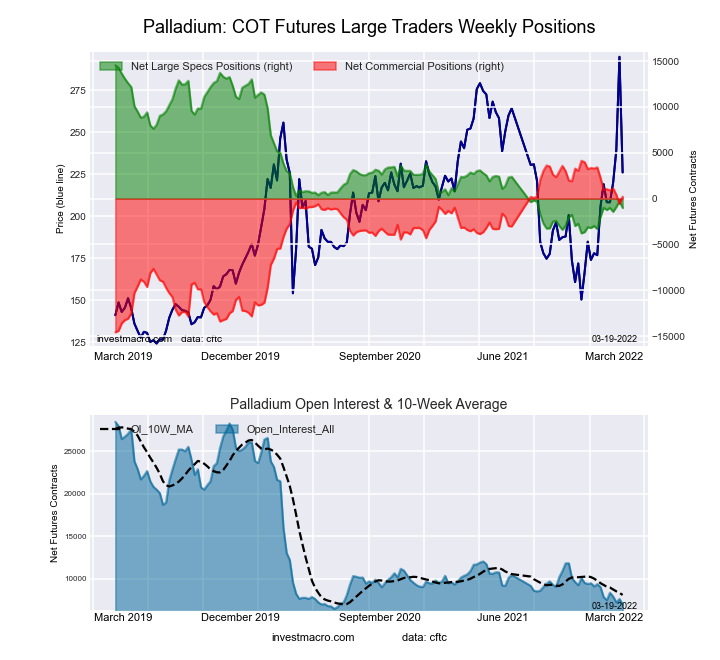 The Palladium Futures large speculator standing this week equaled a net position of -1,009 contracts in the data reported through Tuesday. This was a weekly decline of -737 contracts from the previous week which had a total of -272 net contracts.
This week’s current strength score (the trader positioning range over the past three years, measured from 0 to 100) shows the speculators are currently Bearish-Extreme with a score of 15.8 percent. The commercials are Bullish with a score of 77.7 percent and the small traders (not shown in chart) are Bullish-Extreme with a score of 91.1 percent.
| Palladium Futures Statistics | SPECULATORS | COMMERCIALS | SMALL TRADERS |
| – Percent of Open Interest Longs: | 29.8 | 47.7 | 21.1 |
| – Percent of Open Interest Shorts: | 44.3 | 44.5 | 9.8 |
| – Net Position: | -1,009 | 220 | 789 |
| – Gross Longs: | 2,085 | 3,334 | 1,473 |
| – Gross Shorts: | 3,094 | 3,114 | 684 |
| – Long to Short Ratio: | 0.7 to 1 | 1.1 to 1 | 2.2 to 1 |
| NET POSITION TREND: | |||
| – Strength Index Score (3 Year Range Pct): | 15.8 | 77.7 | 91.1 |
| – Strength Index Reading (3 Year Range): | Bearish-Extreme | Bullish | Bullish-Extreme |
| NET POSITION MOVEMENT INDEX: | |||
| – 6-Week Change in Strength Index: | -0.1 | -4.3 | 44.9 |
Article By InvestMacro – Receive our weekly COT Reports by Email
*COT Report: The COT data, released weekly to the public each Friday, is updated through the most recent Tuesday (data is 3 days old) and shows a quick view of how large speculators or non-commercials (for-profit traders) were positioned in the futures markets.
The CFTC categorizes trader positions according to commercial hedgers (traders who use futures contracts for hedging as part of the business), non-commercials (large traders who speculate to realize trading profits) and nonreportable traders (usually small traders/speculators) as well as their open interest (contracts open in the market at time of reporting).See CFTC criteria here.

- China has shifted to using its own strategic oil reserves Jun 9, 2026
- GBP/USD Remains Under Pressure Despite Attempts to Recover Jun 9, 2026
- SpaceX IPO: Set for $75 billion liftoff Jun 8, 2026
- On Friday, the American stock market experienced one of the strongest crashes in recent times Jun 8, 2026
- EUR/USD at April Lows: What’s Next for the Pair? Jun 8, 2026
- The ceasefire between Israel and Lebanon has reduced the geopolitical premium Jun 5, 2026
- EUR/USD: All Eyes on Non-Farm Payrolls Jun 5, 2026
- The escalation of the conflict in the Middle East put pressure on US and European stock indices Jun 4, 2026
- Gold Remains Under Pressure, but a Rebound Is Still Possible Jun 4, 2026
- Bitcoin drops below the psychological $70,000 level. The US stock indices hit new record highs Jun 3, 2026