By InvestMacro | COT | Data Tables | COT Leaders | Downloads | COT Newsletter
Here are the latest charts and statistics for the Commitment of Traders (COT) data published by the Commodities Futures Trading Commission (CFTC).
The latest COT data is updated through Tuesday March 15th and shows a quick view of how large traders (for-profit speculators and commercial entities) were positioned in the futures markets.
Highlighting the COT energy data is the pullback in the WTI Crude Oil futures bets. The speculative net position in the WTI Crude Oil futures dropped this week for a second consecutive week and has fallen in seven out of the past eight weeks. The spec crude position has declined by a total of -43,966 contracts over the past eight weeks and speculator bets are now at a three-week low. The speculator strength index, current speculator standing compared to past three years where above 80 percent is bullish extreme and below 20 percent is bearish extreme, shows that speculator bets are extremely bearish right now compared to the past with a strength score of just 3.5 percent.
The energy market with higher speculator bets was just the Bloomberg Commodity Index (3,789 contracts).
The energy markets with lower speculator bets were WTI Crude Oil (-19,850 contracts), Brent Crude Oil (-7,249 contracts), Natural Gas (-8,147 contracts), Heating Oil (-9,228 contracts) and the Gasoline (-3,298 contracts).
Free Reports:
 Download Our Metatrader 4 Indicators – Put Our Free MetaTrader 4 Custom Indicators on your charts when you join our Weekly Newsletter
 Get our Weekly Commitment of Traders Reports - See where the biggest traders (Hedge Funds and Commercial Hedgers) are positioned in the futures markets on a weekly basis.
| Mar-15-2022 | OI | OI-Index | Spec-Net | Spec-Index | Com-Net | COM-Index | Smalls-Net | Smalls-Index |
|---|---|---|---|---|---|---|---|---|
| WTI Crude | 1,850,794 | 0 | 341,815 | 4 | -382,602 | 90 | 40,787 | 72 |
| Gold | 617,605 | 51 | 261,788 | 71 | -297,441 | 27 | 35,653 | 65 |
| Silver | 159,571 | 25 | 51,554 | 74 | -67,579 | 33 | 16,025 | 36 |
| Copper | 183,170 | 14 | 19,030 | 56 | -26,717 | 41 | 7,687 | 70 |
| Palladium | 6,992 | 2 | -1,009 | 16 | 220 | 78 | 789 | 91 |
| Platinum | 67,727 | 35 | 17,932 | 28 | -25,692 | 72 | 7,760 | 70 |
| Natural Gas | 1,082,746 | 0 | -146,560 | 35 | 105,856 | 64 | 40,704 | 82 |
| Brent | 192,679 | 34 | -18,961 | 79 | 17,343 | 22 | 1,618 | 31 |
| Heating Oil | 349,618 | 31 | 6,455 | 52 | -32,434 | 37 | 25,979 | 88 |
| Soybeans | 745,345 | 32 | 217,599 | 84 | -193,958 | 20 | -23,641 | 31 |
| Corn | 1,504,159 | 22 | 507,206 | 95 | -468,758 | 5 | -38,448 | 21 |
| Coffee | 224,693 | 3 | 45,500 | 82 | -48,838 | 22 | 3,338 | 11 |
| Sugar | 818,877 | 1 | 156,580 | 69 | -188,036 | 33 | 31,456 | 47 |
| Wheat | 339,904 | 2 | 10,930 | 56 | -5,252 | 36 | -5,678 | 91 |
WTI Crude Oil Futures:
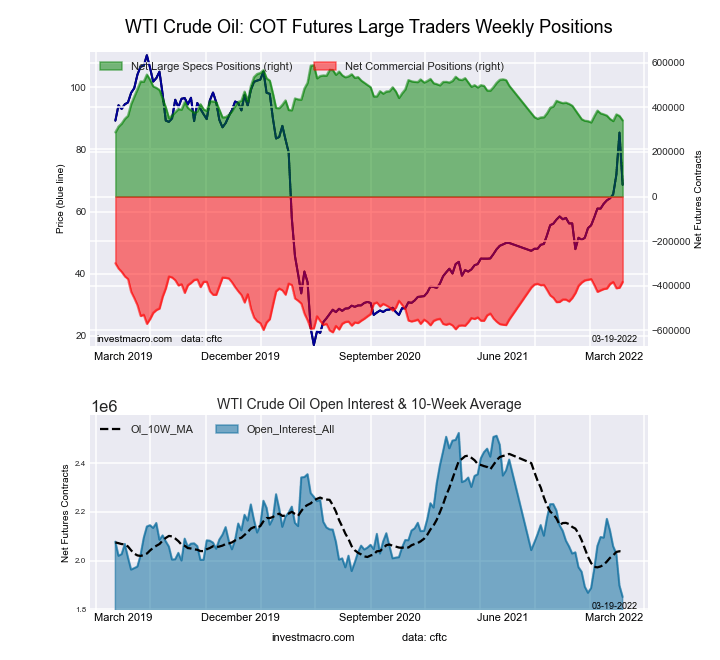 The WTI Crude Oil Futures large speculator standing this week recorded a net position of 341,815 contracts in the data reported through Tuesday. This was a weekly lowering of -19,850 contracts from the previous week which had a total of 361,665 net contracts.
This week’s current strength score (the trader positioning range over the past three years, measured from 0 to 100) shows the speculators are currently Bearish-Extreme with a score of 3.5 percent. The commercials are Bullish-Extreme with a score of 90.4 percent and the small traders (not shown in chart) are Bullish with a score of 72.5 percent.
| WTI Crude Oil Futures Statistics | SPECULATORS | COMMERCIALS | SMALL TRADERS |
| – Percent of Open Interest Longs: | 24.0 | 37.8 | 4.5 |
| – Percent of Open Interest Shorts: | 5.6 | 58.5 | 2.3 |
| – Net Position: | 341,815 | -382,602 | 40,787 |
| – Gross Longs: | 444,601 | 700,410 | 83,830 |
| – Gross Shorts: | 102,786 | 1,083,012 | 43,043 |
| – Long to Short Ratio: | 4.3 to 1 | 0.6 to 1 | 1.9 to 1 |
| NET POSITION TREND: | |||
| – Strength Index Score (3 Year Range Pct): | 3.5 | 90.4 | 72.5 |
| – Strength Index Reading (3 Year Range): | Bearish-Extreme | Bullish-Extreme | Bullish |
| NET POSITION MOVEMENT INDEX: | |||
| – 6-Week Change in Strength Index: | -10.6 | 12.8 | -7.0 |
Brent Crude Oil Futures:
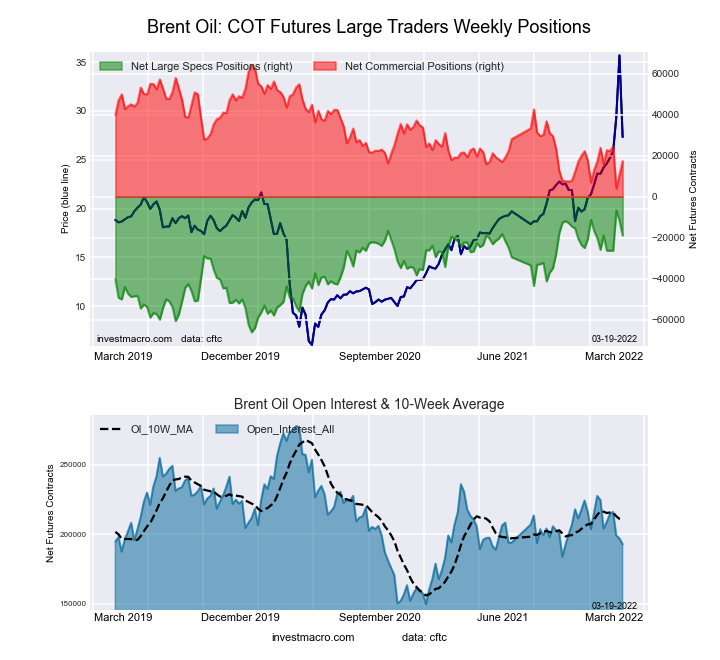 The Brent Crude Oil Futures large speculator standing this week recorded a net position of -18,961 contracts in the data reported through Tuesday. This was a weekly decline of -7,249 contracts from the previous week which had a total of -11,712 net contracts.
This week’s current strength score (the trader positioning range over the past three years, measured from 0 to 100) shows the speculators are currently Bullish with a score of 79.4 percent. The commercials are Bearish with a score of 22.2 percent and the small traders (not shown in chart) are Bearish with a score of 31.1 percent.
| Brent Crude Oil Futures Statistics | SPECULATORS | COMMERCIALS | SMALL TRADERS |
| – Percent of Open Interest Longs: | 22.0 | 41.3 | 4.0 |
| – Percent of Open Interest Shorts: | 31.8 | 32.3 | 3.2 |
| – Net Position: | -18,961 | 17,343 | 1,618 |
| – Gross Longs: | 42,390 | 79,663 | 7,742 |
| – Gross Shorts: | 61,351 | 62,320 | 6,124 |
| – Long to Short Ratio: | 0.7 to 1 | 1.3 to 1 | 1.3 to 1 |
| NET POSITION TREND: | |||
| – Strength Index Score (3 Year Range Pct): | 79.4 | 22.2 | 31.1 |
| – Strength Index Reading (3 Year Range): | Bullish | Bearish | Bearish |
| NET POSITION MOVEMENT INDEX: | |||
| – 6-Week Change in Strength Index: | -0.1 | 2.7 | -21.2 |
Natural Gas Futures:
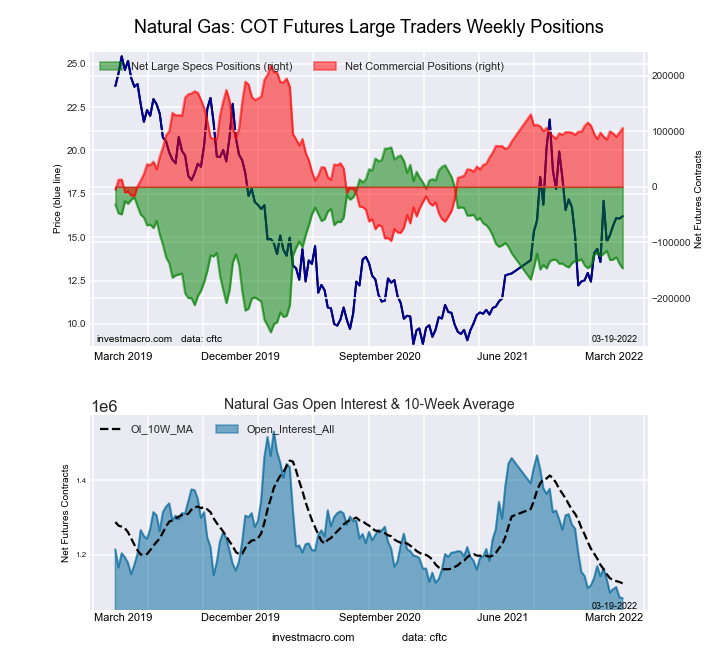 The Natural Gas Futures large speculator standing this week recorded a net position of -146,560 contracts in the data reported through Tuesday. This was a weekly decrease of -8,147 contracts from the previous week which had a total of -138,413 net contracts.
This week’s current strength score (the trader positioning range over the past three years, measured from 0 to 100) shows the speculators are currently Bearish with a score of 34.6 percent. The commercials are Bullish with a score of 64.3 percent and the small traders (not shown in chart) are Bullish-Extreme with a score of 82.0 percent.
| Natural Gas Futures Statistics | SPECULATORS | COMMERCIALS | SMALL TRADERS |
| – Percent of Open Interest Longs: | 22.2 | 43.3 | 5.8 |
| – Percent of Open Interest Shorts: | 35.7 | 33.5 | 2.0 |
| – Net Position: | -146,560 | 105,856 | 40,704 |
| – Gross Longs: | 240,482 | 468,705 | 62,435 |
| – Gross Shorts: | 387,042 | 362,849 | 21,731 |
| – Long to Short Ratio: | 0.6 to 1 | 1.3 to 1 | 2.9 to 1 |
| NET POSITION TREND: | |||
| – Strength Index Score (3 Year Range Pct): | 34.6 | 64.3 | 82.0 |
| – Strength Index Reading (3 Year Range): | Bearish | Bullish | Bullish-Extreme |
| NET POSITION MOVEMENT INDEX: | |||
| – 6-Week Change in Strength Index: | -8.0 | 4.9 | 27.7 |
Gasoline Blendstock Futures:
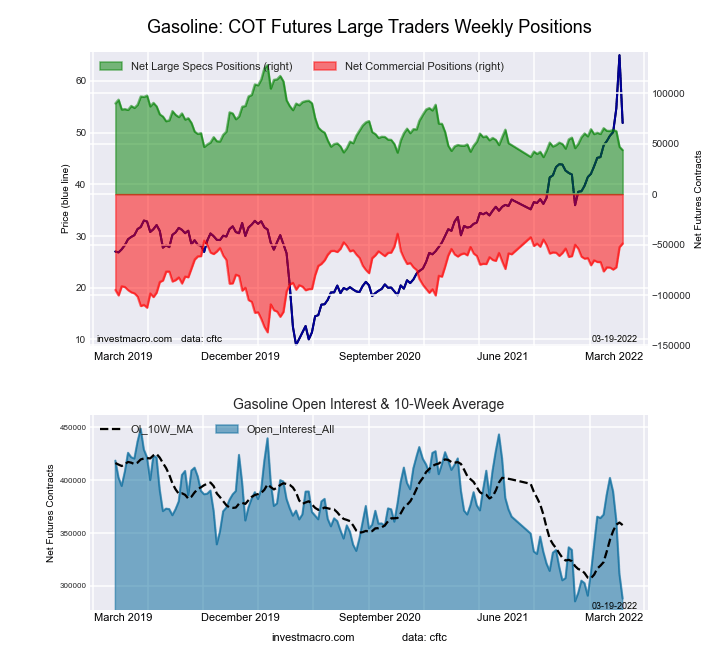 The Gasoline Blendstock Futures large speculator standing this week recorded a net position of 43,602 contracts in the data reported through Tuesday. This was a weekly lowering of -3,298 contracts from the previous week which had a total of 46,900 net contracts.
This week’s current strength score (the trader positioning range over the past three years, measured from 0 to 100) shows the speculators are currently Bearish-Extreme with a score of 14.5 percent. The commercials are Bullish-Extreme with a score of 88.1 percent and the small traders (not shown in chart) are Bearish with a score of 43.3 percent.
| Nasdaq Mini Futures Statistics | SPECULATORS | COMMERCIALS | SMALL TRADERS |
| – Percent of Open Interest Longs: | 26.5 | 52.5 | 7.2 |
| – Percent of Open Interest Shorts: | 11.4 | 69.5 | 5.4 |
| – Net Position: | 43,602 | -48,914 | 5,312 |
| – Gross Longs: | 76,383 | 151,239 | 20,732 |
| – Gross Shorts: | 32,781 | 200,153 | 15,420 |
| – Long to Short Ratio: | 2.3 to 1 | 0.8 to 1 | 1.3 to 1 |
| NET POSITION TREND: | |||
| – Strength Index Score (3 Year Range Pct): | 14.5 | 88.1 | 43.3 |
| – Strength Index Reading (3 Year Range): | Bearish-Extreme | Bullish-Extreme | Bearish |
| NET POSITION MOVEMENT INDEX: | |||
| – 6-Week Change in Strength Index: | -22.1 | 27.7 | -35.4 |
#2 Heating Oil NY-Harbor Futures:
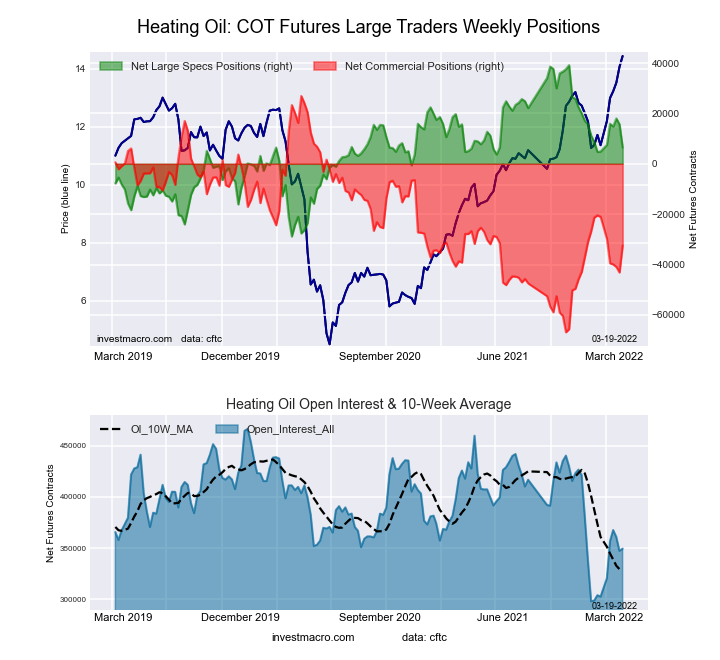 The #2 Heating Oil NY-Harbor Futures large speculator standing this week recorded a net position of 6,455 contracts in the data reported through Tuesday. This was a weekly reduction of -9,228 contracts from the previous week which had a total of 15,683 net contracts.
This week’s current strength score (the trader positioning range over the past three years, measured from 0 to 100) shows the speculators are currently Bullish with a score of 51.9 percent. The commercials are Bearish with a score of 36.7 percent and the small traders (not shown in chart) are Bullish-Extreme with a score of 88.4 percent.
| Heating Oil Futures Statistics | SPECULATORS | COMMERCIALS | SMALL TRADERS |
| – Percent of Open Interest Longs: | 17.0 | 50.8 | 14.4 |
| – Percent of Open Interest Shorts: | 15.1 | 60.1 | 6.9 |
| – Net Position: | 6,455 | -32,434 | 25,979 |
| – Gross Longs: | 59,340 | 177,626 | 50,210 |
| – Gross Shorts: | 52,885 | 210,060 | 24,231 |
| – Long to Short Ratio: | 1.1 to 1 | 0.8 to 1 | 2.1 to 1 |
| NET POSITION TREND: | |||
| – Strength Index Score (3 Year Range Pct): | 51.9 | 36.7 | 88.4 |
| – Strength Index Reading (3 Year Range): | Bullish | Bearish | Bullish-Extreme |
| NET POSITION MOVEMENT INDEX: | |||
| – 6-Week Change in Strength Index: | 4.2 | -10.3 | 23.6 |
Bloomberg Commodity Index Futures:
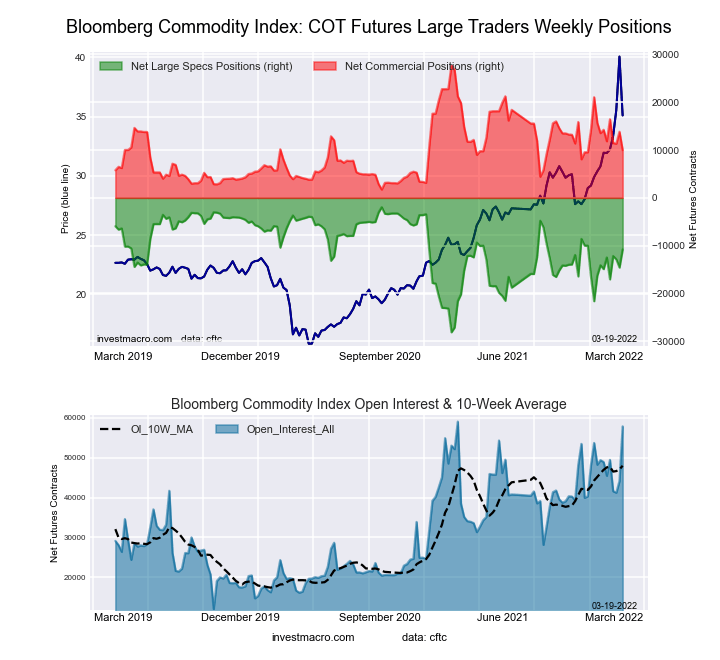 The Bloomberg Commodity Index Futures large speculator standing this week recorded a net position of -10,780 contracts in the data reported through Tuesday. This was a weekly rise of 3,789 contracts from the previous week which had a total of -14,569 net contracts.
This week’s current strength score (the trader positioning range over the past three years, measured from 0 to 100) shows the speculators are currently Bullish with a score of 66.2 percent. The commercials are Bearish with a score of 31.7 percent and the small traders (not shown in chart) are Bearish with a score of 47.7 percent.
| Bloomberg Index Futures Statistics | SPECULATORS | COMMERCIALS | SMALL TRADERS |
| – Percent of Open Interest Longs: | 48.9 | 18.5 | 1.5 |
| – Percent of Open Interest Shorts: | 67.5 | 1.2 | 0.1 |
| – Net Position: | -10,780 | 9,985 | 795 |
| – Gross Longs: | 28,304 | 10,697 | 859 |
| – Gross Shorts: | 39,084 | 712 | 64 |
| – Long to Short Ratio: | 0.7 to 1 | 15.0 to 1 | 13.4 to 1 |
| NET POSITION TREND: | |||
| – Strength Index Score (3 Year Range Pct): | 66.2 | 31.7 | 47.7 |
| – Strength Index Reading (3 Year Range): | Bullish | Bearish | Bearish |
| NET POSITION MOVEMENT INDEX: | |||
| – 6-Week Change in Strength Index: | 15.7 | -16.4 | 4.8 |
Article By InvestMacro – Receive our weekly COT Reports by Email
*COT Report: The COT data, released weekly to the public each Friday, is updated through the most recent Tuesday (data is 3 days old) and shows a quick view of how large speculators or non-commercials (for-profit traders) were positioned in the futures markets.
The CFTC categorizes trader positions according to commercial hedgers (traders who use futures contracts for hedging as part of the business), non-commercials (large traders who speculate to realize trading profits) and nonreportable traders (usually small traders/speculators) as well as their open interest (contracts open in the market at time of reporting).See CFTC criteria here.

- Oil prices reached a 6‑week high. The AUD strengthened on the back of a strong labor‑market report Jul 23, 2026
- EUR/USD Recovers as Dollar Weakens Jul 23, 2026
- Bitcoin rose to $66,000. The New Zealand dollar continues to strengthen Jul 22, 2026
- Inflationary pressure is easing in Canada. In New Zealand, on the contrary, inflation is rising Jul 21, 2026
- GBP/USD Falls After Cabinet Changes Jul 21, 2026
- Geopolitical and macroeconomic conditions continue to pressure market sentiment Jul 20, 2026
- USD/JPY Poised to Continue Gains as Expensive Oil and Lack of Support Weigh on Yen Jul 20, 2026
- COT Metals Charts: Weekly Speculator Bets led by Copper & Steel Jul 18, 2026
- COT Bonds Charts: Weekly Speculator Bets led by 2-Year, SOFR 3M & 5-Year Bonds Jul 18, 2026
- COT Energy Charts: Weekly Speculator Bets led by Brent Oil & Heating Oil Jul 18, 2026