
By InvestMacro | COT | Data Tables | COT Leaders | Downloads | COT Newsletter
Here are the latest charts and statistics for the Commitment of Traders (COT) data published by the Commodities Futures Trading Commission (CFTC).
The latest COT data is updated through Tuesday March 8th and shows a quick view of how large traders (for-profit speculators and commercial entities) were positioned in the futures markets.
Highlighting the COT soft commodities data is the jump in the Sugar futures bets. The speculative net position in the Sugar futures rose sharply this week by the largest one-week amount (+66,537 contracts) in the past one hundred and seventeen weeks, dating back to December 10th of 2019. Over the past year, Sugar speculator bets had remained at a high bullish level with speculator positions reaching a high level of +302,267 contracts in August. The speculator sentiment started to trend lower over the last months of 2021 and fell below the +100,000 contract threshold in February for the first time in over a year. However, Sugar bets have now increased for three consecutive weeks and these gains have pushed the current Sugar speculator standing to the highest level of the past nine weeks at +151,076 contracts.
The soft commodities that saw higher bets this week were Corn (37,095 contracts), Sugar (66,537 contracts), Soybean Oil (6,730 contracts), Soybean Meal (8,421 contracts), Cocoa (4,331 contracts) and Wheat (6,182 contracts).
The soft commodities that saw lower bets this week were Coffee (-9,793 contracts), Soybeans (-2,330 contracts), Live Cattle (-19,472 contracts), Lean Hogs (-9,714 contracts) and Cotton (-4,997 contracts).
Free Reports:
 Sign Up for Our Stock Market Newsletter – Get updated on News, Charts & Rankings of Public Companies when you join our Stocks Newsletter
 Get our Weekly Commitment of Traders Reports - See where the biggest traders (Hedge Funds and Commercial Hedgers) are positioned in the futures markets on a weekly basis.
| Mar-08-2022 | OI | OI-Index | Spec-Net | Spec-Index | Com-Net | COM-Index | Smalls-Net | Smalls-Index |
|---|---|---|---|---|---|---|---|---|
| WTI Crude | 1,896,974 | 5 | 361,665 | 11 | -408,809 | 80 | 47,144 | 81 |
| Gold | 638,502 | 57 | 274,388 | 75 | -306,946 | 24 | 32,558 | 57 |
| Silver | 168,283 | 33 | 52,297 | 74 | -69,609 | 31 | 17,312 | 44 |
| Copper | 198,844 | 26 | 31,819 | 65 | -40,070 | 32 | 8,251 | 73 |
| Palladium | 7,631 | 5 | -272 | 20 | -563 | 73 | 835 | 94 |
| Platinum | 72,496 | 43 | 25,833 | 39 | -32,358 | 63 | 6,525 | 53 |
| Natural Gas | 1,085,853 | 0 | -138,413 | 37 | 97,671 | 62 | 40,742 | 82 |
| Brent | 196,832 | 37 | -11,712 | 92 | 10,814 | 11 | 898 | 21 |
| Heating Oil | 349,618 | 31 | 6,455 | 52 | -32,434 | 37 | 25,979 | 88 |
| Soybeans | 743,566 | 32 | 216,577 | 84 | -189,219 | 21 | -27,358 | 25 |
| Corn | 1,487,815 | 19 | 498,033 | 94 | -456,684 | 7 | -41,349 | 19 |
| Coffee | 224,222 | 3 | 52,113 | 86 | -56,074 | 16 | 3,961 | 16 |
| Sugar | 837,413 | 5 | 151,076 | 68 | -190,856 | 32 | 39,780 | 57 |
| Wheat | 342,996 | 4 | 12,625 | 58 | -5,496 | 35 | -7,129 | 72 |
CORN Futures:
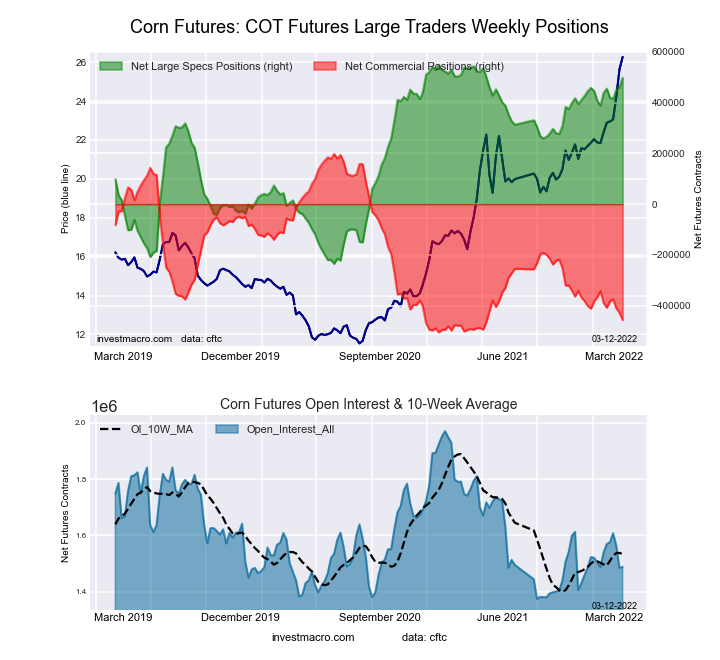 The CORN large speculator standing this week came in at a net position of 498,033 contracts in the data reported through Tuesday. This was a weekly lift of 37,095 contracts from the previous week which had a total of 460,938 net contracts.
This week’s current strength score (the trader positioning range over the past three years, measured from 0 to 100) shows the speculators are currently Bullish-Extreme with a score of 93.7 percent. The commercials are Bearish-Extreme with a score of 6.9 percent and the small traders (not shown in chart) are Bearish-Extreme with a score of 19.2 percent.
| CORN Futures Statistics | SPECULATORS | COMMERCIALS | SMALL TRADERS |
| – Percent of Open Interest Longs: | 37.5 | 45.6 | 8.5 |
| – Percent of Open Interest Shorts: | 4.1 | 76.3 | 11.3 |
| – Net Position: | 498,033 | -456,684 | -41,349 |
| – Gross Longs: | 558,302 | 678,788 | 126,216 |
| – Gross Shorts: | 60,269 | 1,135,472 | 167,565 |
| – Long to Short Ratio: | 9.3 to 1 | 0.6 to 1 | 0.8 to 1 |
| NET POSITION TREND: | |||
| – Strength Index Score (3 Year Range Pct): | 93.7 | 6.9 | 19.2 |
| – Strength Index Reading (3 Year Range): | Bullish-Extreme | Bearish-Extreme | Bearish-Extreme |
| NET POSITION MOVEMENT INDEX: | |||
| – 6-Week Change in Strength Index: | 7.5 | -9.6 | 4.8 |
SUGAR Futures:
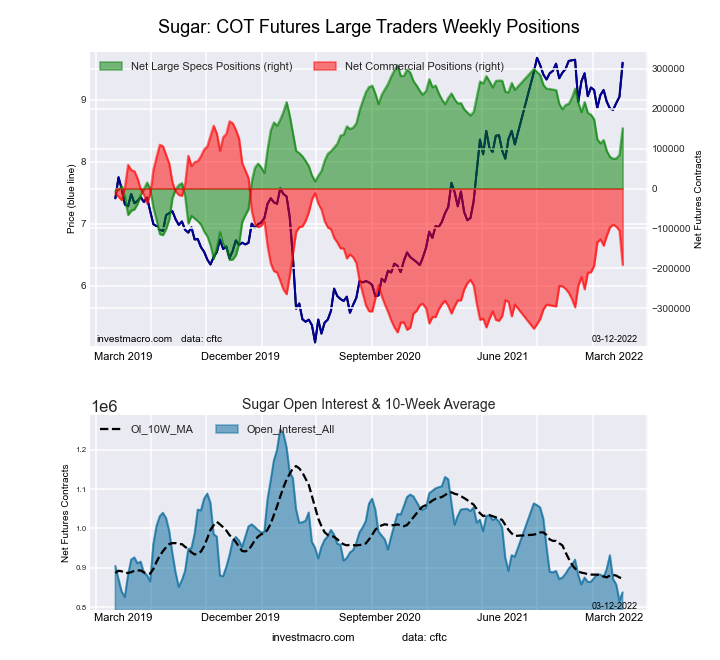 The SUGAR large speculator standing this week came in at a net position of 151,076 contracts in the data reported through Tuesday. This was a weekly boost of 66,537 contracts from the previous week which had a total of 84,539 net contracts.
This week’s current strength score (the trader positioning range over the past three years, measured from 0 to 100) shows the speculators are currently Bullish with a score of 67.7 percent. The commercials are Bearish with a score of 32.0 percent and the small traders (not shown in chart) are Bullish with a score of 57.0 percent.
| SUGAR Futures Statistics | SPECULATORS | COMMERCIALS | SMALL TRADERS |
| – Percent of Open Interest Longs: | 25.5 | 51.3 | 10.7 |
| – Percent of Open Interest Shorts: | 7.5 | 74.1 | 6.0 |
| – Net Position: | 151,076 | -190,856 | 39,780 |
| – Gross Longs: | 213,623 | 429,582 | 89,877 |
| – Gross Shorts: | 62,547 | 620,438 | 50,097 |
| – Long to Short Ratio: | 3.4 to 1 | 0.7 to 1 | 1.8 to 1 |
| NET POSITION TREND: | |||
| – Strength Index Score (3 Year Range Pct): | 67.7 | 32.0 | 57.0 |
| – Strength Index Reading (3 Year Range): | Bullish | Bearish | Bullish |
| NET POSITION MOVEMENT INDEX: | |||
| – 6-Week Change in Strength Index: | 6.1 | -9.1 | 22.4 |
COFFEE Futures:
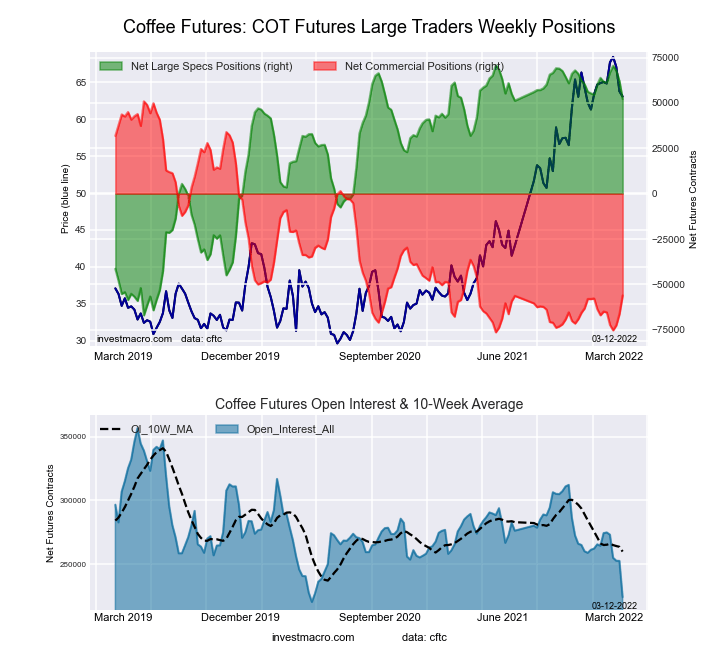 The COFFEE large speculator standing this week came in at a net position of 52,113 contracts in the data reported through Tuesday. This was a weekly decline of -9,793 contracts from the previous week which had a total of 61,906 net contracts.
This week’s current strength score (the trader positioning range over the past three years, measured from 0 to 100) shows the speculators are currently Bullish-Extreme with a score of 86.5 percent. The commercials are Bearish-Extreme with a score of 15.9 percent and the small traders (not shown in chart) are Bearish-Extreme with a score of 15.7 percent.
| COFFEE Futures Statistics | SPECULATORS | COMMERCIALS | SMALL TRADERS |
| – Percent of Open Interest Longs: | 28.7 | 49.0 | 4.7 |
| – Percent of Open Interest Shorts: | 5.4 | 74.0 | 2.9 |
| – Net Position: | 52,113 | -56,074 | 3,961 |
| – Gross Longs: | 64,268 | 109,942 | 10,460 |
| – Gross Shorts: | 12,155 | 166,016 | 6,499 |
| – Long to Short Ratio: | 5.3 to 1 | 0.7 to 1 | 1.6 to 1 |
| NET POSITION TREND: | |||
| – Strength Index Score (3 Year Range Pct): | 86.5 | 15.9 | 15.7 |
| – Strength Index Reading (3 Year Range): | Bullish-Extreme | Bearish-Extreme | Bearish-Extreme |
| NET POSITION MOVEMENT INDEX: | |||
| – 6-Week Change in Strength Index: | -6.9 | 7.0 | 4.5 |
SOYBEANS Futures:
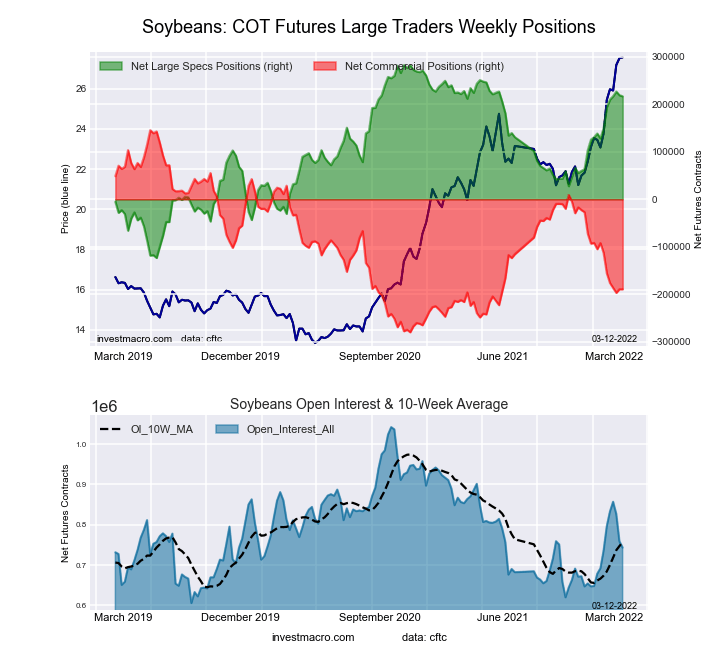 The SOYBEANS large speculator standing this week came in at a net position of 216,577 contracts in the data reported through Tuesday. This was a weekly decline of -2,330 contracts from the previous week which had a total of 218,907 net contracts.
This week’s current strength score (the trader positioning range over the past three years, measured from 0 to 100) shows the speculators are currently Bullish-Extreme with a score of 83.8 percent. The commercials are Bearish with a score of 21.3 percent and the small traders (not shown in chart) are Bearish with a score of 24.8 percent.
| SOYBEANS Futures Statistics | SPECULATORS | COMMERCIALS | SMALL TRADERS |
| – Percent of Open Interest Longs: | 35.4 | 44.5 | 6.5 |
| – Percent of Open Interest Shorts: | 6.2 | 70.0 | 10.2 |
| – Net Position: | 216,577 | -189,219 | -27,358 |
| – Gross Longs: | 263,044 | 330,997 | 48,509 |
| – Gross Shorts: | 46,467 | 520,216 | 75,867 |
| – Long to Short Ratio: | 5.7 to 1 | 0.6 to 1 | 0.6 to 1 |
| NET POSITION TREND: | |||
| – Strength Index Score (3 Year Range Pct): | 83.8 | 21.3 | 24.8 |
| – Strength Index Reading (3 Year Range): | Bullish-Extreme | Bearish | Bearish |
| NET POSITION MOVEMENT INDEX: | |||
| – 6-Week Change in Strength Index: | 16.7 | -18.0 | 14.8 |
SOYBEAN OIL Futures:
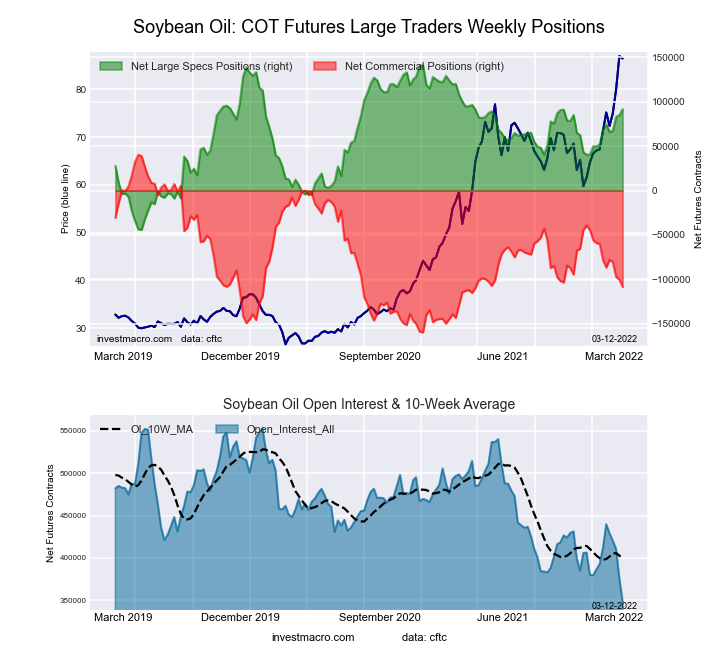 The SOYBEAN OIL large speculator standing this week came in at a net position of 91,682 contracts in the data reported through Tuesday. This was a weekly lift of 6,730 contracts from the previous week which had a total of 84,952 net contracts.
This week’s current strength score (the trader positioning range over the past three years, measured from 0 to 100) shows the speculators are currently Bullish with a score of 73.3 percent. The commercials are Bearish with a score of 25.5 percent and the small traders (not shown in chart) are Bullish with a score of 76.2 percent.
| SOYBEAN OIL Futures Statistics | SPECULATORS | COMMERCIALS | SMALL TRADERS |
| – Percent of Open Interest Longs: | 31.3 | 49.1 | 9.9 |
| – Percent of Open Interest Shorts: | 5.0 | 80.2 | 5.0 |
| – Net Position: | 91,682 | -108,504 | 16,822 |
| – Gross Longs: | 108,997 | 171,067 | 34,341 |
| – Gross Shorts: | 17,315 | 279,571 | 17,519 |
| – Long to Short Ratio: | 6.3 to 1 | 0.6 to 1 | 2.0 to 1 |
| NET POSITION TREND: | |||
| – Strength Index Score (3 Year Range Pct): | 73.3 | 25.5 | 76.2 |
| – Strength Index Reading (3 Year Range): | Bullish | Bearish | Bullish |
| NET POSITION MOVEMENT INDEX: | |||
| – 6-Week Change in Strength Index: | 12.5 | -15.1 | 25.9 |
SOYBEAN MEAL Futures:
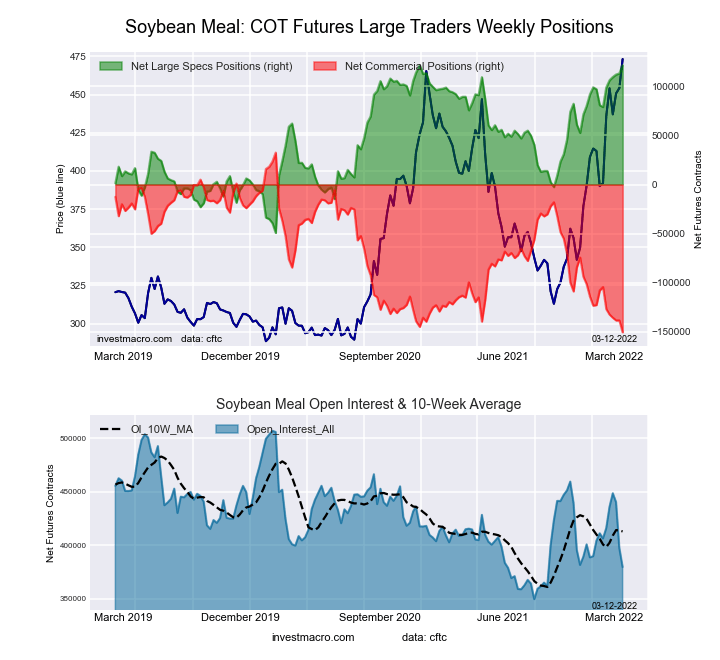 The SOYBEAN MEAL large speculator standing this week came in at a net position of 121,604 contracts in the data reported through Tuesday. This was a weekly increase of 8,421 contracts from the previous week which had a total of 113,183 net contracts.
This week’s current strength score (the trader positioning range over the past three years, measured from 0 to 100) shows the speculators are currently Bullish-Extreme with a score of 100.0 percent. The commercials are Bearish-Extreme with a score of 0.0 percent and the small traders (not shown in chart) are Bullish-Extreme with a score of 86.0 percent.
| SOYBEAN MEAL Futures Statistics | SPECULATORS | COMMERCIALS | SMALL TRADERS |
| – Percent of Open Interest Longs: | 35.2 | 44.7 | 12.0 |
| – Percent of Open Interest Shorts: | 3.1 | 84.3 | 4.3 |
| – Net Position: | 121,604 | -150,565 | 28,961 |
| – Gross Longs: | 133,535 | 169,698 | 45,414 |
| – Gross Shorts: | 11,931 | 320,263 | 16,453 |
| – Long to Short Ratio: | 11.2 to 1 | 0.5 to 1 | 2.8 to 1 |
| NET POSITION TREND: | |||
| – Strength Index Score (3 Year Range Pct): | 100.0 | 0.0 | 86.0 |
| – Strength Index Reading (3 Year Range): | Bullish-Extreme | Bearish-Extreme | Bullish-Extreme |
| NET POSITION MOVEMENT INDEX: | |||
| – 6-Week Change in Strength Index: | 24.9 | -25.2 | 15.0 |
LIVE CATTLE Futures:
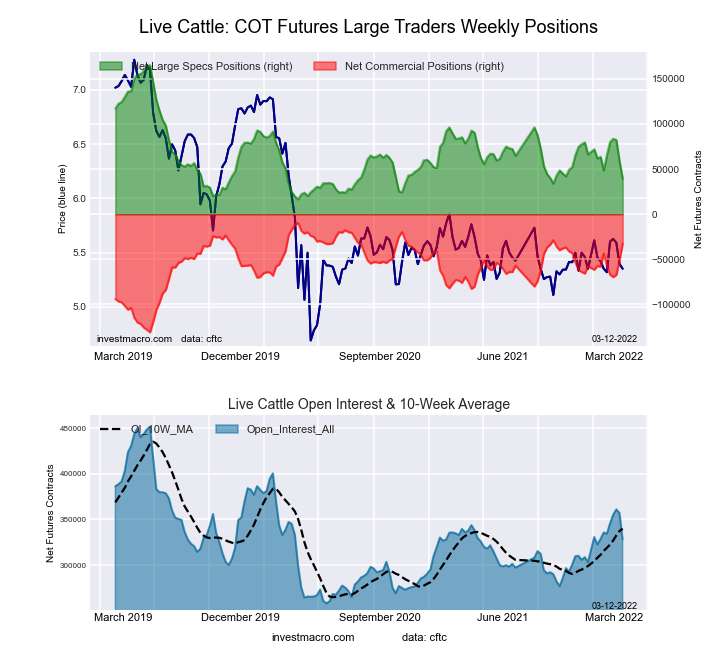 The LIVE CATTLE large speculator standing this week came in at a net position of 39,567 contracts in the data reported through Tuesday. This was a weekly lowering of -19,472 contracts from the previous week which had a total of 59,039 net contracts.
This week’s current strength score (the trader positioning range over the past three years, measured from 0 to 100) shows the speculators are currently Bearish-Extreme with a score of 15.6 percent. The commercials are Bullish-Extreme with a score of 81.0 percent and the small traders (not shown in chart) are Bullish with a score of 70.4 percent.
| LIVE CATTLE Futures Statistics | SPECULATORS | COMMERCIALS | SMALL TRADERS |
| – Percent of Open Interest Longs: | 32.7 | 42.0 | 10.0 |
| – Percent of Open Interest Shorts: | 20.7 | 52.0 | 12.1 |
| – Net Position: | 39,567 | -32,718 | -6,849 |
| – Gross Longs: | 107,356 | 137,930 | 32,744 |
| – Gross Shorts: | 67,789 | 170,648 | 39,593 |
| – Long to Short Ratio: | 1.6 to 1 | 0.8 to 1 | 0.8 to 1 |
| NET POSITION TREND: | |||
| – Strength Index Score (3 Year Range Pct): | 15.6 | 81.0 | 70.4 |
| – Strength Index Reading (3 Year Range): | Bearish-Extreme | Bullish-Extreme | Bullish |
| NET POSITION MOVEMENT INDEX: | |||
| – 6-Week Change in Strength Index: | -6.1 | 8.8 | -4.0 |
LEAN HOGS Futures:
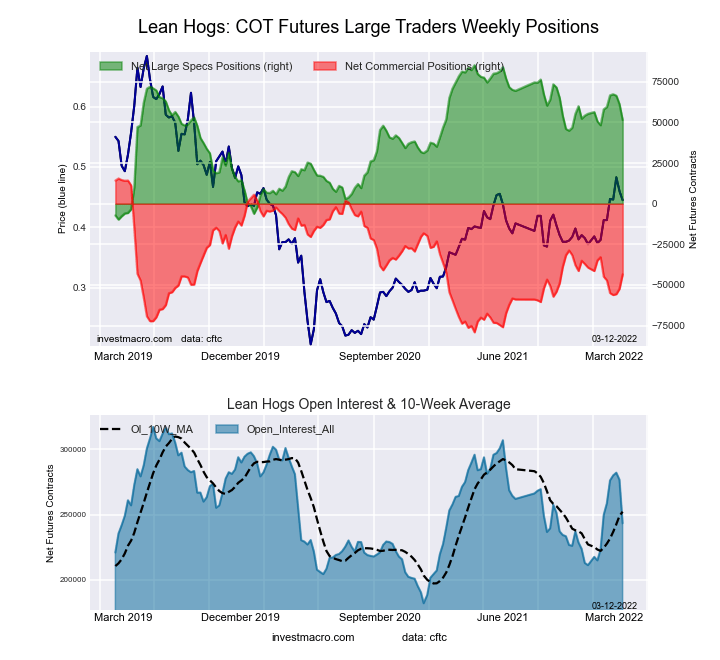 The LEAN HOGS large speculator standing this week came in at a net position of 51,525 contracts in the data reported through Tuesday. This was a weekly fall of -9,714 contracts from the previous week which had a total of 61,239 net contracts.
This week’s current strength score (the trader positioning range over the past three years, measured from 0 to 100) shows the speculators are currently Bullish with a score of 62.9 percent. The commercials are Bearish with a score of 42.1 percent and the small traders (not shown in chart) are Bearish with a score of 45.2 percent.
| LEAN HOGS Futures Statistics | SPECULATORS | COMMERCIALS | SMALL TRADERS |
| – Percent of Open Interest Longs: | 37.4 | 35.4 | 8.9 |
| – Percent of Open Interest Shorts: | 16.2 | 53.2 | 12.2 |
| – Net Position: | 51,525 | -43,476 | -8,049 |
| – Gross Longs: | 90,959 | 86,189 | 21,651 |
| – Gross Shorts: | 39,434 | 129,665 | 29,700 |
| – Long to Short Ratio: | 2.3 to 1 | 0.7 to 1 | 0.7 to 1 |
| NET POSITION TREND: | |||
| – Strength Index Score (3 Year Range Pct): | 62.9 | 42.1 | 45.2 |
| – Strength Index Reading (3 Year Range): | Bullish | Bearish | Bearish |
| NET POSITION MOVEMENT INDEX: | |||
| – 6-Week Change in Strength Index: | -7.1 | 1.7 | 21.9 |
COTTON Futures:
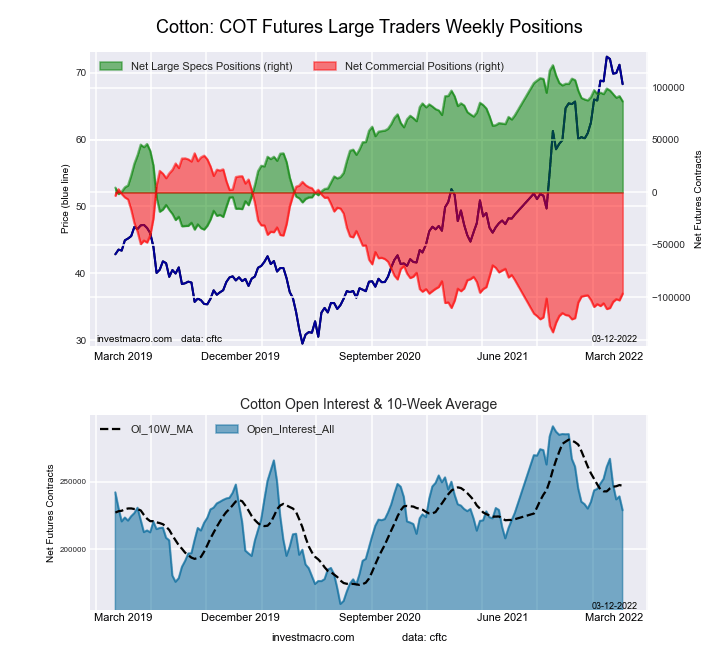 The COTTON large speculator standing this week came in at a net position of 86,831 contracts in the data reported through Tuesday. This was a weekly decline of -4,997 contracts from the previous week which had a total of 91,828 net contracts.
This week’s current strength score (the trader positioning range over the past three years, measured from 0 to 100) shows the speculators are currently Bullish with a score of 78.0 percent. The commercials are Bearish with a score of 21.6 percent and the small traders (not shown in chart) are Bullish with a score of 73.7 percent.
| COTTON Futures Statistics | SPECULATORS | COMMERCIALS | SMALL TRADERS |
| – Percent of Open Interest Longs: | 43.0 | 41.0 | 7.7 |
| – Percent of Open Interest Shorts: | 5.1 | 83.1 | 3.5 |
| – Net Position: | 86,831 | -96,466 | 9,635 |
| – Gross Longs: | 98,415 | 93,704 | 17,706 |
| – Gross Shorts: | 11,584 | 190,170 | 8,071 |
| – Long to Short Ratio: | 8.5 to 1 | 0.5 to 1 | 2.2 to 1 |
| NET POSITION TREND: | |||
| – Strength Index Score (3 Year Range Pct): | 78.0 | 21.6 | 73.7 |
| – Strength Index Reading (3 Year Range): | Bullish | Bearish | Bullish |
| NET POSITION MOVEMENT INDEX: | |||
| – 6-Week Change in Strength Index: | -4.4 | 5.4 | -13.8 |
COCOA Futures:
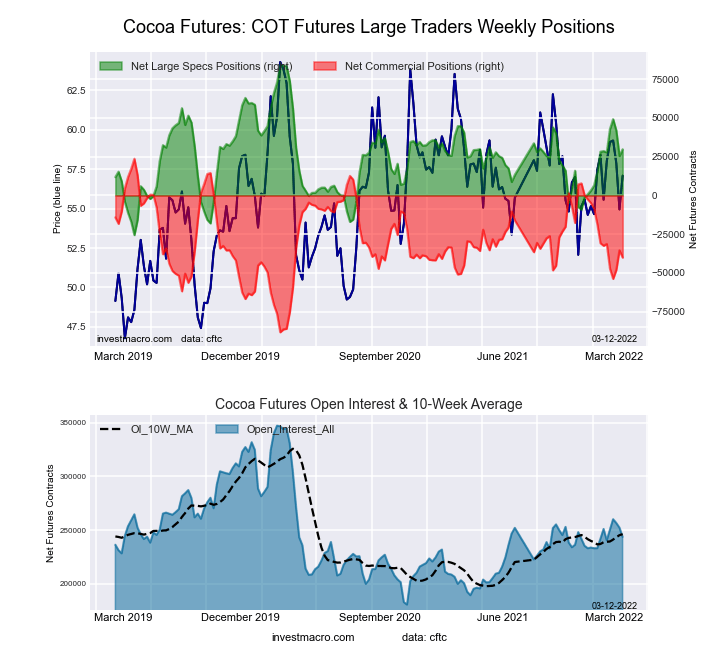 The COCOA large speculator standing this week came in at a net position of 29,762 contracts in the data reported through Tuesday. This was a weekly increase of 4,331 contracts from the previous week which had a total of 25,431 net contracts.
This week’s current strength score (the trader positioning range over the past three years, measured from 0 to 100) shows the speculators are currently Bullish with a score of 50.5 percent. The commercials are Bearish with a score of 43.1 percent and the small traders (not shown in chart) are Bullish-Extreme with a score of 100.0 percent.
| COCOA Futures Statistics | SPECULATORS | COMMERCIALS | SMALL TRADERS |
| – Percent of Open Interest Longs: | 29.0 | 46.0 | 8.1 |
| – Percent of Open Interest Shorts: | 16.8 | 62.5 | 3.8 |
| – Net Position: | 29,762 | -40,088 | 10,326 |
| – Gross Longs: | 70,628 | 112,129 | 19,632 |
| – Gross Shorts: | 40,866 | 152,217 | 9,306 |
| – Long to Short Ratio: | 1.7 to 1 | 0.7 to 1 | 2.1 to 1 |
| NET POSITION TREND: | |||
| – Strength Index Score (3 Year Range Pct): | 50.5 | 43.1 | 100.0 |
| – Strength Index Reading (3 Year Range): | Bullish | Bearish | Bullish-Extreme |
| NET POSITION MOVEMENT INDEX: | |||
| – 6-Week Change in Strength Index: | 1.0 | -6.8 | 61.1 |
WHEAT Futures:
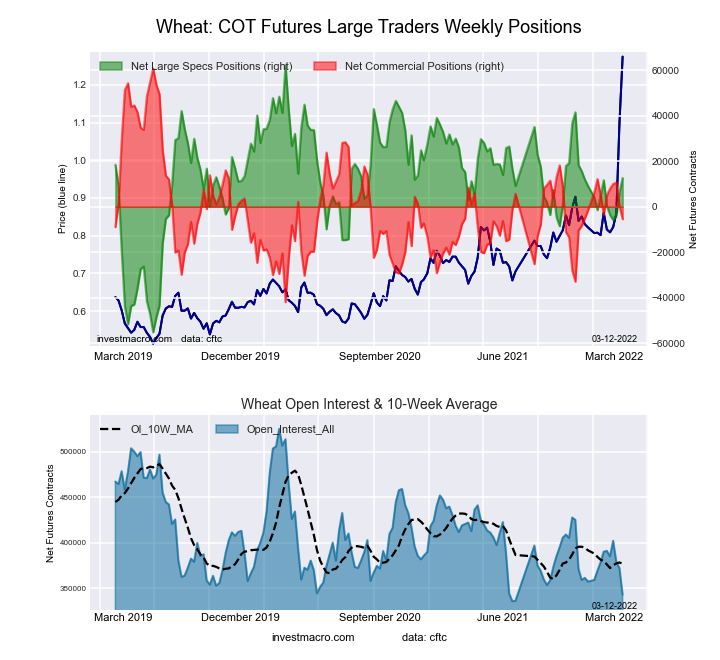 The WHEAT large speculator standing this week came in at a net position of 12,625 contracts in the data reported through Tuesday. This was a weekly gain of 6,182 contracts from the previous week which had a total of 6,443 net contracts.
This week’s current strength score (the trader positioning range over the past three years, measured from 0 to 100) shows the speculators are currently Bullish with a score of 57.8 percent. The commercials are Bearish with a score of 35.5 percent and the small traders (not shown in chart) are Bullish with a score of 71.8 percent.
| WHEAT Futures Statistics | SPECULATORS | COMMERCIALS | SMALL TRADERS |
| – Percent of Open Interest Longs: | 33.0 | 43.2 | 8.9 |
| – Percent of Open Interest Shorts: | 29.3 | 44.8 | 11.0 |
| – Net Position: | 12,625 | -5,496 | -7,129 |
| – Gross Longs: | 113,208 | 148,158 | 30,677 |
| – Gross Shorts: | 100,583 | 153,654 | 37,806 |
| – Long to Short Ratio: | 1.1 to 1 | 1.0 to 1 | 0.8 to 1 |
| NET POSITION TREND: | |||
| – Strength Index Score (3 Year Range Pct): | 57.8 | 35.5 | 71.8 |
| – Strength Index Reading (3 Year Range): | Bullish | Bearish | Bullish |
| NET POSITION MOVEMENT INDEX: | |||
| – 6-Week Change in Strength Index: | 0.8 | -1.9 | 5.1 |
Article By InvestMacro – Receive our weekly COT Reports by Email
*COT Report: The COT data, released weekly to the public each Friday, is updated through the most recent Tuesday (data is 3 days old) and shows a quick view of how large speculators or non-commercials (for-profit traders) were positioned in the futures markets.
The CFTC categorizes trader positions according to commercial hedgers (traders who use futures contracts for hedging as part of the business), non-commercials (large traders who speculate to realize trading profits) and nonreportable traders (usually small traders/speculators) as well as their open interest (contracts open in the market at time of reporting).See CFTC criteria here.

- China has shifted to using its own strategic oil reserves Jun 9, 2026
- GBP/USD Remains Under Pressure Despite Attempts to Recover Jun 9, 2026
- SpaceX IPO: Set for $75 billion liftoff Jun 8, 2026
- On Friday, the American stock market experienced one of the strongest crashes in recent times Jun 8, 2026
- EUR/USD at April Lows: What’s Next for the Pair? Jun 8, 2026
- The ceasefire between Israel and Lebanon has reduced the geopolitical premium Jun 5, 2026
- EUR/USD: All Eyes on Non-Farm Payrolls Jun 5, 2026
- The escalation of the conflict in the Middle East put pressure on US and European stock indices Jun 4, 2026
- Gold Remains Under Pressure, but a Rebound Is Still Possible Jun 4, 2026
- Bitcoin drops below the psychological $70,000 level. The US stock indices hit new record highs Jun 3, 2026