
By CountingPips.com COT Home | Data Tables | Data Downloads | Newsletter
Here are the latest charts and statistics for the Commitment of Traders (COT) data published by the Commodities Futures Trading Commission (CFTC).
The latest COT data is updated through Tuesday August 17 2021 and shows a quick view of how large traders (for-profit speculators and commercial entities) were positioned in the futures markets.
3-Month Eurodollars Futures:
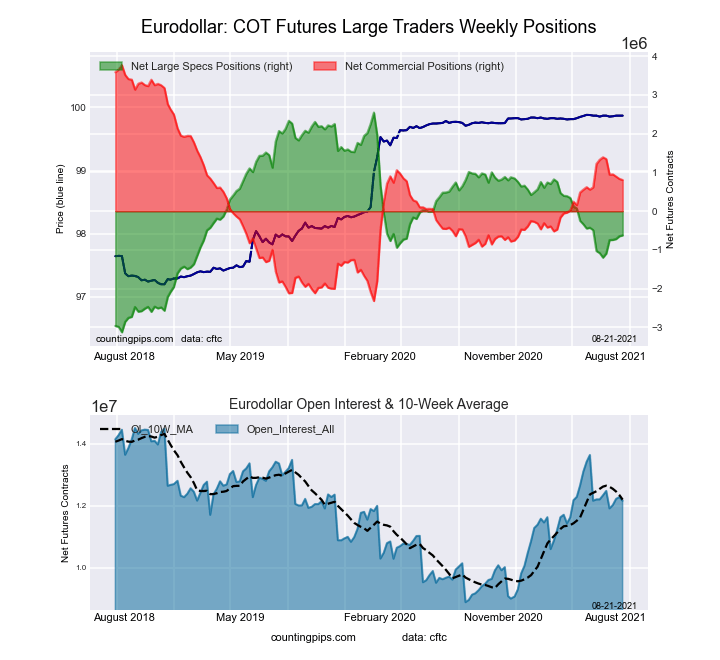 The 3-Month Eurodollars large speculator standing this week was a net position of -623,428 contracts in the data reported through Tuesday. This was a weekly boost of 22,955 contracts from the previous week which had a total of -646,383 net contracts.
This week’s current strength score (the trader positioning range over the past three years, measured from 0 to 100) shows the speculators are currently Bearish with a score of 44.1 percent. The commercials are Bullish with a score of 51.3 percent and the small traders (not shown in chart) are Bullish with a score of 79.2 percent.
| 3-Month Eurodollars Statistics | SPECULATORS | COMMERCIALS | SMALL TRADERS |
| – Percent of Open Interest Longs: | 16.9 | 58.9 | 5.2 |
| – Percent of Open Interest Shorts: | 22.0 | 52.3 | 6.7 |
| – Net Position: | -623,428 | 804,569 | -181,141 |
| – Gross Longs: | 2,048,765 | 7,161,441 | 628,988 |
| – Gross Shorts: | 2,672,193 | 6,356,872 | 810,129 |
| – Long to Short Ratio: | 0.8 to 1 | 1.1 to 1 | 0.8 to 1 |
| NET POSITION TREND: | |||
| – COT Index Score (3 Year Range Pct): | 44.1 | 51.3 | 79.2 |
| – COT Index Reading (3 Year Range): | Bearish | Bullish | Bullish |
| NET POSITION MOVEMENT INDEX: | |||
| – 6-Week Change in Strength Index: | 10.1 | -9.6 | 1.5 |
Free Reports:
 Download Our Metatrader 4 Indicators – Put Our Free MetaTrader 4 Custom Indicators on your charts when you join our Weekly Newsletter
 Get our Weekly Commitment of Traders Reports - See where the biggest traders (Hedge Funds and Commercial Hedgers) are positioned in the futures markets on a weekly basis.
30-Day Federal Funds Futures:
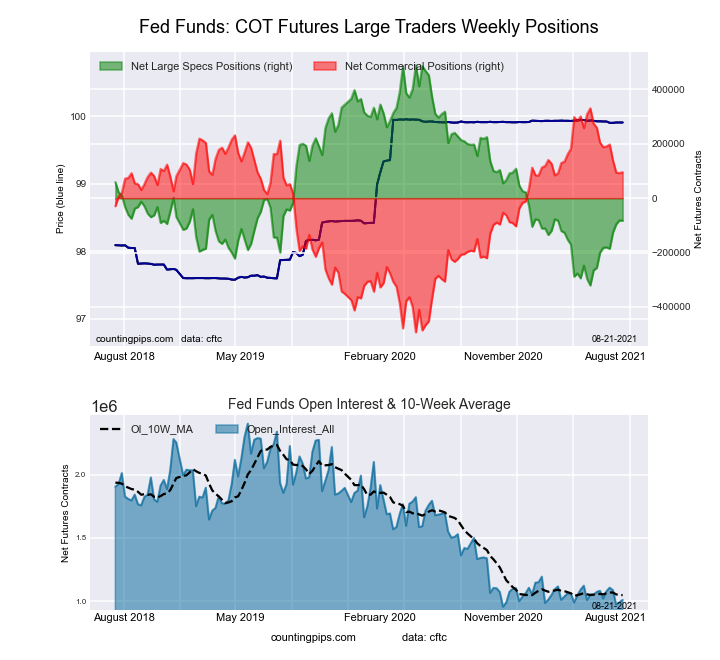 The 30-Day Federal Funds large speculator standing this week was a net position of -83,089 contracts in the data reported through Tuesday. This was a weekly decrease of -1,374 contracts from the previous week which had a total of -81,715 net contracts.
This week’s current strength score (the trader positioning range over the past three years, measured from 0 to 100) shows the speculators are currently Bearish with a score of 29.4 percent. The commercials are Bullish with a score of 71.5 percent and the small traders (not shown in chart) are Bearish with a score of 48.4 percent.
| 30-Day Federal Funds Statistics | SPECULATORS | COMMERCIALS | SMALL TRADERS |
| – Percent of Open Interest Longs: | 5.6 | 74.8 | 2.2 |
| – Percent of Open Interest Shorts: | 13.8 | 65.3 | 3.5 |
| – Net Position: | -83,089 | 95,569 | -12,480 |
| – Gross Longs: | 56,245 | 755,222 | 22,549 |
| – Gross Shorts: | 139,334 | 659,653 | 35,029 |
| – Long to Short Ratio: | 0.4 to 1 | 1.1 to 1 | 0.6 to 1 |
| NET POSITION TREND: | |||
| – COT Index Score (3 Year Range Pct): | 29.4 | 71.5 | 48.4 |
| – COT Index Reading (3 Year Range): | Bearish | Bullish | Bearish |
| NET POSITION MOVEMENT INDEX: | |||
| – 6-Week Change in Strength Index: | 12.3 | -11.2 | -13.6 |
2-Year Treasury Note Futures:
 The 2-Year Treasury Note large speculator standing this week was a net position of 30,197 contracts in the data reported through Tuesday. This was a weekly fall of -4,431 contracts from the previous week which had a total of 34,628 net contracts.
This week’s current strength score (the trader positioning range over the past three years, measured from 0 to 100) shows the speculators are currently Bullish-Extreme with a score of 99.0 percent. The commercials are Bearish-Extreme with a score of 9.1 percent and the small traders (not shown in chart) are Bearish with a score of 38.1 percent.
| 2-Year Treasury Note Statistics | SPECULATORS | COMMERCIALS | SMALL TRADERS |
| – Percent of Open Interest Longs: | 21.2 | 69.0 | 7.8 |
| – Percent of Open Interest Shorts: | 19.7 | 71.2 | 7.1 |
| – Net Position: | 30,197 | -43,298 | 13,101 |
| – Gross Longs: | 418,052 | 1,360,604 | 153,083 |
| – Gross Shorts: | 387,855 | 1,403,902 | 139,982 |
| – Long to Short Ratio: | 1.1 to 1 | 1.0 to 1 | 1.1 to 1 |
| NET POSITION TREND: | |||
| – COT Index Score (3 Year Range Pct): | 99.0 | 9.1 | 38.1 |
| – COT Index Reading (3 Year Range): | Bullish-Extreme | Bearish-Extreme | Bearish |
| NET POSITION MOVEMENT INDEX: | |||
| – 6-Week Change in Strength Index: | 50.6 | -46.9 | 8.6 |
5-Year Treasury Note Futures:
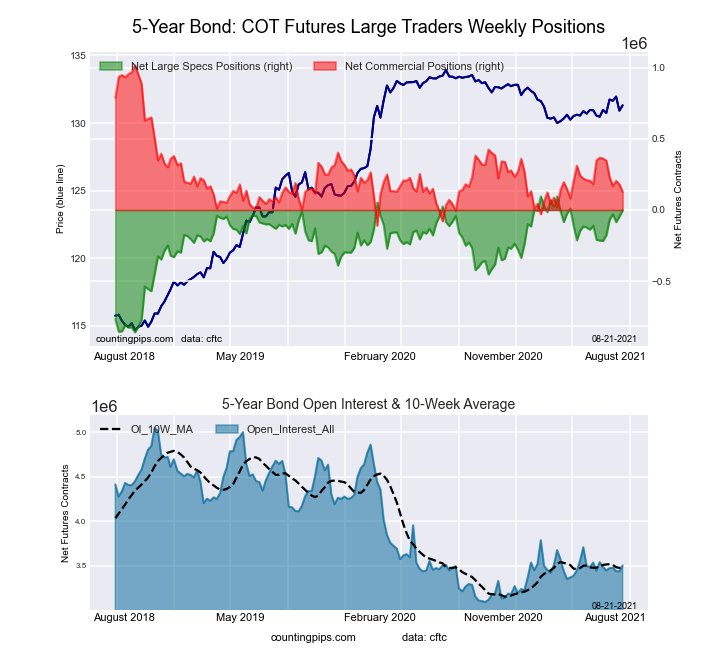 The 5-Year Treasury Note large speculator standing this week was a net position of -2,082 contracts in the data reported through Tuesday. This was a weekly lift of 43,876 contracts from the previous week which had a total of -45,958 net contracts.
This week’s current strength score (the trader positioning range over the past three years, measured from 0 to 100) shows the speculators are currently Bullish-Extreme with a score of 89.8 percent. The commercials are Bearish with a score of 21.0 percent and the small traders (not shown in chart) are Bearish-Extreme with a score of 18.4 percent.
| 5-Year Treasury Note Statistics | SPECULATORS | COMMERCIALS | SMALL TRADERS |
| – Percent of Open Interest Longs: | 12.8 | 74.9 | 8.9 |
| – Percent of Open Interest Shorts: | 12.8 | 71.3 | 12.5 |
| – Net Position: | -2,082 | 126,967 | -124,885 |
| – Gross Longs: | 447,419 | 2,627,057 | 313,260 |
| – Gross Shorts: | 449,501 | 2,500,090 | 438,145 |
| – Long to Short Ratio: | 1.0 to 1 | 1.1 to 1 | 0.7 to 1 |
| NET POSITION TREND: | |||
| – COT Index Score (3 Year Range Pct): | 89.8 | 21.0 | 18.4 |
| – COT Index Reading (3 Year Range): | Bullish-Extreme | Bearish | Bearish-Extreme |
| NET POSITION MOVEMENT INDEX: | |||
| – 6-Week Change in Strength Index: | 22.5 | -20.8 | 8.2 |
10-Year Treasury Note Futures:
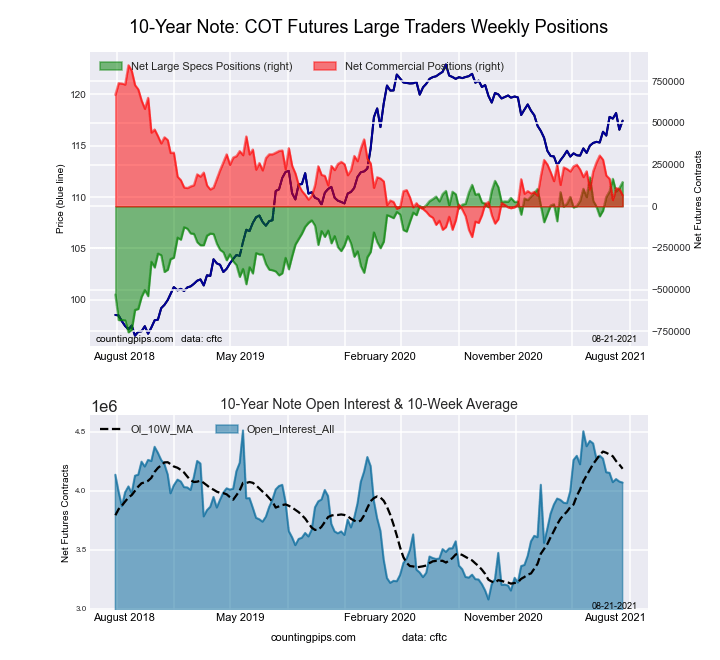 The 10-Year Treasury Note large speculator standing this week was a net position of 145,216 contracts in the data reported through Tuesday. This was a weekly boost of 36,407 contracts from the previous week which had a total of 108,809 net contracts.
This week’s current strength score (the trader positioning range over the past three years, measured from 0 to 100) shows the speculators are currently Bullish-Extreme with a score of 97.0 percent. The commercials are Bearish with a score of 24.2 percent and the small traders (not shown in chart) are Bearish-Extreme with a score of 18.5 percent.
| 10-Year Treasury Note Statistics | SPECULATORS | COMMERCIALS | SMALL TRADERS |
| – Percent of Open Interest Longs: | 22.0 | 67.4 | 9.0 |
| – Percent of Open Interest Shorts: | 18.4 | 65.8 | 14.1 |
| – Net Position: | 145,216 | 65,390 | -210,606 |
| – Gross Longs: | 895,445 | 2,741,764 | 364,476 |
| – Gross Shorts: | 750,229 | 2,676,374 | 575,082 |
| – Long to Short Ratio: | 1.2 to 1 | 1.0 to 1 | 0.6 to 1 |
| NET POSITION TREND: | |||
| – COT Index Score (3 Year Range Pct): | 97.0 | 24.2 | 18.5 |
| – COT Index Reading (3 Year Range): | Bullish-Extreme | Bearish | Bearish-Extreme |
| NET POSITION MOVEMENT INDEX: | |||
| – 6-Week Change in Strength Index: | 18.4 | -20.8 | 11.6 |
Ultra 10-Year Notes Futures:
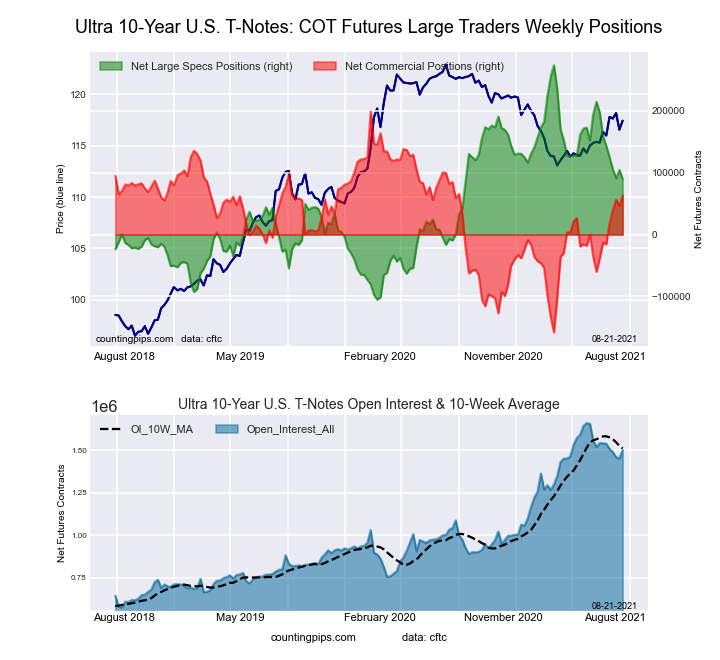 The Ultra 10-Year Notes large speculator standing this week was a net position of 89,783 contracts in the data reported through Tuesday. This was a weekly lowering of -14,662 contracts from the previous week which had a total of 104,445 net contracts.
This week’s current strength score (the trader positioning range over the past three years, measured from 0 to 100) shows the speculators are currently Bullish with a score of 51.5 percent. The commercials are Bullish with a score of 62.0 percent and the small traders (not shown in chart) are Bearish-Extreme with a score of 4.5 percent.
| Ultra 10-Year Notes Statistics | SPECULATORS | COMMERCIALS | SMALL TRADERS |
| – Percent of Open Interest Longs: | 14.5 | 73.9 | 8.8 |
| – Percent of Open Interest Shorts: | 8.5 | 69.7 | 19.0 |
| – Net Position: | 89,783 | 63,177 | -152,960 |
| – Gross Longs: | 217,690 | 1,108,556 | 132,048 |
| – Gross Shorts: | 127,907 | 1,045,379 | 285,008 |
| – Long to Short Ratio: | 1.7 to 1 | 1.1 to 1 | 0.5 to 1 |
| NET POSITION TREND: | |||
| – COT Index Score (3 Year Range Pct): | 51.5 | 62.0 | 4.5 |
| – COT Index Reading (3 Year Range): | Bullish | Bullish | Bearish-Extreme |
| NET POSITION MOVEMENT INDEX: | |||
| – 6-Week Change in Strength Index: | -18.3 | 21.4 | -5.3 |
US Treasury Bonds Futures:
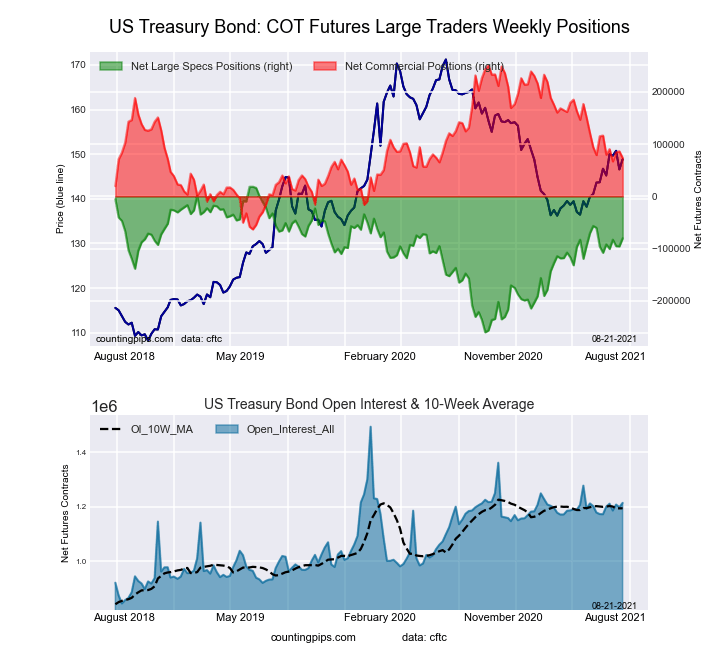 The US Treasury Bonds large speculator standing this week was a net position of -80,205 contracts in the data reported through Tuesday. This was a weekly boost of 15,432 contracts from the previous week which had a total of -95,637 net contracts.
This week’s current strength score (the trader positioning range over the past three years, measured from 0 to 100) shows the speculators are currently Bullish with a score of 64.6 percent. The commercials are Bearish with a score of 43.5 percent and the small traders (not shown in chart) are Bullish with a score of 58.0 percent.
| US Treasury Bonds Statistics | SPECULATORS | COMMERCIALS | SMALL TRADERS |
| – Percent of Open Interest Longs: | 11.9 | 71.3 | 15.2 |
| – Percent of Open Interest Shorts: | 18.5 | 65.2 | 14.6 |
| – Net Position: | -80,205 | 73,365 | 6,840 |
| – Gross Longs: | 144,224 | 865,340 | 184,410 |
| – Gross Shorts: | 224,429 | 791,975 | 177,570 |
| – Long to Short Ratio: | 0.6 to 1 | 1.1 to 1 | 1.0 to 1 |
| NET POSITION TREND: | |||
| – COT Index Score (3 Year Range Pct): | 64.6 | 43.5 | 58.0 |
| – COT Index Reading (3 Year Range): | Bullish | Bearish | Bullish |
| NET POSITION MOVEMENT INDEX: | |||
| – 6-Week Change in Strength Index: | 10.0 | -13.6 | 12.0 |
Ultra US Treasury Bonds Futures:
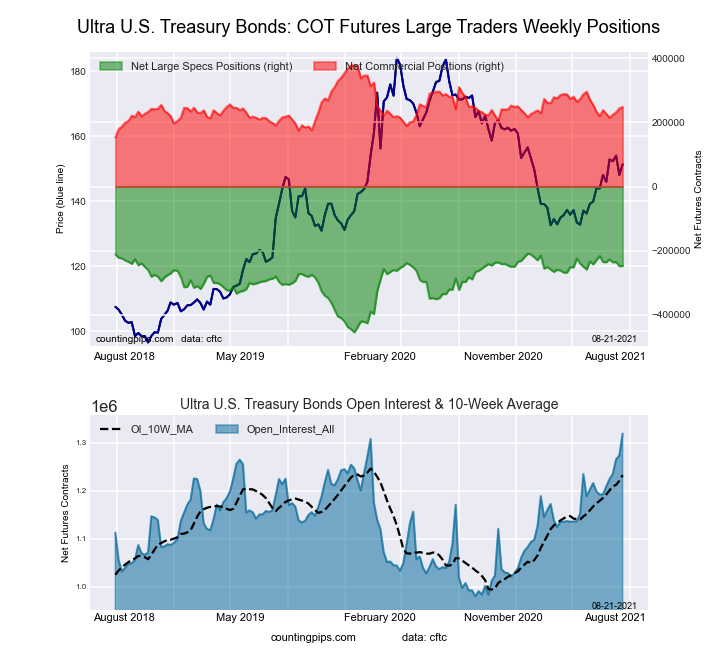 The Ultra US Treasury Bonds large speculator standing this week was a net position of -247,347 contracts in the data reported through Tuesday. This was a weekly gain of 580 contracts from the previous week which had a total of -247,927 net contracts.
This week’s current strength score (the trader positioning range over the past three years, measured from 0 to 100) shows the speculators are currently Bullish-Extreme with a score of 84.3 percent. The commercials are Bearish with a score of 42.1 percent and the small traders (not shown in chart) are Bearish with a score of 27.9 percent.
| Ultra US Treasury Bonds Statistics | SPECULATORS | COMMERCIALS | SMALL TRADERS |
| – Percent of Open Interest Longs: | 9.1 | 75.6 | 11.4 |
| – Percent of Open Interest Shorts: | 27.8 | 56.8 | 11.5 |
| – Net Position: | -247,347 | 247,849 | -502 |
| – Gross Longs: | 119,649 | 997,296 | 150,871 |
| – Gross Shorts: | 366,996 | 749,447 | 151,373 |
| – Long to Short Ratio: | 0.3 to 1 | 1.3 to 1 | 1.0 to 1 |
| NET POSITION TREND: | |||
| – COT Index Score (3 Year Range Pct): | 84.3 | 42.1 | 27.9 |
| – COT Index Reading (3 Year Range): | Bullish-Extreme | Bearish | Bearish |
| NET POSITION MOVEMENT INDEX: | |||
| – 6-Week Change in Strength Index: | -5.0 | 4.4 | 1.7 |
Article By CountingPips.com – Receive our weekly COT Reports by Email
*COT Report: The COT data, released weekly to the public each Friday, is updated through the most recent Tuesday (data is 3 days old) and shows a quick view of how large speculators or non-commercials (for-profit traders) were positioned in the futures markets.
The CFTC categorizes trader positions according to commercial hedgers (traders who use futures contracts for hedging as part of the business), non-commercials (large traders who speculate to realize trading profits) and nonreportable traders (usually small traders/speculators).
Find CFTC criteria here: (http://www.cftc.gov/MarketReports/CommitmentsofTraders/ExplanatoryNotes/index.htm).

- RoboForex Brings Full-Scale Trading to Telegram Jul 7, 2026
- Your Bourse Integrates TradingView Charts and Trading Platform Library with Trade Server Jul 7, 2026
- Yen Still Under Pressure: Markets Await Action from Authorities Jul 7, 2026
- Germany’s DAX Index has updated its all‑time high. OPEC+ countries have agreed to increase production Jul 7, 2026
- Oil prices have stabilized. The Canadian dollar continues to trade near yearly lows. Jul 6, 2026
- EUR/USD in a Narrow Range: Focus on Fed Minutes Jul 6, 2026
- Oil prices have fallen to pre‑war levels. AI companies continue to sell off Jul 3, 2026
- Gold Rises Sharply as Markets Reassess Fed Rate Outlook Jul 3, 2026
- The Eurozone has shown a significant slowdown in inflation. Australia has recorded its largest trade deficit since 2015 Jul 2, 2026
- Natural gas prices are rising amid increasing electricity consumption Jul 1, 2026