
By InvestMacro
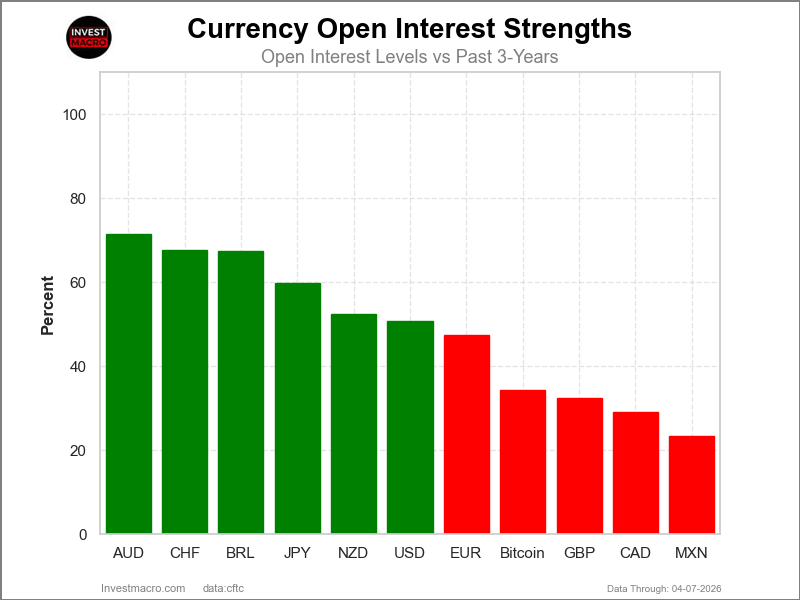
Open Interest (OI) is the amount of contracts that are currently live in the marketplace. OI Strength shows the current strength compared to the past 3-years.
Here are the latest charts and statistics for the Commitment of Traders (COT) data published by the Commodities Futures Trading Commission (CFTC).
The latest COT data is updated through Tuesday April 7th and shows a quick view of how large market participants (for-profit speculators and commercial traders) were positioned in the futures markets. All currency positions are in direct relation to the US dollar where, for example, a bet for the euro is a bet that the euro will rise versus the dollar while a bet against the euro will be a bet that the euro will decline versus the dollar.
Weekly Speculator Changes led by Bitcoin & US Dollar Index
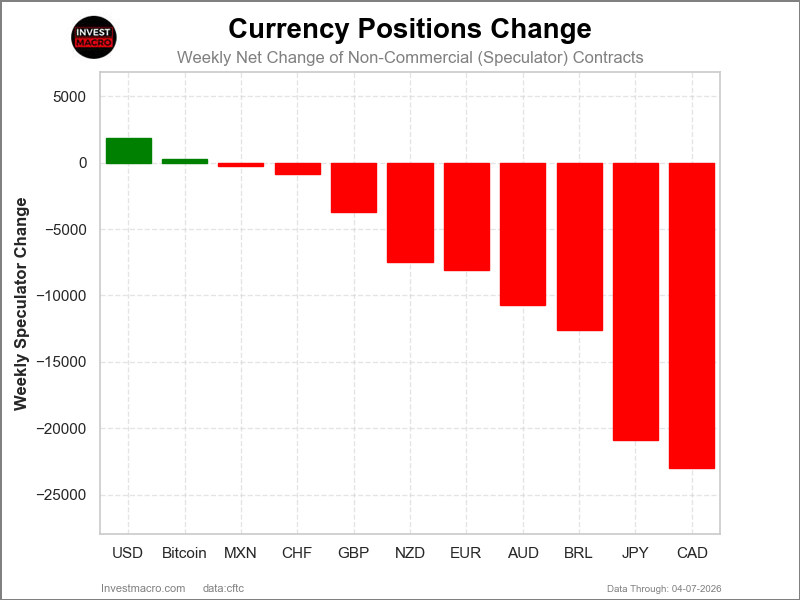
The COT currency market speculator bets were overall decisively lower this week as just two out of the eleven currency markets we cover had higher positioning while the other nine markets had lower speculator contracts.
Free Reports:
 Download Our Metatrader 4 Indicators – Put Our Free MetaTrader 4 Custom Indicators on your charts when you join our Weekly Newsletter
 Get our Weekly Commitment of Traders Reports - See where the biggest traders (Hedge Funds and Commercial Hedgers) are positioned in the futures markets on a weekly basis.
Leading the gains for the currency markets was the US Dollar Index (1,830 contracts) with Bitcoin (287 contracts) also showing a positive week.
The currencies seeing declines in speculator bets on the week were the Canadian Dollar (-22,964 contracts), the Japanese Yen (-20,870 contracts), the Brazilian Real (-12,616 contracts), the Australian Dollar (-10,693 contracts), the EuroFX (-8,048 contracts), the New Zealand Dollar (-7,487 contracts), the British Pound (-3,689 contracts), the Swiss Franc (-823 contracts), and with the Mexican Peso (-213 contracts) also registering lower bets on the week.
Large Currency Speculators Drop Euro Bets fall into Bearish Territory
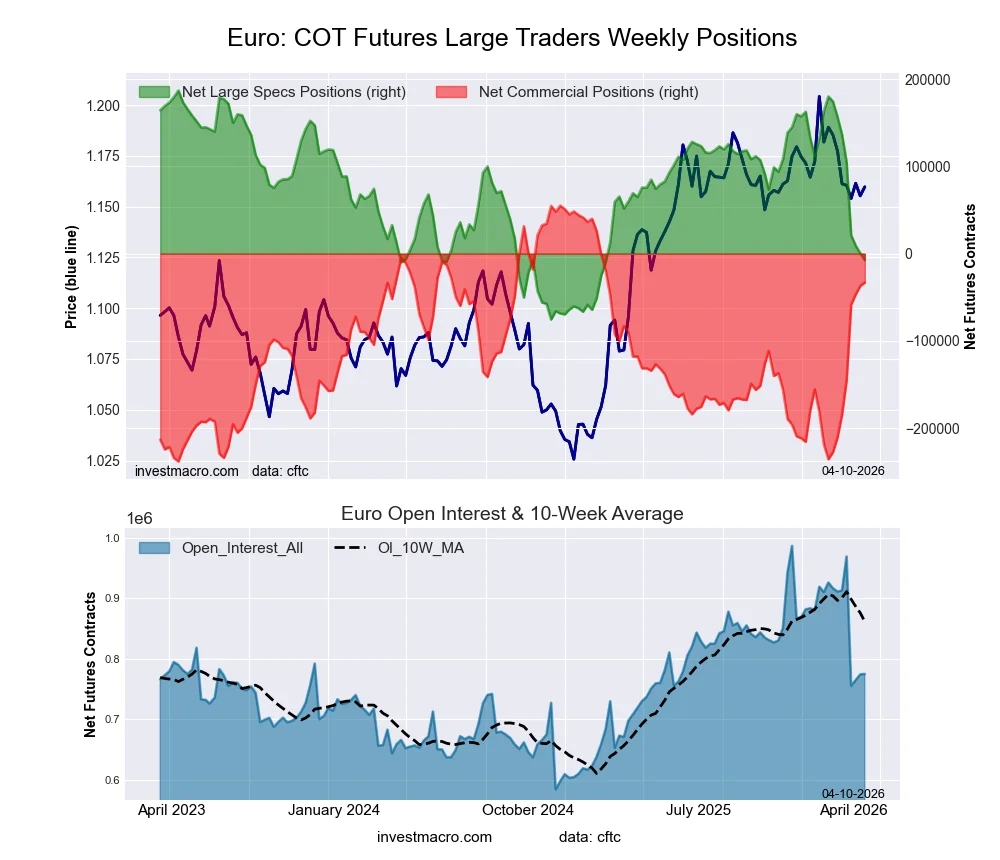
Highlighting the Currencies speculator positioning this week was the weakness in the Euro speculator positions. Euro bets fell this week by -8,048 contracts and this was the eighth consecutive week that the Euro speculator positions declined. This has been a swift turnaround for the Euro, coming from a strong bullish position into a new negative bearish level. The speculator bets were as high as +180,305 contracts on February 10th and have fallen all the way to this week’s new negative position of -7,541 contracts. This is an eight-week total decline by -187,846 net positions and marks the first bearish position in the Euro speculator positions since March 4, 2025, a span of 57 weeks.
The Euro sentiment has sold off sharply, but in the Foreign Exchange markets, the Euro price has not fared too badly and closed this week at 1.1766. Euro positions have now been in a range dating back to June 2025 between 1.1500 on the downside to a topside resistance level of 1.1935 approximately. We’ve not seen a clear break of these two levels since June.
The Canadian Dollar also saw speculator weakness again this week and fell by over -22,000 contracts. This is the fourth week of bearish contracts for the Canadian Dollar positioning and has now pushed the overall net position to -55,648 net contracts, which marks the most bearish position since December 23rd. Canadian Dollar contracts had seen an overall bullish level from February 3rd until March 17th of this year before retreating back into bearish territory. In the Foreign Exchange markets, the Canadian Dollar rebounded this week after falling for four consecutive weeks and closed out the week at the exchange rate (against the US Dollar) of 0.7252. The Canadian Dollar is currently under its 200-week moving average and is trading in an ascending triangle pattern with a topside resistance of around 0.7400 while support underneath can be found at 0.7200.
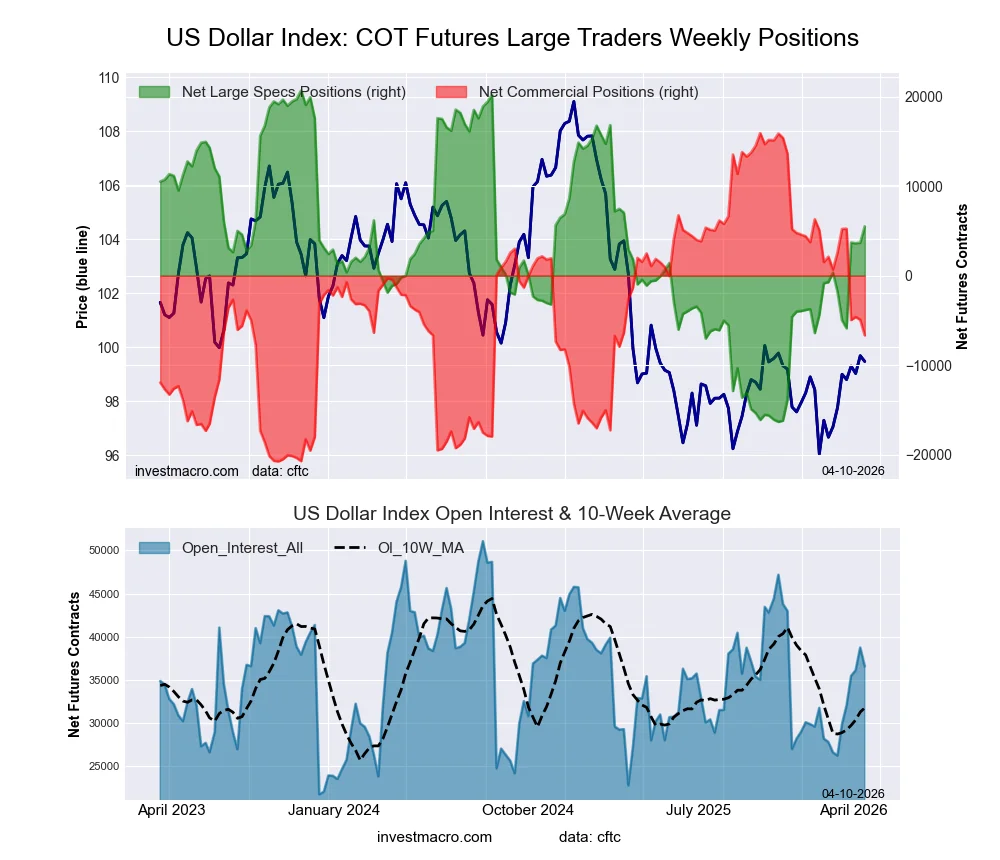
The US Dollar Index saw a gain in bullish positions this week for a second consecutive week and for the third time out of the past four weeks. The US Dollar Index has now been in an overall bullish level for the fourth consecutive week and has gone from a position of -5,882 contracts on March 10 to this week’s net position of 5,511 net contracts, which is a change of +11,393 contracts in just the past four weeks. The US Dollar Index pricing, however, has continued to be stuck in a range from 98.00 on the low side to 100.00 on the upside. The DXY has been in this range for the past six weeks, oscillating between the higher side and the lower side, and this week closed out at 98.44.
Bitcoin and the Mexican Peso lead Currency prices this week
In the Currency Markets, Bitcoin, although a cryptocurrency, rose by 6.20% for the week. The Mexican Peso was up by 3.27% over the past five days. Next up, the Brazilian Real advanced by 2.94% on the week, followed by the Australian Dollar and the New Zealand Dollar, which rose by 2.78% and 2.75%, respectively. The British Pound was up by 2.14%, while the Euro also saw a boost of 1.90%. The Swiss Franc advanced higher by 1.54% and was followed by the Canadian Dollar, which saw an increase of 0.77%. The Japanese Yen rounded out the gainers with a 0.30% uptick.
The only market that saw a decline on the week was the US Dollar Index, which fell by -1.54%.
Currencies Data:
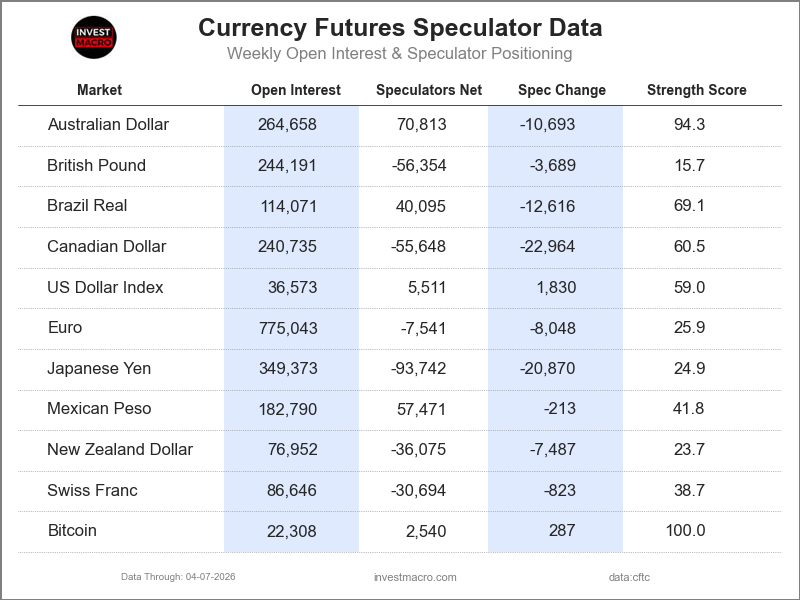
Legend: Open Interest | Speculators Current Net Position | Weekly Specs Change | Specs Strength Score compared to last 3-Years (0-100 range)
Strength Scores led by Bitcoin & Australian Dollar
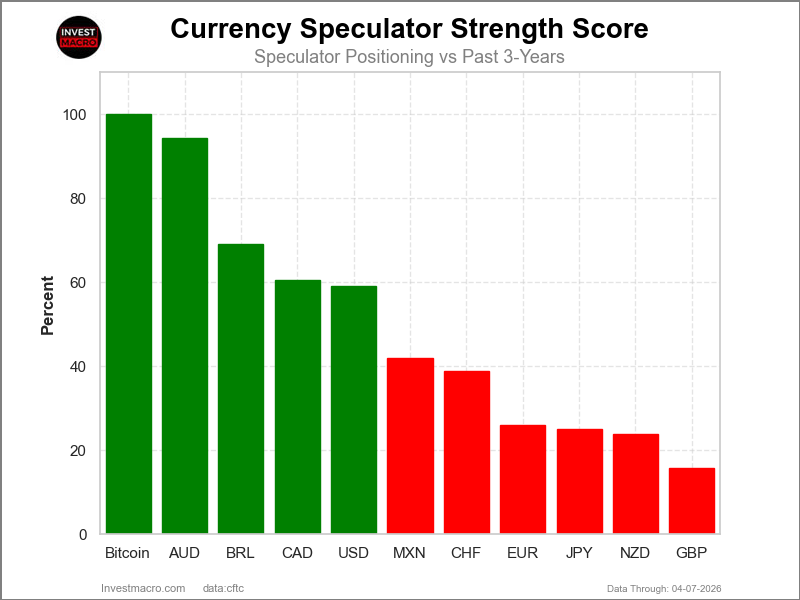
COT Strength Scores (a normalized measure of Speculator positions over a 3-Year range, from 0 to 100 where above 80 is Extreme-Bullish and below 20 is Extreme-Bearish) showed that the Bitcoin (100 percent) and the Australian Dollar (94 percent) lead the currency markets this week. The Brazilian Real (69 percent), Canadian Dollar (60 percent) and the US Dollar Index (59 percent) come in as the next highest in the weekly strength scores.
On the downside, the British Pound (16 percent) comes in at the lowest strength levels currently and are in Extreme-Bearish territory (below 20 percent). The next lowest strength scores are the New Zealand Dollar (24 percent), the Japanese Yen (25 percent) and the EuroFX (26 percent).
3-Year Strength Statistics:
US Dollar Index (59.0 percent) vs US Dollar Index previous week (54.1 percent)
EuroFX (25.9 percent) vs EuroFX previous week (29.0 percent)
British Pound Sterling (15.7 percent) vs British Pound Sterling previous week (17.2 percent)
Japanese Yen (24.9 percent) vs Japanese Yen previous week (30.6 percent)
Swiss Franc (38.7 percent) vs Swiss Franc previous week (40.4 percent)
Canadian Dollar (60.5 percent) vs Canadian Dollar previous week (70.4 percent)
Australian Dollar (94.3 percent) vs Australian Dollar previous week (100.0 percent)
New Zealand Dollar (23.7 percent) vs New Zealand Dollar previous week (32.2 percent)
Mexican Peso (41.8 percent) vs Mexican Peso previous week (41.9 percent)
Brazilian Real (69.1 percent) vs Brazilian Real previous week (78.3 percent)
Bitcoin (100.0 percent) vs Bitcoin previous week (94.3 percent)
Bitcoin & Swiss Franc top the 6-Week Strength Trends
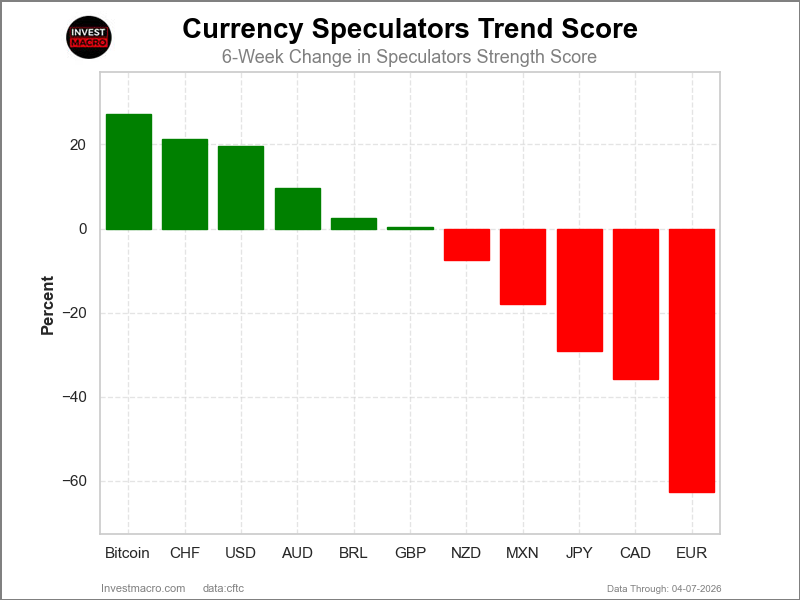
COT Strength Score Trends (or move index, calculates the 6-week changes in strength scores) showed that the Bitcoin (27 percent) and the Swiss Franc (21 percent) lead the past six weeks trends for the currencies. The US Dollar Index (20 percent), the Australian Dollar (10 percent) and the Brazilian Real (2 percent) are the next highest positive movers in the 3-Year trends data.
The EuroFX (-63 percent) leads the downside trend scores currently with the Canadian Dollar (-36 percent), Japanese Yen (-29 percent) and the Mexican Peso (-18 percent) following next with lower trend scores.
3-Year Strength Trends:
US Dollar Index (19.7 percent) vs US Dollar Index previous week (9.1 percent)
EuroFX (-62.6 percent) vs EuroFX previous week (-66.2 percent)
British Pound Sterling (0.3 percent) vs British Pound Sterling previous week (-4.4 percent)
Japanese Yen (-29.0 percent) vs Japanese Yen previous week (-23.6 percent)
Swiss Franc (21.3 percent) vs Swiss Franc previous week (22.3 percent)
Canadian Dollar (-35.8 percent) vs Canadian Dollar previous week (-25.2 percent)
Australian Dollar (9.6 percent) vs Australian Dollar previous week (18.8 percent)
New Zealand Dollar (-7.4 percent) vs New Zealand Dollar previous week (7.3 percent)
Mexican Peso (-18.0 percent) vs Mexican Peso previous week (-18.7 percent)
Brazilian Real (2.5 percent) vs Brazilian Real previous week (13.1 percent)
Bitcoin (27.2 percent) vs Bitcoin previous week (12.2 percent)
Individual COT Forex Markets:
US Dollar Index Futures:
 Positioning Notes:
- US Dollar Index large speculator standing this week totaled a net position of 5,511 contracts in the data reported through Tuesday.
- Weekly Speculator position increase of 1,830 contracts from the previous week which had a total of 3,681 net contracts.
- This week’s current strength score (range over the past 3 years, measured from 0 to 100) shows the speculators are currently Bullish with a score of 59.0 percent.
- The Commercials are Bearish with a score of 38.4 percent.
- The Small Traders (not shown in chart) are Bullish with a score of 59.3 percent.
Price Trend-Following Model: Weak Uptrend
Our weekly trend-following model classifies the current market price position as: Weak Uptrend.
| US DOLLAR INDEX Statistics | SPECULATORS | COMMERCIALS | SMALL TRADERS |
| – Percent of Open Interest Longs: | 63.1 | 21.7 | 9.6 |
| – Percent of Open Interest Shorts: | 48.0 | 39.9 | 6.4 |
| – Net Position: | 5,511 | -6,675 | 1,164 |
| – Gross Longs: | 23,084 | 7,926 | 3,501 |
| – Gross Shorts: | 17,573 | 14,601 | 2,337 |
| – Long to Short Ratio: | 1.3 to 1 | 0.5 to 1 | 1.5 to 1 |
| NET POSITION TREND: | |||
| – Strength Index Score (3 Year Range Pct): | 59.0 | 38.4 | 59.3 |
| – Strength Index Reading (3 Year Range): | Bullish | Bearish | Bullish |
| NET POSITION MOVEMENT INDEX: | |||
| – 6-Week Change in Strength Index: | 19.7 | -25.2 | 34.2 |
Euro Currency Futures:
 Positioning Notes:
- Euro Currency large speculator standing this week totaled a net position of -7,541 contracts in the data reported through Tuesday.
- Weekly Speculator position lowering of -8,048 contracts from the previous week which had a total of 507 net contracts.
- This week’s current strength score (range over the past 3 years, measured from 0 to 100) shows the speculators are currently Bearish with a score of 25.9 percent.
- The Commercials are Bullish with a score of 69.9 percent.
- The Small Traders (not shown in chart) are Bullish with a score of 60.4 percent.
Price Trend-Following Model: Weak Downtrend
Our weekly trend-following model classifies the current market price position as: Weak Downtrend.
| EURO Currency Statistics | SPECULATORS | COMMERCIALS | SMALL TRADERS |
| – Percent of Open Interest Longs: | 25.9 | 60.0 | 11.0 |
| – Percent of Open Interest Shorts: | 26.9 | 64.2 | 5.7 |
| – Net Position: | -7,541 | -33,150 | 40,691 |
| – Gross Longs: | 200,946 | 464,746 | 85,038 |
| – Gross Shorts: | 208,487 | 497,896 | 44,347 |
| – Long to Short Ratio: | 1.0 to 1 | 0.9 to 1 | 1.9 to 1 |
| NET POSITION TREND: | |||
| – Strength Index Score (3 Year Range Pct): | 25.9 | 69.9 | 60.4 |
| – Strength Index Reading (3 Year Range): | Bearish | Bullish | Bullish |
| NET POSITION MOVEMENT INDEX: | |||
| – 6-Week Change in Strength Index: | -62.6 | 60.6 | -28.2 |
British Pound Sterling Futures:
 Positioning Notes:
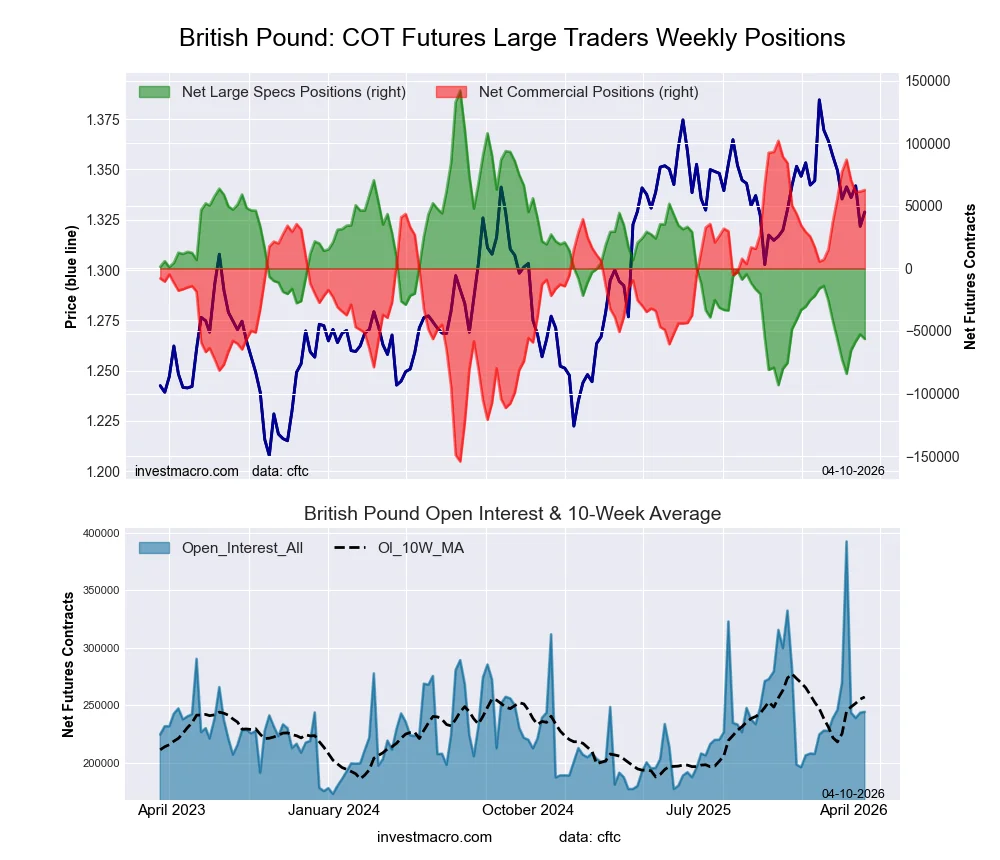
- British Pound Sterling large speculator standing this week totaled a net position of -56,354 contracts in the data reported through Tuesday.
- Weekly Speculator position reduction of -3,689 contracts from the previous week which had a total of -52,665 net contracts.
- This week’s current strength score (range over the past 3 years, measured from 0 to 100) shows the speculators are currently Bearish-Extreme with a score of 15.7 percent.
- The Commercials are Bullish-Extreme with a score of 84.7 percent.
- The Small Traders (not shown in chart) are Bearish with a score of 36.8 percent.
Price Trend-Following Model: Weak Downtrend
Our weekly trend-following model classifies the current market price position as: Weak Downtrend.
| BRITISH POUND Statistics | SPECULATORS | COMMERCIALS | SMALL TRADERS |
| – Percent of Open Interest Longs: | 19.4 | 70.5 | 9.2 |
| – Percent of Open Interest Shorts: | 42.5 | 44.9 | 11.8 |
| – Net Position: | -56,354 | 62,698 | -6,344 |
| – Gross Longs: | 47,344 | 172,233 | 22,515 |
| – Gross Shorts: | 103,698 | 109,535 | 28,859 |
| – Long to Short Ratio: | 0.5 to 1 | 1.6 to 1 | 0.8 to 1 |
| NET POSITION TREND: | |||
| – Strength Index Score (3 Year Range Pct): | 15.7 | 84.7 | 36.8 |
| – Strength Index Reading (3 Year Range): | Bearish-Extreme | Bullish-Extreme | Bearish |
| NET POSITION MOVEMENT INDEX: | |||
| – 6-Week Change in Strength Index: | 0.3 | 2.5 | -18.8 |
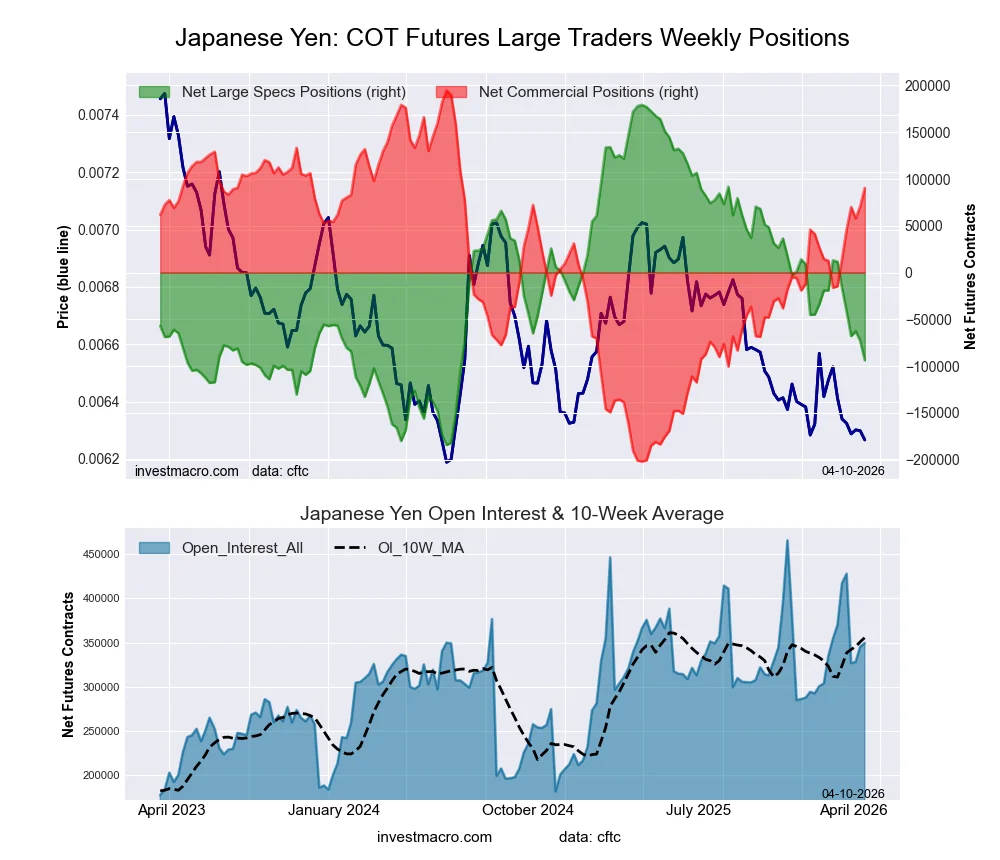
Japanese Yen Futures:
 Positioning Notes:
- Japanese Yen large speculator standing this week totaled a net position of -93,742 contracts in the data reported through Tuesday.
- Weekly Speculator position decline of -20,870 contracts from the previous week which had a total of -72,872 net contracts.
- This week’s current strength score (range over the past 3 years, measured from 0 to 100) shows the speculators are currently Bearish with a score of 24.9 percent.
- The Commercials are Bullish with a score of 73.7 percent.
- The Small Traders (not shown in chart) are Bearish with a score of 45.4 percent.
Price Trend-Following Model: Strong Downtrend
Our weekly trend-following model classifies the current market price position as: Strong Downtrend.
| JAPANESE YEN Statistics | SPECULATORS | COMMERCIALS | SMALL TRADERS |
| – Percent of Open Interest Longs: | 26.2 | 55.0 | 12.1 |
| – Percent of Open Interest Shorts: | 53.0 | 29.1 | 11.1 |
| – Net Position: | -93,742 | 90,396 | 3,346 |
| – Gross Longs: | 91,560 | 192,103 | 42,118 |
| – Gross Shorts: | 185,302 | 101,707 | 38,772 |
| – Long to Short Ratio: | 0.5 to 1 | 1.9 to 1 | 1.1 to 1 |
| NET POSITION TREND: | |||
| – Strength Index Score (3 Year Range Pct): | 24.9 | 73.7 | 45.4 |
| – Strength Index Reading (3 Year Range): | Bearish | Bullish | Bearish |
| NET POSITION MOVEMENT INDEX: | |||
| – 6-Week Change in Strength Index: | -29.0 | 26.5 | 0.4 |
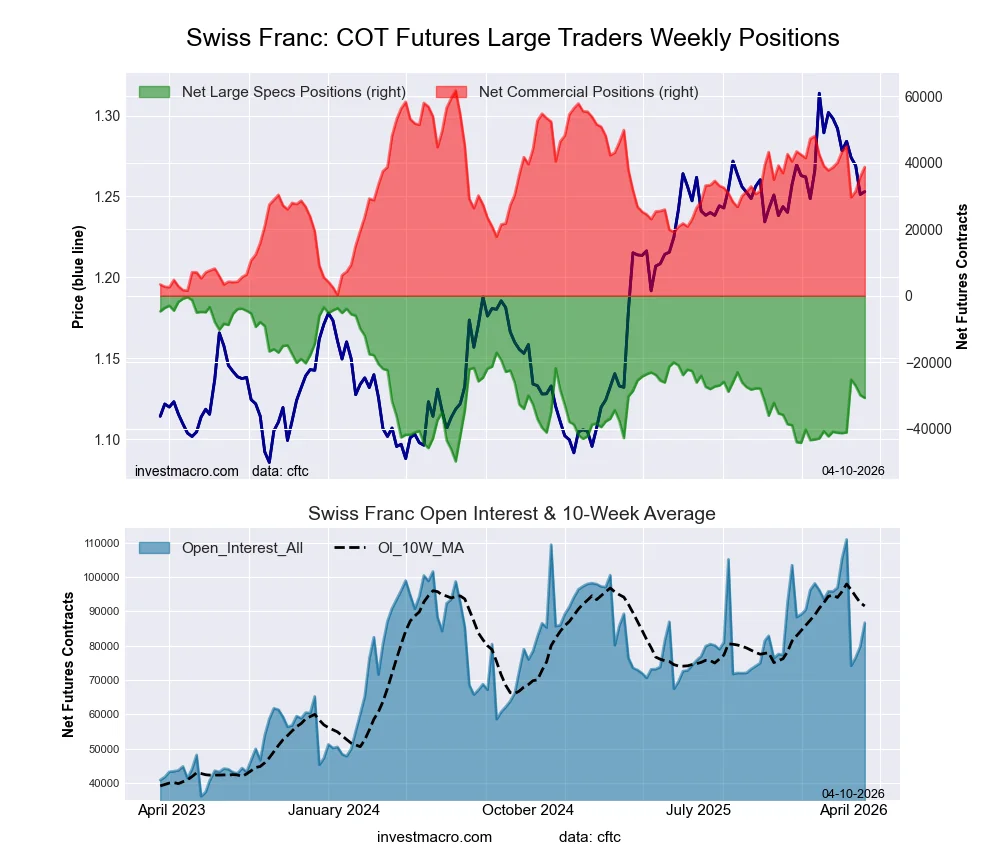
Swiss Franc Futures:
 Positioning Notes:
- Swiss Franc large speculator standing this week totaled a net position of -30,694 contracts in the data reported through Tuesday.
- Weekly Speculator position lowering of -823 contracts from the previous week which had a total of -29,871 net contracts.
- This week’s current strength score (range over the past 3 years, measured from 0 to 100) shows the speculators are currently Bearish with a score of 38.7 percent.
- The Commercials are Bullish with a score of 62.6 percent.
- The Small Traders (not shown in chart) are Bearish with a score of 44.9 percent.
Price Trend-Following Model: Weak Uptrend
Our weekly trend-following model classifies the current market price position as: Weak Uptrend.
| SWISS FRANC Statistics | SPECULATORS | COMMERCIALS | SMALL TRADERS |
| – Percent of Open Interest Longs: | 12.2 | 74.3 | 13.2 |
| – Percent of Open Interest Shorts: | 47.6 | 29.6 | 22.5 |
| – Net Position: | -30,694 | 38,686 | -7,992 |
| – Gross Longs: | 10,586 | 64,346 | 11,477 |
| – Gross Shorts: | 41,280 | 25,660 | 19,469 |
| – Long to Short Ratio: | 0.3 to 1 | 2.5 to 1 | 0.6 to 1 |
| NET POSITION TREND: | |||
| – Strength Index Score (3 Year Range Pct): | 38.7 | 62.6 | 44.9 |
| – Strength Index Reading (3 Year Range): | Bearish | Bullish | Bearish |
| NET POSITION MOVEMENT INDEX: | |||
| – 6-Week Change in Strength Index: | 21.3 | -2.2 | -38.9 |
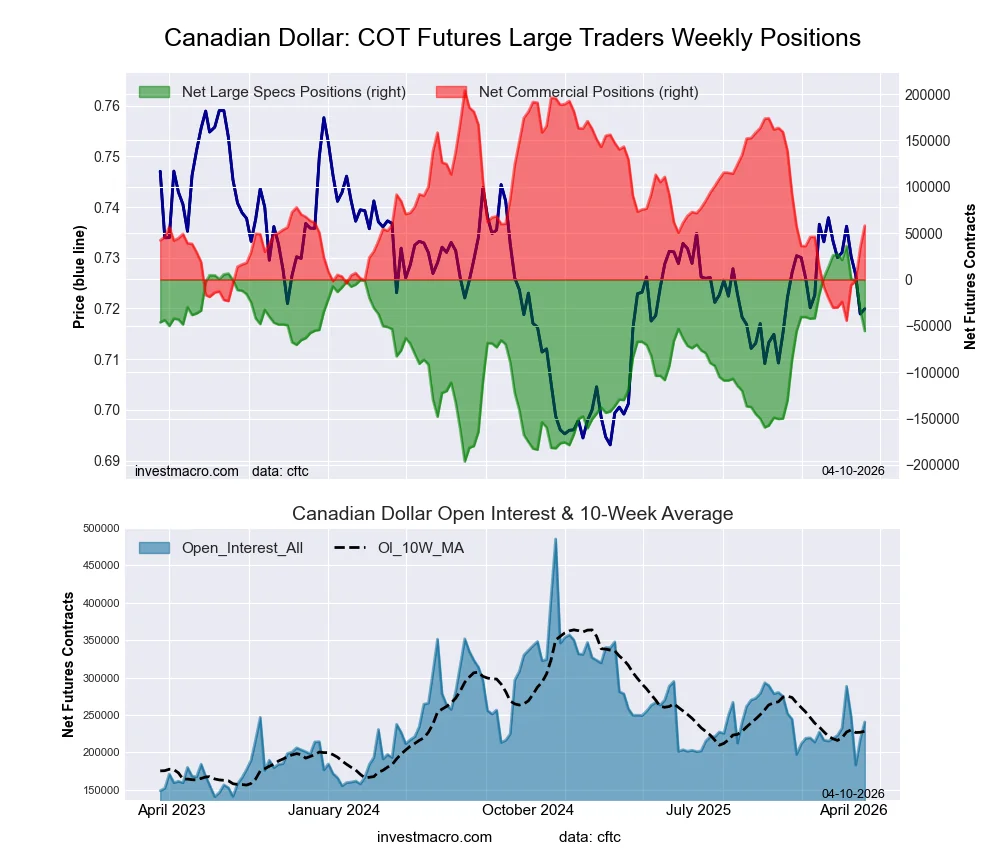
Canadian Dollar Futures:
 Positioning Notes:
- Canadian Dollar large speculator standing this week totaled a net position of -55,648 contracts in the data reported through Tuesday.
- Weekly Speculator position lowering of -22,964 contracts from the previous week which had a total of -32,684 net contracts.
- This week’s current strength score (range over the past 3 years, measured from 0 to 100) shows the speculators are currently Bullish with a score of 60.5 percent.
- The Commercials are Bearish with a score of 41.3 percent.
- The Small Traders (not shown in chart) are Bearish with a score of 38.7 percent.
Price Trend-Following Model: Weak Uptrend
Our weekly trend-following model classifies the current market price position as: Weak Uptrend.
| CANADIAN DOLLAR Statistics | SPECULATORS | COMMERCIALS | SMALL TRADERS |
| – Percent of Open Interest Longs: | 25.2 | 58.2 | 12.9 |
| – Percent of Open Interest Shorts: | 48.3 | 34.0 | 13.9 |
| – Net Position: | -55,648 | 58,038 | -2,390 |
| – Gross Longs: | 60,714 | 139,988 | 31,055 |
| – Gross Shorts: | 116,362 | 81,950 | 33,445 |
| – Long to Short Ratio: | 0.5 to 1 | 1.7 to 1 | 0.9 to 1 |
| NET POSITION TREND: | |||
| – Strength Index Score (3 Year Range Pct): | 60.5 | 41.3 | 38.7 |
| – Strength Index Reading (3 Year Range): | Bullish | Bearish | Bearish |
| NET POSITION MOVEMENT INDEX: | |||
| – 6-Week Change in Strength Index: | -35.8 | 35.6 | -14.2 |
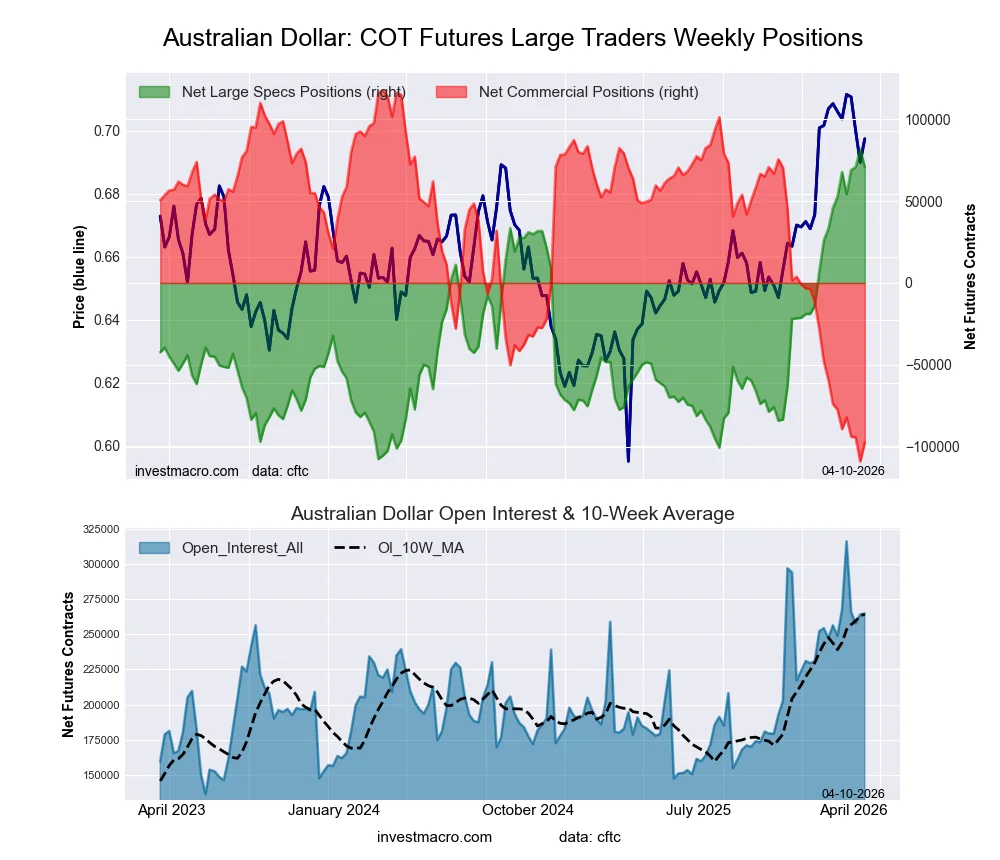
Australian Dollar Futures:
 Positioning Notes:
- Australian Dollar large speculator standing this week totaled a net position of 70,813 contracts in the data reported through Tuesday.
- Weekly Speculator position reduction of -10,693 contracts from the previous week which had a total of 81,506 net contracts.
- This week’s current strength score (range over the past 3 years, measured from 0 to 100) shows the speculators are currently Bullish-Extreme with a score of 94.3 percent.
- The Commercials are Bearish-Extreme with a score of 5.2 percent.
- The Small Traders (not shown in chart) are Bullish-Extreme with a score of 96.7 percent.
Price Trend-Following Model: Uptrend
Our weekly trend-following model classifies the current market price position as: Uptrend.
| AUSTRALIAN DOLLAR Statistics | SPECULATORS | COMMERCIALS | SMALL TRADERS |
| – Percent of Open Interest Longs: | 52.1 | 30.9 | 15.9 |
| – Percent of Open Interest Shorts: | 25.4 | 67.7 | 5.9 |
| – Net Position: | 70,813 | -97,347 | 26,534 |
| – Gross Longs: | 137,959 | 81,872 | 42,080 |
| – Gross Shorts: | 67,146 | 179,219 | 15,546 |
| – Long to Short Ratio: | 2.1 to 1 | 0.5 to 1 | 2.7 to 1 |
| NET POSITION TREND: | |||
| – Strength Index Score (3 Year Range Pct): | 94.3 | 5.2 | 96.7 |
| – Strength Index Reading (3 Year Range): | Bullish-Extreme | Bearish-Extreme | Bullish-Extreme |
| NET POSITION MOVEMENT INDEX: | |||
| – 6-Week Change in Strength Index: | 9.6 | -8.8 | 4.0 |
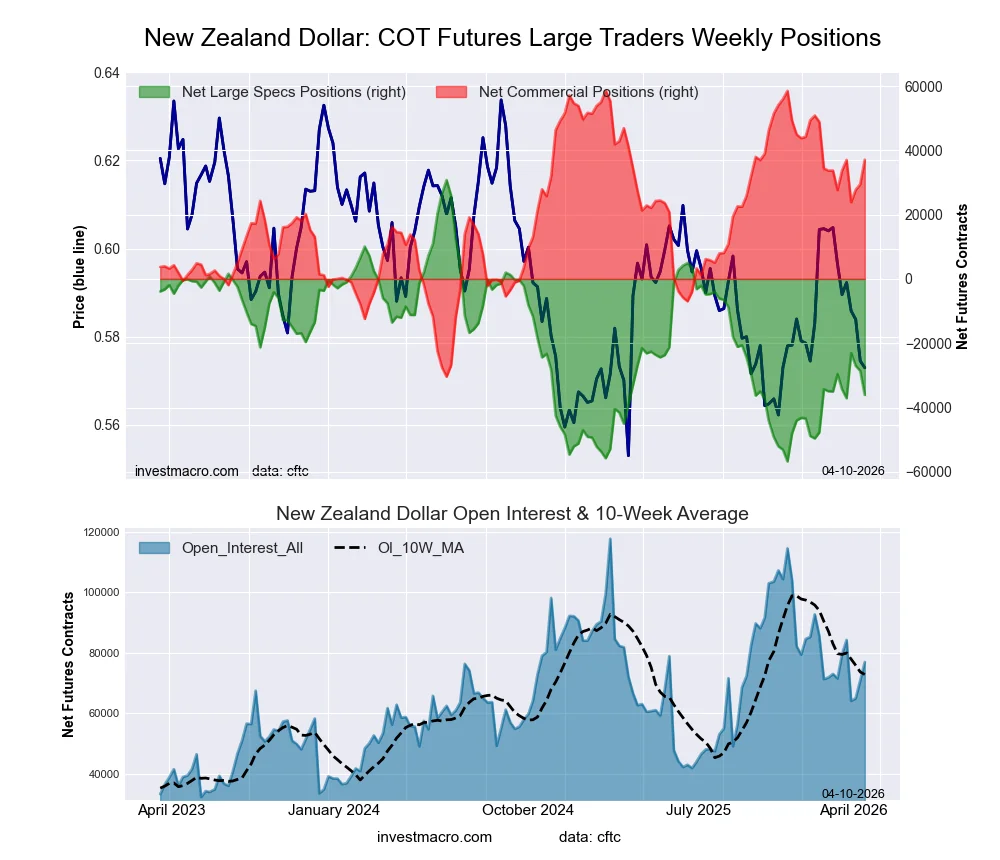
New Zealand Dollar Futures:
 Positioning Notes:
- New Zealand Dollar large speculator standing this week totaled a net position of -36,075 contracts in the data reported through Tuesday.
- Weekly Speculator position reduction of -7,487 contracts from the previous week which had a total of -28,588 net contracts.
- This week’s current strength score (range over the past 3 years, measured from 0 to 100) shows the speculators are currently Bearish with a score of 23.7 percent.
- The Commercials are Bullish with a score of 75.8 percent.
- The Small Traders (not shown in chart) are Bearish with a score of 39.4 percent.
Price Trend-Following Model: Downtrend
Our weekly trend-following model classifies the current market price position as: Downtrend.
| NEW ZEALAND DOLLAR Statistics | SPECULATORS | COMMERCIALS | SMALL TRADERS |
| – Percent of Open Interest Longs: | 16.4 | 77.4 | 5.3 |
| – Percent of Open Interest Shorts: | 63.3 | 29.2 | 6.6 |
| – Net Position: | -36,075 | 37,071 | -996 |
| – Gross Longs: | 12,636 | 59,568 | 4,103 |
| – Gross Shorts: | 48,711 | 22,497 | 5,099 |
| – Long to Short Ratio: | 0.3 to 1 | 2.6 to 1 | 0.8 to 1 |
| NET POSITION TREND: | |||
| – Strength Index Score (3 Year Range Pct): | 23.7 | 75.8 | 39.4 |
| – Strength Index Reading (3 Year Range): | Bearish | Bullish | Bearish |
| NET POSITION MOVEMENT INDEX: | |||
| – 6-Week Change in Strength Index: | -7.4 | 10.6 | -37.8 |
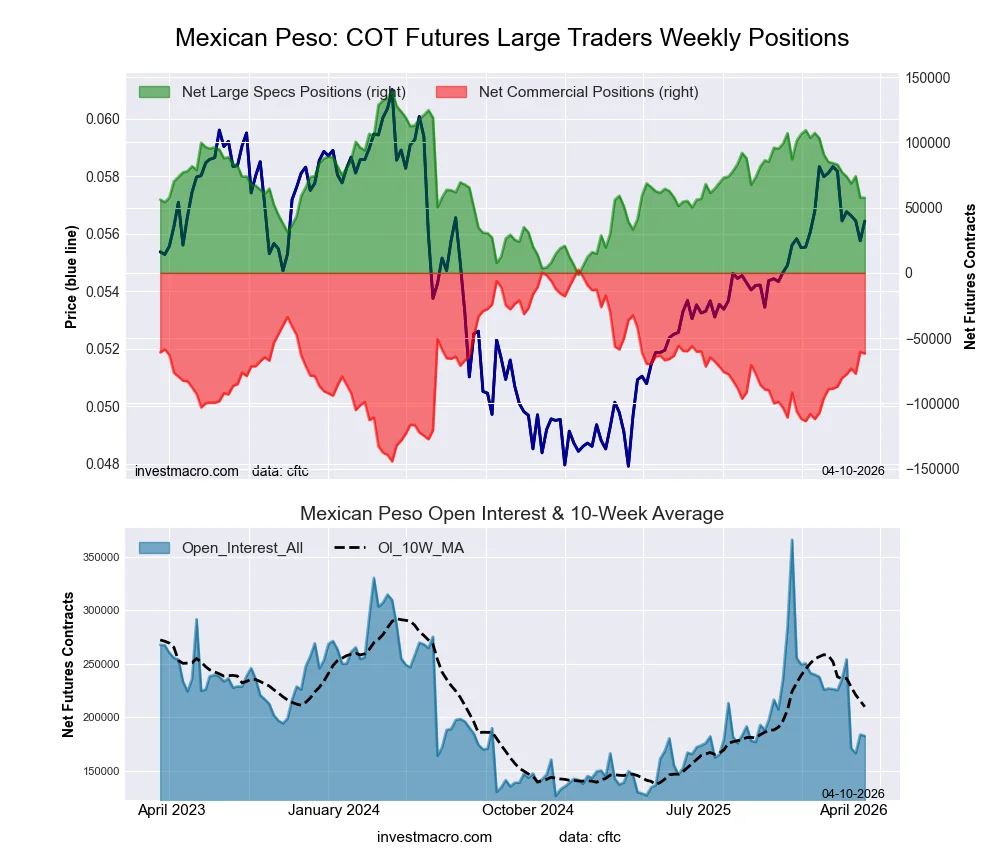
Mexican Peso Futures:
 Positioning Notes:
- Mexican Peso large speculator standing this week totaled a net position of 57,471 contracts in the data reported through Tuesday.
- Weekly Speculator position decline of -213 contracts from the previous week which had a total of 57,684 net contracts.
- This week’s current strength score (range over the past 3 years, measured from 0 to 100) shows the speculators are currently Bearish with a score of 41.8 percent.
- The Commercials are Bullish with a score of 56.3 percent.
- The Small Traders (not shown in chart) are Bearish with a score of 46.7 percent.
Price Trend-Following Model: Uptrend
Our weekly trend-following model classifies the current market price position as: Uptrend.
| MEXICAN PESO Statistics | SPECULATORS | COMMERCIALS | SMALL TRADERS |
| – Percent of Open Interest Longs: | 49.8 | 45.8 | 3.6 |
| – Percent of Open Interest Shorts: | 18.4 | 79.6 | 1.2 |
| – Net Position: | 57,471 | -61,787 | 4,316 |
| – Gross Longs: | 91,055 | 83,760 | 6,529 |
| – Gross Shorts: | 33,584 | 145,547 | 2,213 |
| – Long to Short Ratio: | 2.7 to 1 | 0.6 to 1 | 3.0 to 1 |
| NET POSITION TREND: | |||
| – Strength Index Score (3 Year Range Pct): | 41.8 | 56.3 | 46.7 |
| – Strength Index Reading (3 Year Range): | Bearish | Bullish | Bearish |
| NET POSITION MOVEMENT INDEX: | |||
| – 6-Week Change in Strength Index: | -18.0 | 17.3 | 0.4 |
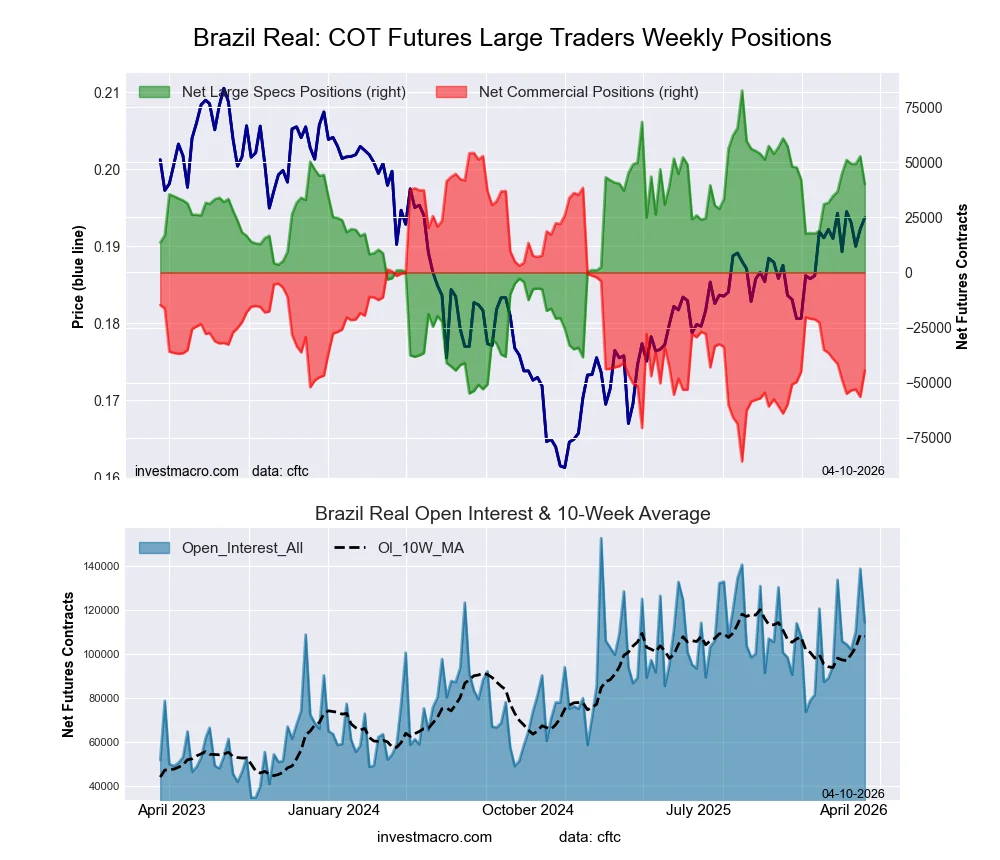
Brazilian Real Futures:
 Positioning Notes:
- Brazilian Real large speculator standing this week totaled a net position of 40,095 contracts in the data reported through Tuesday.
- Weekly Speculator position decline of -12,616 contracts from the previous week which had a total of 52,711 net contracts.
- This week’s current strength score (range over the past 3 years, measured from 0 to 100) shows the speculators are currently Bullish with a score of 69.1 percent.
- The Commercials are Bearish with a score of 29.5 percent.
- The Small Traders (not shown in chart) are Bearish with a score of 45.7 percent.
Price Trend-Following Model: Strong Uptrend
Our weekly trend-following model classifies the current market price position as: Strong Uptrend.
| BRAZIL REAL Statistics | SPECULATORS | COMMERCIALS | SMALL TRADERS |
| – Percent of Open Interest Longs: | 70.3 | 24.3 | 4.6 |
| – Percent of Open Interest Shorts: | 35.1 | 63.3 | 0.7 |
| – Net Position: | 40,095 | -44,497 | 4,402 |
| – Gross Longs: | 80,157 | 27,699 | 5,206 |
| – Gross Shorts: | 40,062 | 72,196 | 804 |
| – Long to Short Ratio: | 2.0 to 1 | 0.4 to 1 | 6.5 to 1 |
| NET POSITION TREND: | |||
| – Strength Index Score (3 Year Range Pct): | 69.1 | 29.5 | 45.7 |
| – Strength Index Reading (3 Year Range): | Bullish | Bearish | Bearish |
| NET POSITION MOVEMENT INDEX: | |||
| – 6-Week Change in Strength Index: | 2.5 | -2.2 | -1.8 |
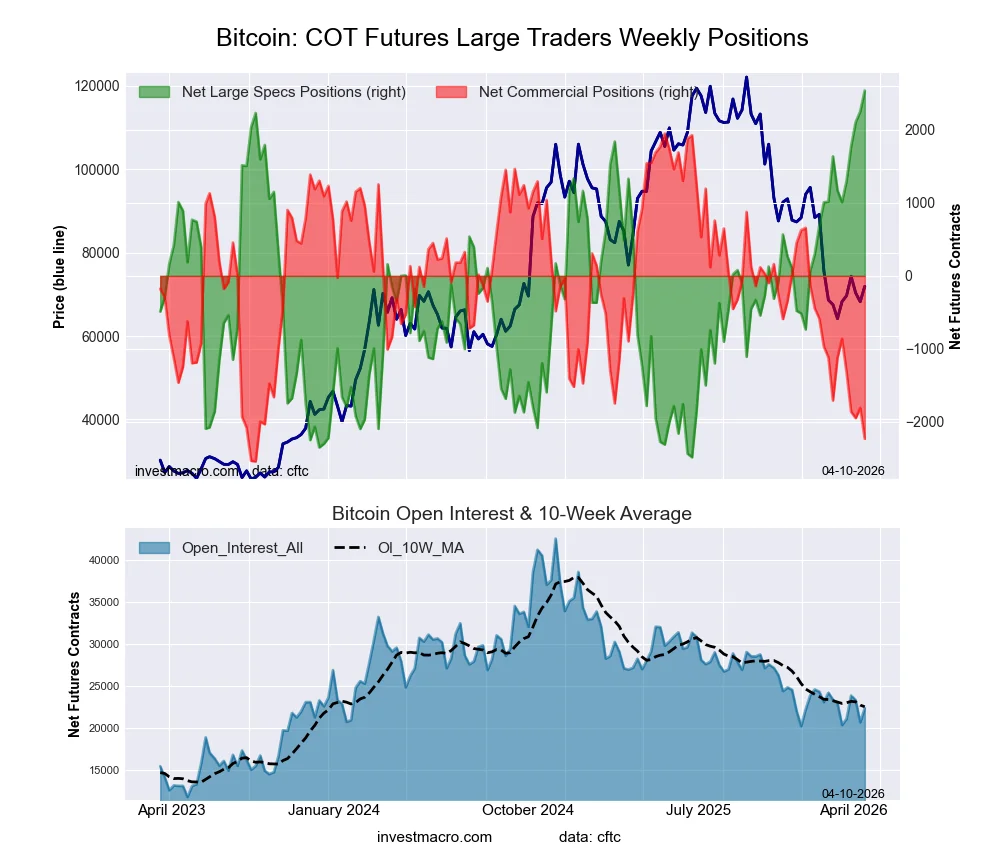
Bitcoin Futures:
 Positioning Notes:
- Bitcoin large speculator standing this week totaled a net position of 2,540 contracts in the data reported through Tuesday.
- Weekly Speculator position increase of 287 contracts from the previous week which had a total of 2,253 net contracts.
- This week’s current strength score (range over the past 3 years, measured from 0 to 100) shows the speculators are currently Bullish-Extreme with a score of 100.0 percent.
- The Commercials are Bearish-Extreme with a score of 6.9 percent.
- The Small Traders (not shown in chart) are Bearish with a score of 21.4 percent.
Price Trend-Following Model: Downtrend
Our weekly trend-following model classifies the current market price position as: Downtrend.
| BITCOIN Statistics | SPECULATORS | COMMERCIALS | SMALL TRADERS |
| – Percent of Open Interest Longs: | 72.4 | 0.7 | 4.2 |
| – Percent of Open Interest Shorts: | 61.0 | 10.7 | 5.5 |
| – Net Position: | 2,540 | -2,232 | -308 |
| – Gross Longs: | 16,142 | 150 | 927 |
| – Gross Shorts: | 13,602 | 2,382 | 1,235 |
| – Long to Short Ratio: | 1.2 to 1 | 0.1 to 1 | 0.8 to 1 |
| NET POSITION TREND: | |||
| – Strength Index Score (3 Year Range Pct): | 100.0 | 6.9 | 21.4 |
| – Strength Index Reading (3 Year Range): | Bullish-Extreme | Bearish-Extreme | Bearish |
| NET POSITION MOVEMENT INDEX: | |||
| – 6-Week Change in Strength Index: | 27.2 | -24.8 | -13.3 |
Article By InvestMacro – Receive our weekly COT Reports by Email
*COT Report: The COT data, released weekly to the public each Friday, is updated through the most recent Tuesday (data is 3 days old) and shows a quick view of how large speculators or non-commercials (for-profit traders) were positioned in the futures markets.
The CFTC categorizes trader positions according to commercial hedgers (traders who use futures contracts for hedging as part of the business), non-commercials (large traders who speculate to realize trading profits) and nonreportable traders (usually small traders/speculators) as well as their open interest (contracts open in the market at time of reporting).See CFTC criteria here.
All information and opinions on this website and contained in this article are for general informational purposes only and do not constitute investment advice.

- COT Metals Charts: Speculator Platinum Bets rise for 7th out of last 8 weeks Apr 12, 2026
- COT Bonds Charts: Weekly Speculator Changes led by 5-Year Bonds Apr 12, 2026
- COT Energy Charts: Weekly Speculator Bets led by Brent Oil Apr 12, 2026
- COT Soft Commodities Charts: Speculator Bets led by Soybean Oil, Cotton & Live Cattle Apr 12, 2026
- Lithium Developer Lands Spot in US-Japan Critical Minerals Partnership Apr 10, 2026
- Oil prices have once again approached 100 dollars per barrel Apr 10, 2026
- USD/JPY: Yen Fared Better, but Energy Rally Not Over Apr 10, 2026
- Stock indices surged sharply amid the 14‑day ceasefire in the Middle East Apr 9, 2026
- EUR/USD on the Plus Side: Middle East Truce Proves Fragile Apr 9, 2026
- Iran and the United States have signed a 14‑day ceasefire: risk appetite has returned to the markets Apr 8, 2026