By RoboForex Analytical Department
The gold market continues to attract strong inflows, underscoring its appeal as a premier defensive asset. Growing anxieties over a potential US government shutdown are fuelling investor nervousness, with Congress once again at a budget impasse. This political deadlock is prompting a flight to safety, benefiting traditional havens like gold and the Swiss franc.
Further pressure on the US dollar stems from the escalation of the trade war, as Donald Trump’s rhetoric grows increasingly assertive. Proposals for higher tariffs, a overhaul of import flows, and fresh threats against China are being factored into market expectations for future inflation and Federal Reserve policy.
Amid this backdrop, the yield on 10-year US Treasuries has dipped below 4.2%, while the DXY dollar index struggles for direction. Markets are progressively pricing in a more dovish Fed stance by year-end, creating a solid fundamental base for gold.
Investors are increasingly turning to XAU/USD as a hedge against mounting political and economic uncertainty, viewing the metal as a reliable insurance policy.
Technical Analysis: XAU/USD
Free Reports:
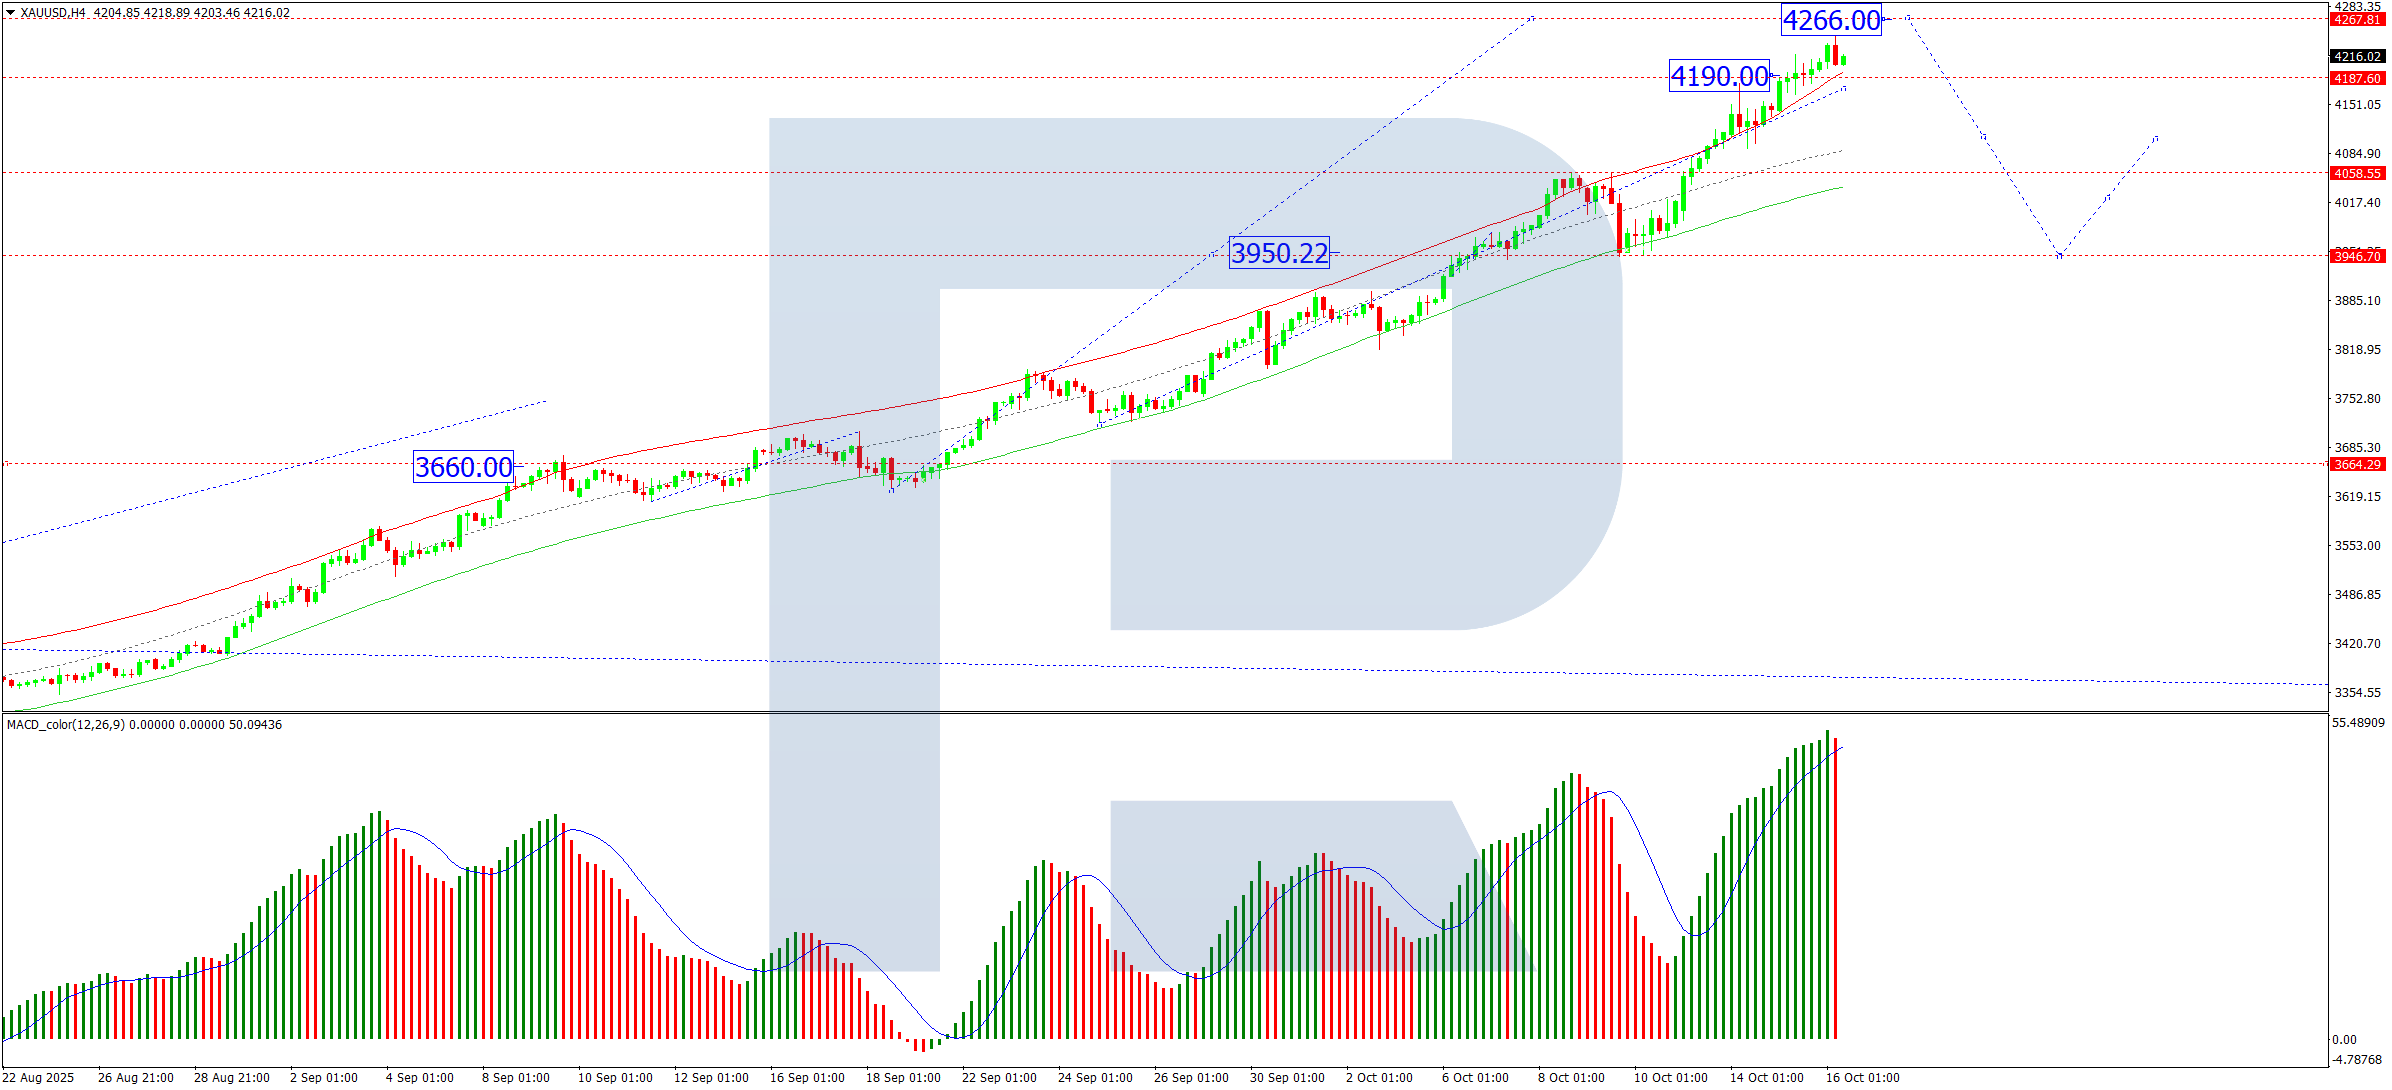
H4 Chart:
On the H4 chart, gold found strong support at 4,190 USD and is advancing towards an initial target of 4,266 USD. Upon reaching this level, a corrective pullback towards 4,100 USD is anticipated. Provided the broader bullish structure holds, this could establish a foundation for a subsequent upward wave, with potential targets at 4,300 – 4,400 USD. The MACD indicator corroborates this constructive outlook. Its signal line is firmly above zero and trending higher, confirming the current dominance of buyers.
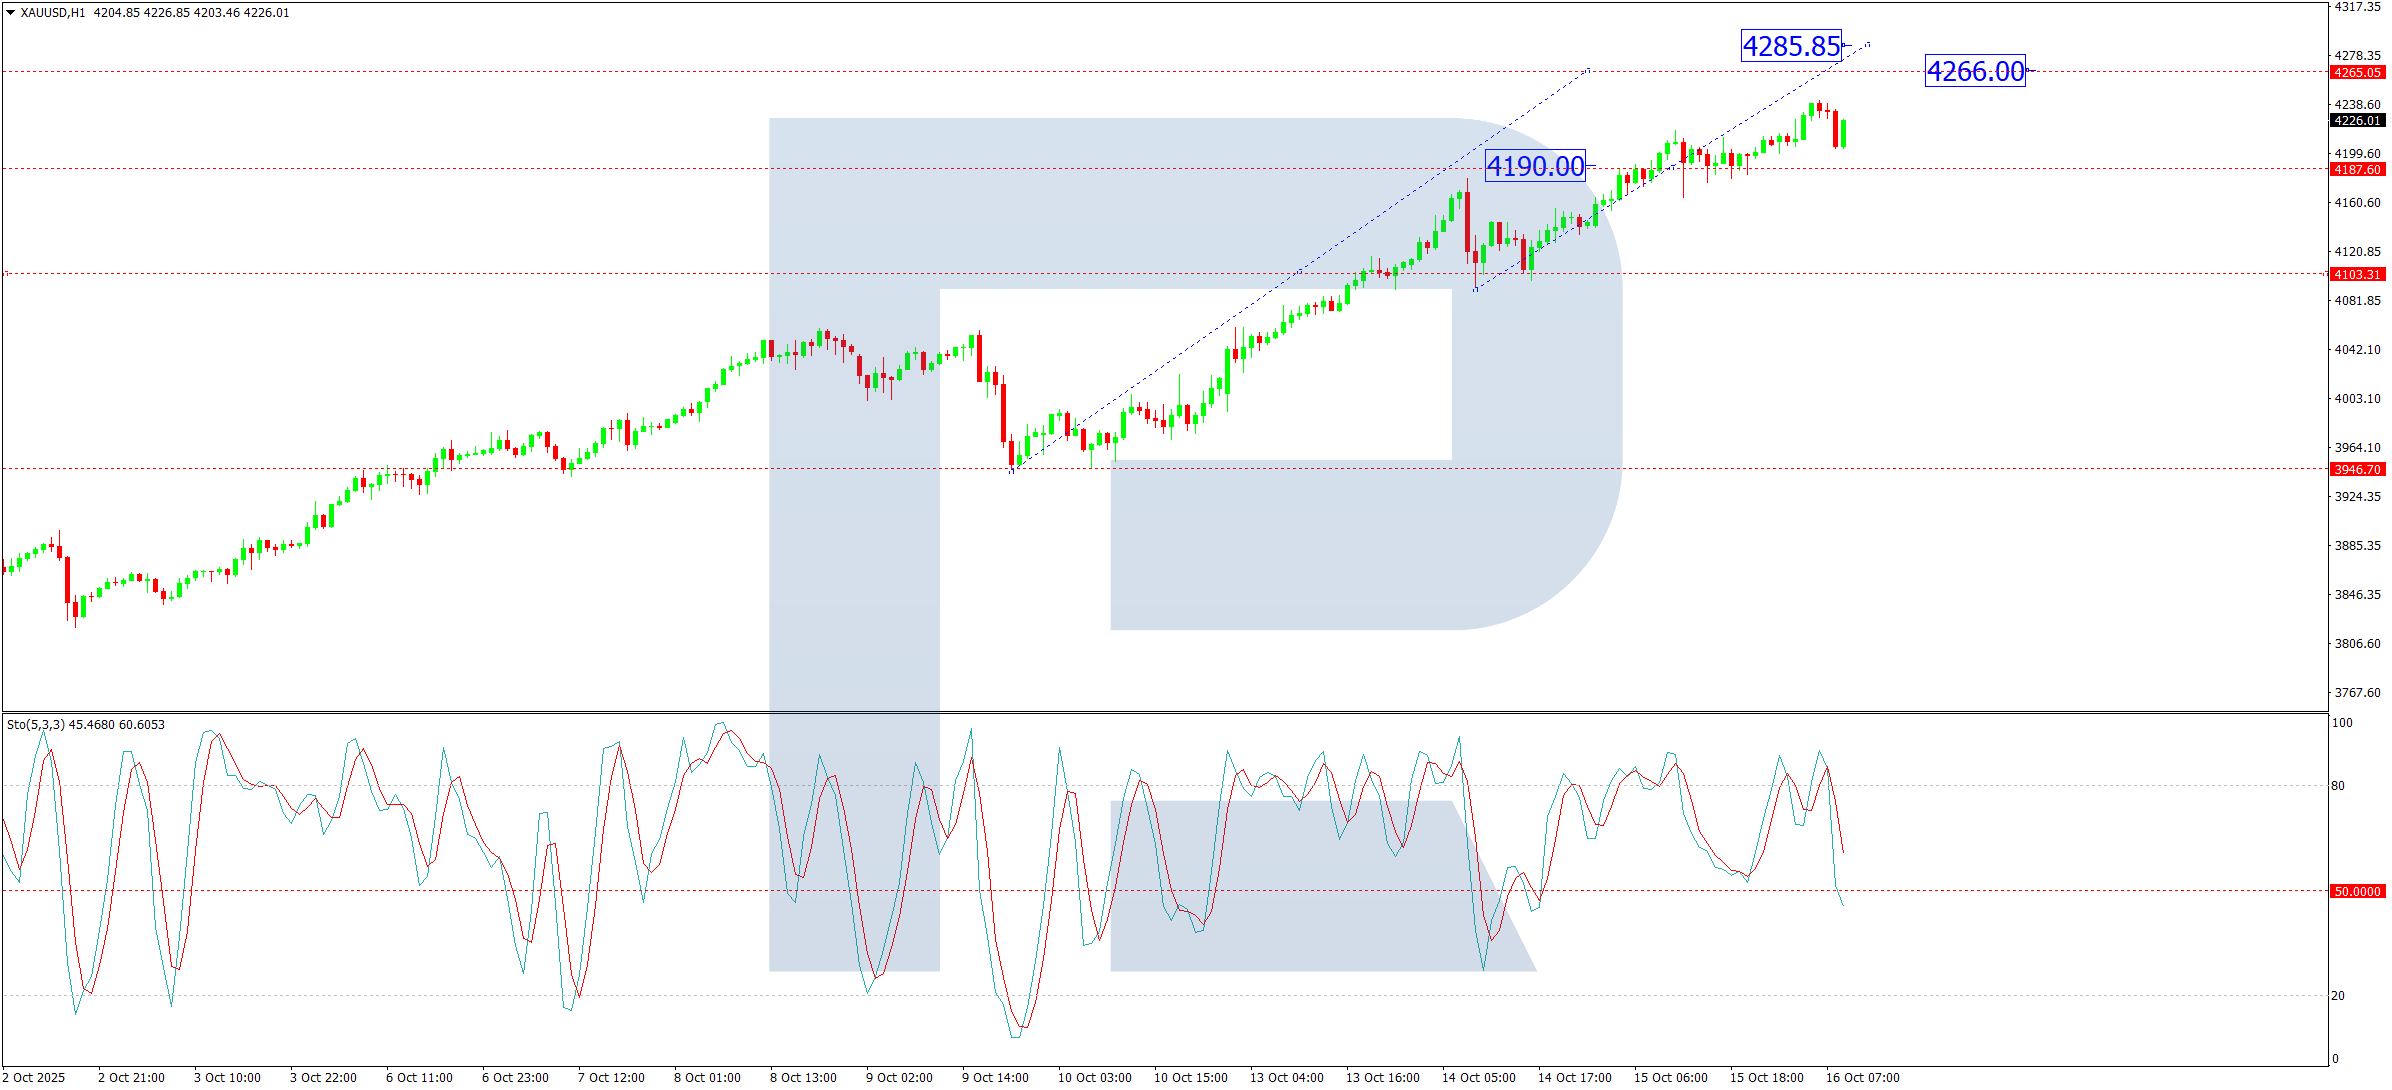
H1 Chart:
On the H1 chart, the instrument decisively broke above the 4,190 USD resistance, consolidating around this level before extending its gains towards 4,266 USD. A period of profit-taking is expected here, likely triggering a retracement to retest 4,190 USD as support. A successful hold above this level could signal a resumption of the uptrend, targeting 4,300 – 4,400 USD. The Stochastic oscillator aligns with this view, with its signal line positioned above 50 and advancing towards 80, reflecting sustained bullish momentum.
Conclusion
Gold’s rally is being driven by a powerful confluence of political uncertainty, trade war escalation, and shifting monetary policy expectations. While a short-term technical correction is likely as profits are taken, the fundamental and technical backdrop remains decidedly bullish.
Disclaimer:
Any forecasts contained herein are based on the author’s particular opinion. This analysis may not be treated as trading advice. RoboForex bears no responsibility for trading results based on trading recommendations and reviews contained herein.
By Jeffrey Young, Georgia Institute of Technology You’ve probably heard artificial intelligence models described as…
Source: Barry Dawes (7/23/26) Barry Dawes of Martin Place Securities shares his analysis of the…
By JustMarkets The US stock indices ended Thursday’s session with a notable decline amid a…
By Analytical Department RoboForex USD/JPY soared to 163.81 on Friday, marking a new 40-year high.…
By JustMarkets The US equities ended Wednesday’s session lower amid investor caution ahead of the…
By Analytical Department RoboForex EUR/USD rose to 1.1429 on Thursday, with the US dollar continuing…
This website uses cookies.