
By InvestMacro
Here are the latest charts and statistics for the Commitment of Traders (COT) reports data published by the Commodities Futures Trading Commission (CFTC).
The latest COT data is updated through Tuesday September 2nd and shows a quick view of how large traders (for-profit speculators and commercial hedgers) were positioned in the futures markets.
Weekly Speculator Changes led by Fed Funds & 10-Year Bonds

The COT bond market speculator bets were overall lower this week as just two out of the nine bond markets we cover had higher positioning while the other seven markets had lower speculator contracts.
Leading the gains for the bond markets was the Fed Funds (177,949 contracts) with the 10-Year Bonds (15,471 contracts) also showing a positive week.
The bond markets with declines in speculator bets for the week were the 5-Year Bonds (-218,016 contracts), the SOFR 1-Month (-113,143 contracts), the US Treasury Bonds (-41,255 contracts), the SOFR 3-Months (-40,153 contracts), the 2-Year Bonds (-33,001 contracts), the Ultra Treasury Bonds (-14,274 contracts) and with the Ultra 10-Year Bonds (-6,205 contracts) also registering lower bets on the week.
Free Reports:
 Get our Weekly Commitment of Traders Reports - See where the biggest traders (Hedge Funds and Commercial Hedgers) are positioned in the futures markets on a weekly basis.
 Download Our Metatrader 4 Indicators – Put Our Free MetaTrader 4 Custom Indicators on your charts when you join our Weekly Newsletter
U.S. Treasury Bond leads Bond Price Performance this week
Leading the bond market’s price changes this week were the longer bonds, as the long U.S. Treasury Bond rose by 1.54% on the week. This bond has seen a 3.11% gain over the last 30 days.
Next, the 10-Year Note was higher by 0.5% on the week. The 10-Year Note has also been up by 2.39% over the last 30 days and is higher by 1.24% over the last 90 days.
The 5-Year Bond was up by 0.25% over the last five days, has been up by 1.51% over the last 30 days, and is up by almost 1% over the last 90 days.
The Fed Funds Futures price was up by 0.24% this week, followed by the 1-Month Secured Overnight Financing Rate, which was up by 0.21% while the 3-Month Secured Overnight Financing Rate was up by just 0.12%.
The 2-Year Bond was virtually unchanged this week. The 2-Year Bond has been up by 0.51% over the last 30 days and is virtually unchanged over the last 90 days.
Bonds Data:

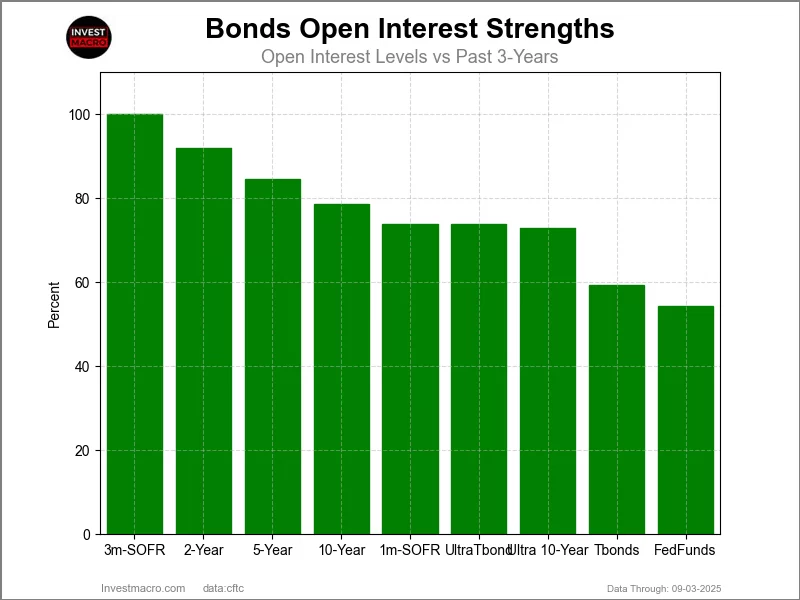
Legend: Open Interest | Speculators Current Net Position | Weekly Specs Change | Specs Strength Score compared to last 3-Years (0-100 range)
Strength Scores led by Ultra Treasury Bonds & US Treasury Bonds

COT Strength Scores (a normalized measure of Speculator positions over a 3-Year range, from 0 to 100 where above 80 is Extreme-Bullish and below 20 is Extreme-Bearish) showed that the Ultra Treasury Bonds (72 percent) and the US Treasury Bonds (56 percent) lead the bond markets this week.
On the downside, the 5-Year Bond (0 percent), the 2-Year Bonds (16 percent) and the Ultra 10-Year Bonds (18 percent) come in at the lowest strength level currently and are in Extreme-Bearish territory (below 20 percent).
Strength Statistics:
Fed Funds (27.8 percent) vs Fed Funds previous week (0.0 percent)
2-Year Bond (16.1 percent) vs 2-Year Bond previous week (18.9 percent)
5-Year Bond (0.0 percent) vs 5-Year Bond previous week (9.7 percent)
10-Year Bond (30.1 percent) vs 10-Year Bond previous week (28.4 percent)
Ultra 10-Year Bond (18.3 percent) vs Ultra 10-Year Bond previous week (19.8 percent)
US Treasury Bond (56.5 percent) vs US Treasury Bond previous week (70.8 percent)
Ultra US Treasury Bond (72.4 percent) vs Ultra US Treasury Bond previous week (77.8 percent)
SOFR 1-Month (34.6 percent) vs SOFR 1-Month previous week (62.5 percent)
SOFR 3-Months (43.5 percent) vs SOFR 3-Months previous week (45.6 percent)
Ultra 10-Year Bonds & SOFR 3-Months top the 6-Week Strength Trends

COT Strength Score Trends (or move index, calculates the 6-week changes in strength scores) showed that the Ultra 10-Year Bonds (15 percent) and the SOFR 3-Months (8 percent) lead the past six weeks trends for bonds. The SOFR 1-Month (6 percent) is the next highest positive movers in the latest trends data.
The Fed Funds (-42 percent), the 10-Year Bonds (-13 percent) and the Ultra Treasury Bonds (-12 percent) lead the downside trend scores currently.
Strength Trend Statistics:
Fed Funds (-42.3 percent) vs Fed Funds previous week (-70.1 percent)
2-Year Bond (-4.0 percent) vs 2-Year Bond previous week (3.1 percent)
5-Year Bond (-9.5 percent) vs 5-Year Bond previous week (1.9 percent)
10-Year Bond (-13.0 percent) vs 10-Year Bond previous week (-12.2 percent)
Ultra 10-Year Bond (14.6 percent) vs Ultra 10-Year Bond previous week (12.6 percent)
US Treasury Bond (2.0 percent) vs US Treasury Bond previous week (32.7 percent)
Ultra US Treasury Bond (-11.6 percent) vs Ultra US Treasury Bond previous week (-7.6 percent)
SOFR 1-Month (6.4 percent) vs SOFR 1-Month previous week (30.7 percent)
SOFR 3-Months (8.0 percent) vs SOFR 3-Months previous week (10.4 percent)
30-Day Federal Funds Futures:
 The 30-Day Federal Funds large speculator standing this week was a net position of -215,874 contracts in the data reported through Tuesday. This was a weekly gain of 177,949 contracts from the previous week which had a total of -393,823 net contracts.
This week’s current strength score (the trader positioning range over the past three years, measured from 0 to 100) shows the speculators are currently Bearish with a score of 27.8 percent. The commercials are Bullish with a score of 72.1 percent and the small traders (not shown in chart) are Bullish with a score of 62.6 percent.
Price Trend-Following Model: Weak Uptrend
Our weekly trend-following model classifies the current market price position as: Weak Uptrend.
| 30-Day Federal Funds Statistics | SPECULATORS | COMMERCIALS | SMALL TRADERS |
| – Percent of Open Interest Longs: | 10.8 | 68.7 | 2.0 |
| – Percent of Open Interest Shorts: | 21.7 | 57.8 | 1.9 |
| – Net Position: | -215,874 | 215,322 | 552 |
| – Gross Longs: | 213,436 | 1,361,064 | 39,020 |
| – Gross Shorts: | 429,310 | 1,145,742 | 38,468 |
| – Long to Short Ratio: | 0.5 to 1 | 1.2 to 1 | 1.0 to 1 |
| NET POSITION TREND: | |||
| – Strength Index Score (3 Year Range Pct): | 27.8 | 72.1 | 62.6 |
| – Strength Index Reading (3 Year Range): | Bearish | Bullish | Bullish |
| NET POSITION MOVEMENT INDEX: | |||
| – 6-Week Change in Strength Index: | -42.3 | 47.2 | -29.3 |
Secured Overnight Financing Rate (3-Month) Futures:
 The Secured Overnight Financing Rate (3-Month) large speculator standing this week was a net position of -325,015 contracts in the data reported through Tuesday. This was a weekly fall of -40,153 contracts from the previous week which had a total of -284,862 net contracts.
This week’s current strength score (the trader positioning range over the past three years, measured from 0 to 100) shows the speculators are currently Bearish with a score of 43.5 percent. The commercials are Bullish with a score of 56.2 percent and the small traders (not shown in chart) are Bullish with a score of 79.7 percent.
Price Trend-Following Model: Weak Uptrend
Our weekly trend-following model classifies the current market price position as: Weak Uptrend.
| SOFR 3-Months Statistics | SPECULATORS | COMMERCIALS | SMALL TRADERS |
| – Percent of Open Interest Longs: | 14.4 | 56.2 | 0.3 |
| – Percent of Open Interest Shorts: | 16.9 | 53.8 | 0.3 |
| – Net Position: | -325,015 | 322,101 | 2,914 |
| – Gross Longs: | 1,865,236 | 7,310,674 | 38,455 |
| – Gross Shorts: | 2,190,251 | 6,988,573 | 35,541 |
| – Long to Short Ratio: | 0.9 to 1 | 1.0 to 1 | 1.1 to 1 |
| NET POSITION TREND: | |||
| – Strength Index Score (3 Year Range Pct): | 43.5 | 56.2 | 79.7 |
| – Strength Index Reading (3 Year Range): | Bearish | Bullish | Bullish |
| NET POSITION MOVEMENT INDEX: | |||
| – 6-Week Change in Strength Index: | 8.0 | -9.0 | 9.3 |
Individual Bond Markets:
Secured Overnight Financing Rate (1-Month) Futures:
 The Secured Overnight Financing Rate (1-Month) large speculator standing this week was a net position of -137,641 contracts in the data reported through Tuesday. This was a weekly reduction of -113,143 contracts from the previous week which had a total of -24,498 net contracts.
This week’s current strength score (the trader positioning range over the past three years, measured from 0 to 100) shows the speculators are currently Bearish with a score of 34.6 percent. The commercials are Bullish with a score of 65.1 percent and the small traders (not shown in chart) are Bullish with a score of 69.3 percent.
Price Trend-Following Model: Strong Uptrend
Our weekly trend-following model classifies the current market price position as: Strong Uptrend.
| SOFR 1-Month Statistics | SPECULATORS | COMMERCIALS | SMALL TRADERS |
| – Percent of Open Interest Longs: | 16.5 | 63.3 | 0.1 |
| – Percent of Open Interest Shorts: | 26.1 | 53.8 | 0.0 |
| – Net Position: | -137,641 | 136,441 | 1,200 |
| – Gross Longs: | 238,504 | 913,069 | 1,444 |
| – Gross Shorts: | 376,145 | 776,628 | 244 |
| – Long to Short Ratio: | 0.6 to 1 | 1.2 to 1 | 5.9 to 1 |
| NET POSITION TREND: | |||
| – Strength Index Score (3 Year Range Pct): | 34.6 | 65.1 | 69.3 |
| – Strength Index Reading (3 Year Range): | Bearish | Bullish | Bullish |
| NET POSITION MOVEMENT INDEX: | |||
| – 6-Week Change in Strength Index: | 6.4 | -5.6 | -6.6 |
2-Year Treasury Note Futures:
 The 2-Year Treasury Note large speculator standing this week was a net position of -1,296,083 contracts in the data reported through Tuesday. This was a weekly fall of -33,001 contracts from the previous week which had a total of -1,263,082 net contracts.
This week’s current strength score (the trader positioning range over the past three years, measured from 0 to 100) shows the speculators are currently Bearish-Extreme with a score of 16.1 percent. The commercials are Bullish-Extreme with a score of 81.7 percent and the small traders (not shown in chart) are Bullish with a score of 71.4 percent.
Price Trend-Following Model: Strong Uptrend
Our weekly trend-following model classifies the current market price position as: Strong Uptrend.
| 2-Year Treasury Note Statistics | SPECULATORS | COMMERCIALS | SMALL TRADERS |
| – Percent of Open Interest Longs: | 11.7 | 78.8 | 5.4 |
| – Percent of Open Interest Shorts: | 41.1 | 52.4 | 2.4 |
| – Net Position: | -1,296,083 | 1,162,858 | 133,225 |
| – Gross Longs: | 516,704 | 3,474,513 | 239,624 |
| – Gross Shorts: | 1,812,787 | 2,311,655 | 106,399 |
| – Long to Short Ratio: | 0.3 to 1 | 1.5 to 1 | 2.3 to 1 |
| NET POSITION TREND: | |||
| – Strength Index Score (3 Year Range Pct): | 16.1 | 81.7 | 71.4 |
| – Strength Index Reading (3 Year Range): | Bearish-Extreme | Bullish-Extreme | Bullish |
| NET POSITION MOVEMENT INDEX: | |||
| – 6-Week Change in Strength Index: | -4.0 | 5.0 | 0.1 |
5-Year Treasury Note Futures:
 The 5-Year Treasury Note large speculator standing this week was a net position of -2,681,987 contracts in the data reported through Tuesday. This was a weekly reduction of -218,016 contracts from the previous week which had a total of -2,463,971 net contracts.
This week’s current strength score (the trader positioning range over the past three years, measured from 0 to 100) shows the speculators are currently Bearish-Extreme with a score of 0.0 percent. The commercials are Bullish-Extreme with a score of 100.0 percent and the small traders (not shown in chart) are Bullish-Extreme with a score of 85.5 percent.
Price Trend-Following Model: Strong Uptrend
Our weekly trend-following model classifies the current market price position as: Strong Uptrend.
| 5-Year Treasury Note Statistics | SPECULATORS | COMMERCIALS | SMALL TRADERS |
| – Percent of Open Interest Longs: | 6.3 | 84.7 | 6.6 |
| – Percent of Open Interest Shorts: | 45.0 | 48.8 | 3.9 |
| – Net Position: | -2,681,987 | 2,490,236 | 191,751 |
| – Gross Longs: | 438,497 | 5,874,650 | 459,219 |
| – Gross Shorts: | 3,120,484 | 3,384,414 | 267,468 |
| – Long to Short Ratio: | 0.1 to 1 | 1.7 to 1 | 1.7 to 1 |
| NET POSITION TREND: | |||
| – Strength Index Score (3 Year Range Pct): | 0.0 | 100.0 | 85.5 |
| – Strength Index Reading (3 Year Range): | Bearish-Extreme | Bullish-Extreme | Bullish-Extreme |
| NET POSITION MOVEMENT INDEX: | |||
| – 6-Week Change in Strength Index: | -9.5 | 10.3 | 2.9 |
10-Year Treasury Note Futures:
 The 10-Year Treasury Note large speculator standing this week was a net position of -868,358 contracts in the data reported through Tuesday. This was a weekly lift of 15,471 contracts from the previous week which had a total of -883,829 net contracts.
This week’s current strength score (the trader positioning range over the past three years, measured from 0 to 100) shows the speculators are currently Bearish with a score of 30.1 percent. The commercials are Bullish with a score of 65.1 percent and the small traders (not shown in chart) are Bullish-Extreme with a score of 82.2 percent.
Price Trend-Following Model: Strong Uptrend
Our weekly trend-following model classifies the current market price position as: Strong Uptrend.
| 10-Year Treasury Note Statistics | SPECULATORS | COMMERCIALS | SMALL TRADERS |
| – Percent of Open Interest Longs: | 11.6 | 78.0 | 8.6 |
| – Percent of Open Interest Shorts: | 28.3 | 63.7 | 6.1 |
| – Net Position: | -868,358 | 742,101 | 126,257 |
| – Gross Longs: | 603,408 | 4,061,677 | 445,942 |
| – Gross Shorts: | 1,471,766 | 3,319,576 | 319,685 |
| – Long to Short Ratio: | 0.4 to 1 | 1.2 to 1 | 1.4 to 1 |
| NET POSITION TREND: | |||
| – Strength Index Score (3 Year Range Pct): | 30.1 | 65.1 | 82.2 |
| – Strength Index Reading (3 Year Range): | Bearish | Bullish | Bullish-Extreme |
| NET POSITION MOVEMENT INDEX: | |||
| – 6-Week Change in Strength Index: | -13.0 | 11.5 | 12.3 |
Ultra 10-Year Notes Futures:
 The Ultra 10-Year Notes large speculator standing this week was a net position of -334,876 contracts in the data reported through Tuesday. This was a weekly fall of -6,205 contracts from the previous week which had a total of -328,671 net contracts.
This week’s current strength score (the trader positioning range over the past three years, measured from 0 to 100) shows the speculators are currently Bearish-Extreme with a score of 18.3 percent. The commercials are Bullish with a score of 78.4 percent and the small traders (not shown in chart) are Bullish with a score of 60.6 percent.
Price Trend-Following Model: Strong Uptrend
Our weekly trend-following model classifies the current market price position as: Strong Uptrend.
| Ultra 10-Year Notes Statistics | SPECULATORS | COMMERCIALS | SMALL TRADERS |
| – Percent of Open Interest Longs: | 13.2 | 76.2 | 9.8 |
| – Percent of Open Interest Shorts: | 27.5 | 59.6 | 12.1 |
| – Net Position: | -334,876 | 388,934 | -54,058 |
| – Gross Longs: | 310,176 | 1,785,627 | 229,949 |
| – Gross Shorts: | 645,052 | 1,396,693 | 284,007 |
| – Long to Short Ratio: | 0.5 to 1 | 1.3 to 1 | 0.8 to 1 |
| NET POSITION TREND: | |||
| – Strength Index Score (3 Year Range Pct): | 18.3 | 78.4 | 60.6 |
| – Strength Index Reading (3 Year Range): | Bearish-Extreme | Bullish | Bullish |
| NET POSITION MOVEMENT INDEX: | |||
| – 6-Week Change in Strength Index: | 14.6 | -19.9 | 14.1 |
US Treasury Bonds Futures:
 The US Treasury Bonds large speculator standing this week was a net position of -77,268 contracts in the data reported through Tuesday. This was a weekly lowering of -41,255 contracts from the previous week which had a total of -36,013 net contracts.
This week’s current strength score (the trader positioning range over the past three years, measured from 0 to 100) shows the speculators are currently Bullish with a score of 56.5 percent. The commercials are Bearish with a score of 33.1 percent and the small traders (not shown in chart) are Bullish with a score of 79.6 percent.
Price Trend-Following Model: Weak Downtrend
Our weekly trend-following model classifies the current market price position as: Weak Downtrend.
| US Treasury Bonds Statistics | SPECULATORS | COMMERCIALS | SMALL TRADERS |
| – Percent of Open Interest Longs: | 8.1 | 77.7 | 13.1 |
| – Percent of Open Interest Shorts: | 12.3 | 78.8 | 7.7 |
| – Net Position: | -77,268 | -20,250 | 97,518 |
| – Gross Longs: | 145,668 | 1,403,628 | 237,421 |
| – Gross Shorts: | 222,936 | 1,423,878 | 139,903 |
| – Long to Short Ratio: | 0.7 to 1 | 1.0 to 1 | 1.7 to 1 |
| NET POSITION TREND: | |||
| – Strength Index Score (3 Year Range Pct): | 56.5 | 33.1 | 79.6 |
| – Strength Index Reading (3 Year Range): | Bullish | Bearish | Bullish |
| NET POSITION MOVEMENT INDEX: | |||
| – 6-Week Change in Strength Index: | 2.0 | -4.1 | 8.1 |
Ultra US Treasury Bonds Futures:
 The Ultra US Treasury Bonds large speculator standing this week was a net position of -263,219 contracts in the data reported through Tuesday. This was a weekly fall of -14,274 contracts from the previous week which had a total of -248,945 net contracts.
This week’s current strength score (the trader positioning range over the past three years, measured from 0 to 100) shows the speculators are currently Bullish with a score of 72.4 percent. The commercials are Bearish with a score of 42.7 percent and the small traders (not shown in chart) are Bearish-Extreme with a score of 15.8 percent.
Price Trend-Following Model: Weak Downtrend
Our weekly trend-following model classifies the current market price position as: Weak Downtrend.
| Ultra US Treasury Bonds Statistics | SPECULATORS | COMMERCIALS | SMALL TRADERS |
| – Percent of Open Interest Longs: | 6.8 | 82.3 | 9.2 |
| – Percent of Open Interest Shorts: | 20.0 | 69.2 | 9.2 |
| – Net Position: | -263,219 | 262,589 | 630 |
| – Gross Longs: | 135,468 | 1,645,379 | 183,916 |
| – Gross Shorts: | 398,687 | 1,382,790 | 183,286 |
| – Long to Short Ratio: | 0.3 to 1 | 1.2 to 1 | 1.0 to 1 |
| NET POSITION TREND: | |||
| – Strength Index Score (3 Year Range Pct): | 72.4 | 42.7 | 15.8 |
| – Strength Index Reading (3 Year Range): | Bullish | Bearish | Bearish-Extreme |
| NET POSITION MOVEMENT INDEX: | |||
| – 6-Week Change in Strength Index: | -11.6 | 11.2 | 1.5 |
Article By InvestMacro – Receive our weekly COT Newsletter
*COT Report: The COT data, released weekly to the public each Friday, is updated through the most recent Tuesday (data is 3 days old) and shows a quick view of how large speculators or non-commercials (for-profit traders) were positioned in the futures markets.
The CFTC categorizes trader positions according to commercial hedgers (traders who use futures contracts for hedging as part of the business), non-commercials (large traders who speculate to realize trading profits) and nonreportable traders (usually small traders/speculators) as well as their open interest (contracts open in the market at time of reporting). See CFTC criteria here.

- Oil prices are holding around 95 dollars per barrel. Bank Indonesia kept its key rate unchanged Mar 18, 2026
- EUR/USD Awaits Fed Decision Mar 18, 2026
- GBP/USD Pauses Ahead of Bank of England Rate Decision Mar 17, 2026
- The RBA raised the rate to 4.1% amid a surge in fuel prices. The Canadian dollar strengthened following the inflation data release Mar 17, 2026
- RoboForex Launches Swap-Free Trading for All Clients Mar 16, 2026
- Gold Continues to Decline Amid Fed Expectations Mar 16, 2026
- Investors begin pricing in prolonged stagflation due to the blockade of the Strait of Hormuz Mar 16, 2026
- Iran wants to maintain the blockade of the Strait of Hormuz until the United States closes all its bases in the Middle East Mar 13, 2026
- USD/JPY at Highest Since July 2024: Market Awaits BoJ Intervention Mar 13, 2026
- Oil continues to rise despite record strategic reserve releases by the IEA Mar 12, 2026