
By Analytical Department RoboForex
Gold prices fell to 5,023 USD per ounce on Monday, extending losses after two consecutive weeks of decline. Pressure on the market persists amid rising oil prices, with the situation becoming more problematic following a US strike on Iran’s Kharg Island oil terminal – one of the country’s key export hubs.
The attack prompted retaliation from Tehran, with Iran striking Israel and energy infrastructure in several Arab nations. These developments have intensified concerns about global supply stability.
The military confrontation between the US, Israel, and Iran has entered its third week with no signs of resolution. Volatility across financial markets remains elevated.
Rising energy prices are increasing inflation risks and reducing the likelihood of imminent monetary policy easing. Against this backdrop, gold faces pressure, as higher interest rates diminish the appeal of non-yielding assets.
The Federal Reserve is expected to maintain its interest rate this week. Monetary policy decisions are also anticipated from numerous other central banks, including those in the Eurozone, the UK, Japan, Switzerland, Australia, Canada, China, Brazil, and Russia.
Free Reports:
 Sign Up for Our Stock Market Newsletter – Get updated on News, Charts & Rankings of Public Companies when you join our Stocks Newsletter
 Get our Weekly Commitment of Traders Reports - See where the biggest traders (Hedge Funds and Commercial Hedgers) are positioned in the futures markets on a weekly basis.
Technical Analysis
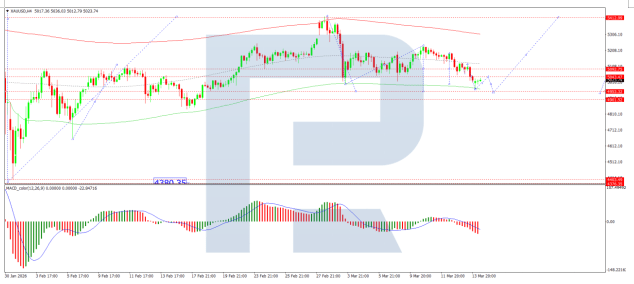
On the H4 XAU/USD chart, the market formed a consolidation range around the 5,092 USD level. It has now broken downwards, likely continuing the correction towards 4,953 USD. The MACD indicator confirms the current momentum, with its signal line below the centre line and pointing sharply downwards.
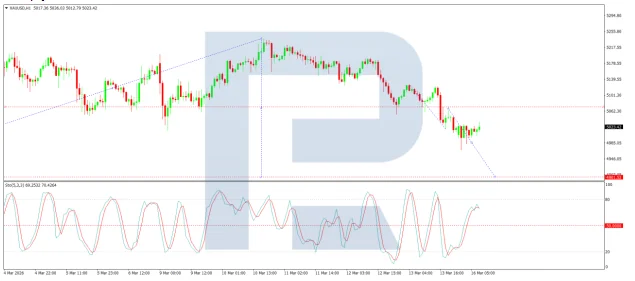
On the H1 chart, the market has broken below the 5,035 USD level and is forming a wave towards 4,953 USD. Looking ahead, a corrective growth wave towards 5,200 USD is possible, with potential for the trend to extend to 5,412 USD. The Stochastic oscillator supports the short-term bearish scenario, with its signal line remaining above the 50 level and under pressure to decline towards level 20.
Conclusion
Gold continues to face headwinds as escalating geopolitical tensions in the Middle East drive oil prices higher, reinforcing inflation concerns and delaying expectations for Fed rate cuts. The third week of military confrontation shows no signs of abating, keeping markets on edge. With the Federal Reserve widely expected to hold rates steady this week, and technical indicators pointing to further downside, gold’s immediate trajectory appears vulnerable. A break below key support could accelerate losses towards 4,953 USD, though dovish surprises from central bank meetings this week might offer temporary relief.
Disclaimer
Any forecasts contained herein are based on the author’s particular opinion. This analysis may not be treated as trading advice. RoboForex bears no responsibility for trading results based on trading recommendations and reviews contained herein.

- COT Metals Charts: Weekly Speculator Changes led by Copper Jul 26, 2026
- COT Bonds Charts: Speculator Bets led by SOFR 3-Months & 5-Year Bonds Jul 26, 2026
- COT Energy Charts: Weekly Speculator Bets led by WTI Crude & Natural Gas Jul 26, 2026
- COT Soft Commodities Charts: Weekly Speculator Bets led by Corn & Soybeans Jul 26, 2026
- The US introduces new import tariffs for 60 countries. Brent crude surpasses $100 per barrel Jul 24, 2026
- USD/JPY Breaks Records: Nothing Slows the Yen’s Decline Jul 24, 2026
- Oil prices reached a 6‑week high. The AUD strengthened on the back of a strong labor‑market report Jul 23, 2026
- EUR/USD Recovers as Dollar Weakens Jul 23, 2026
- Bitcoin rose to $66,000. The New Zealand dollar continues to strengthen Jul 22, 2026
- Inflationary pressure is easing in Canada. In New Zealand, on the contrary, inflation is rising Jul 21, 2026