
By InvestMacro

Here are the latest charts and statistics for the Commitment of Traders (COT) data published by the Commodities Futures Trading Commission (CFTC).
The latest COT data is updated through Tuesday May 13th and shows a quick view of how large market participants (for-profit speculators and commercial traders) were positioned in the futures markets. All currency positions are in direct relation to the US dollar where, for example, a bet for the euro is a bet that the euro will rise versus the dollar while a bet against the euro will be a bet that the euro will decline versus the dollar.
Weekly Speculator Changes led by Brazilian Real & EuroFX

The COT currency market speculator bets were slightly higher this week as six out of the eleven currency markets we cover had higher positioning while the other five markets had lower speculator contracts.
Leading the gains for the currency markets was the Brazilian Real (18,554 contracts) with the EuroFX (9,055 contracts), Bitcoin (954 contracts), the New Zealand Dollar (523 contracts), the Swiss Franc (505 contracts) and the US Dollar Index (493 contracts) also showing positive weeks.
Free Reports:
 Get our Weekly Commitment of Traders Reports - See where the biggest traders (Hedge Funds and Commercial Hedgers) are positioned in the futures markets on a weekly basis.
 Download Our Metatrader 4 Indicators – Put Our Free MetaTrader 4 Custom Indicators on your charts when you join our Weekly Newsletter
The currencies seeing declines in speculator bets on the week were the Canadian Dollar (-11,511 contracts), the Japanese Yen (-4,591 contracts), the Mexican Peso (-2,849 contracts), the British Pound (-2,019 contracts) and the Australian Dollar (-974 contracts) also registering lower bets on the week.
Currency Futures Data Highlights: Euro hits 2024 high
This week’s notable changes in the Currency Speculator positions included the Euro rising to a new yearly high, the Brazilian Real rebounding from last week’s sharp decline, and the Canadian Dollar posting the largest decrease this week in the speculator bets.
Euro Speculator Position:
– The Euro speculator bet rose by over +9,000 contracts this week.
– The Euro speculator position has risen in 4 out of the past 6 weeks and in 10 out of the last 13 weeks.
– Over the last 13 weeks, approximately +150,000 contracts have been added to the Euro speculator position.
– The overall standing has increased from approximately -64,000 contracts in February to a +84,774 contracts this week.
– This brings the Euro contract position to its highest level since September 2024, a span of 36 weeks.
Brazilian Real Speculator Position:
– The Brazilian Real jumped this week with a gain of over +18,000 speculator positions, rebounding from last week’s -43,377 contract decline.
– The Brazilian Real contract positions have risen in 5 out of the past 6 weeks and maintains a bullish net position of over +43,000 contracts this week.
Other Major Currencies:
– Speculator positions for the Australian Dollar, the Swiss Franc, the U.S. Dollar Index, the New Zealand Dollar, and Bitcoin all saw changes of less than 1,000 contracts on the week.
– The Japanese Yen saw an approximate -4,500 contract fall from its overall net position but maintains a highly bullish position slightly off the all-time highs of 2 weeks ago.
– The Canadian Dollar saw the most bearish change of the week with a decline of over 11,000 contracts, likely weighed down by falling oil prices and speculation that the Canadian government could reduce interest rates.
U.S. Dollar Index:
– The U.S. Dollar Index currently has a speculator’s net standing of -615 contracts, which amounts to an overall neutral position after a small gain this week.
– The U.S. Dollar Index price has risen slightly for the past 4 weeks in a row and ended the week just below the 101.00 exchange level.
Currencies Data:

Legend: Open Interest | Speculators Current Net Position | Weekly Specs Change | Specs Strength Score compared to last 3-Years (0-100 range)
Strength Scores led by Japanese Yen & Brazilian Real

COT Strength Scores (a normalized measure of Speculator positions over a 3-Year range, from 0 to 100 where above 80 is Extreme-Bullish and below 20 is Extreme-Bearish) showed that the Japanese Yen (98 percent) and the Brazilian Real (80 percent) lead the currency markets this week. The Mexican Peso (62 percent), the EuroFX (61 percent) and the Swiss Franc (54 percent) come in as the next highest in the weekly strength scores.
On the downside, the US Dollar Index (5 percent) comes in at the lowest strength levels currently and is in Extreme-Bearish territory (below 20 percent). The next lowest strength scores are Bitcoin (33 percent), the New Zealand Dollar (38 percent) and the Australian Dollar (41 percent).
3-Year Strength Statistics:
US Dollar Index (5.4 percent) vs US Dollar Index previous week (4.4 percent)
EuroFX (61.0 percent) vs EuroFX previous week (57.6 percent)
British Pound Sterling (48.3 percent) vs British Pound Sterling previous week (49.2 percent)
Japanese Yen (98.1 percent) vs Japanese Yen previous week (99.4 percent)
Swiss Franc (54.1 percent) vs Swiss Franc previous week (53.1 percent)
Canadian Dollar (51.1 percent) vs Canadian Dollar previous week (56.3 percent)
Australian Dollar (41.3 percent) vs Australian Dollar previous week (42.0 percent)
New Zealand Dollar (38.3 percent) vs New Zealand Dollar previous week (37.7 percent)
Mexican Peso (62.3 percent) vs Mexican Peso previous week (63.7 percent)
Brazilian Real (79.9 percent) vs Brazilian Real previous week (64.8 percent)
Bitcoin (33.3 percent) vs Bitcoin previous week (12.4 percent)
Swiss Franc & New Zealand Dollar top the 6-Week Strength Trends

COT Strength Score Trends (or move index, calculates the 6-week changes in strength scores) showed that the Swiss Franc (40 percent) and the New Zealand Dollar (26 percent) lead the past six weeks trends for the currencies. The Canadian Dollar (21 percent), the Australian Dollar (19 percent) and the Japanese Yen (14 percent) are the next highest positive movers in the 3-Year trends data.
Bitcoin (-29 percent) leads the downside trend scores currently with the US Dollar Index (-16 percent) following next with lower trend scores.
3-Year Strength Trends:
US Dollar Index (-15.9 percent) vs US Dollar Index previous week (-17.8 percent)
EuroFX (12.5 percent) vs EuroFX previous week (3.9 percent)
British Pound Sterling (-3.3 percent) vs British Pound Sterling previous week (-6.8 percent)
Japanese Yen (13.9 percent) vs Japanese Yen previous week (14.2 percent)
Swiss Franc (39.9 percent) vs Swiss Franc previous week (28.4 percent)
Canadian Dollar (21.4 percent) vs Canadian Dollar previous week (26.4 percent)
Australian Dollar (18.8 percent) vs Australian Dollar previous week (20.6 percent)
New Zealand Dollar (25.9 percent) vs New Zealand Dollar previous week (21.3 percent)
Mexican Peso (7.5 percent) vs Mexican Peso previous week (4.9 percent)
Brazilian Real (5.3 percent) vs Brazilian Real previous week (-12.5 percent)
Bitcoin (-28.8 percent) vs Bitcoin previous week (-64.6 percent)
Individual COT Forex Markets:
US Dollar Index Futures:
 The US Dollar Index large speculator standing this week reached a net position of -615 contracts in the data reported through Tuesday. This was a weekly boost of 493 contracts from the previous week which had a total of -1,108 net contracts.
This week’s current strength score (the trader positioning range over the past three years, measured from 0 to 100) shows the speculators are currently Bearish-Extreme with a score of 5.4 percent. The commercials are Bullish-Extreme with a score of 96.2 percent and the small traders (not shown in chart) are Bearish with a score of 24.2 percent.
Price Trend-Following Model: Downtrend
Our weekly trend-following model classifies the current market price position as: Downtrend.
| US DOLLAR INDEX Statistics | SPECULATORS | COMMERCIALS | SMALL TRADERS |
| – Percent of Open Interest Longs: | 55.5 | 27.4 | 10.2 |
| – Percent of Open Interest Shorts: | 57.7 | 23.6 | 11.8 |
| – Net Position: | -615 | 1,067 | -452 |
| – Gross Longs: | 15,539 | 7,680 | 2,849 |
| – Gross Shorts: | 16,154 | 6,613 | 3,301 |
| – Long to Short Ratio: | 1.0 to 1 | 1.2 to 1 | 0.9 to 1 |
| NET POSITION TREND: | |||
| – Strength Index Score (3 Year Range Pct): | 5.4 | 96.2 | 24.2 |
| – Strength Index Reading (3 Year Range): | Bearish-Extreme | Bullish-Extreme | Bearish |
| NET POSITION MOVEMENT INDEX: | |||
| – 6-Week Change in Strength Index: | -15.9 | 14.7 | 2.6 |
Euro Currency Futures:
 The Euro Currency large speculator standing this week reached a net position of 84,774 contracts in the data reported through Tuesday. This was a weekly boost of 9,055 contracts from the previous week which had a total of 75,719 net contracts.
This week’s current strength score (the trader positioning range over the past three years, measured from 0 to 100) shows the speculators are currently Bullish with a score of 61.0 percent. The commercials are Bearish with a score of 35.5 percent and the small traders (not shown in chart) are Bullish-Extreme with a score of 83.3 percent.
Price Trend-Following Model: Uptrend
Our weekly trend-following model classifies the current market price position as: Uptrend.
| EURO Currency Statistics | SPECULATORS | COMMERCIALS | SMALL TRADERS |
| – Percent of Open Interest Longs: | 27.9 | 54.2 | 12.6 |
| – Percent of Open Interest Shorts: | 16.6 | 72.0 | 6.0 |
| – Net Position: | 84,774 | -134,282 | 49,508 |
| – Gross Longs: | 209,549 | 406,660 | 94,529 |
| – Gross Shorts: | 124,775 | 540,942 | 45,021 |
| – Long to Short Ratio: | 1.7 to 1 | 0.8 to 1 | 2.1 to 1 |
| NET POSITION TREND: | |||
| – Strength Index Score (3 Year Range Pct): | 61.0 | 35.5 | 83.3 |
| – Strength Index Reading (3 Year Range): | Bullish | Bearish | Bullish-Extreme |
| NET POSITION MOVEMENT INDEX: | |||
| – 6-Week Change in Strength Index: | 12.5 | -17.5 | 41.1 |
British Pound Sterling Futures:
 The British Pound Sterling large speculator standing this week reached a net position of 27,216 contracts in the data reported through Tuesday. This was a weekly decrease of -2,019 contracts from the previous week which had a total of 29,235 net contracts.
This week’s current strength score (the trader positioning range over the past three years, measured from 0 to 100) shows the speculators are currently Bearish with a score of 48.3 percent. The commercials are Bearish with a score of 48.6 percent and the small traders (not shown in chart) are Bullish with a score of 72.4 percent.
Price Trend-Following Model: Uptrend
Our weekly trend-following model classifies the current market price position as: Uptrend.
| BRITISH POUND Statistics | SPECULATORS | COMMERCIALS | SMALL TRADERS |
| – Percent of Open Interest Longs: | 46.0 | 28.7 | 16.8 |
| – Percent of Open Interest Shorts: | 32.0 | 45.1 | 14.3 |
| – Net Position: | 27,216 | -32,059 | 4,843 |
| – Gross Longs: | 89,540 | 55,836 | 32,765 |
| – Gross Shorts: | 62,324 | 87,895 | 27,922 |
| – Long to Short Ratio: | 1.4 to 1 | 0.6 to 1 | 1.2 to 1 |
| NET POSITION TREND: | |||
| – Strength Index Score (3 Year Range Pct): | 48.3 | 48.6 | 72.4 |
| – Strength Index Reading (3 Year Range): | Bearish | Bearish | Bullish |
| NET POSITION MOVEMENT INDEX: | |||
| – 6-Week Change in Strength Index: | -3.3 | 2.7 | 1.4 |
Japanese Yen Futures:
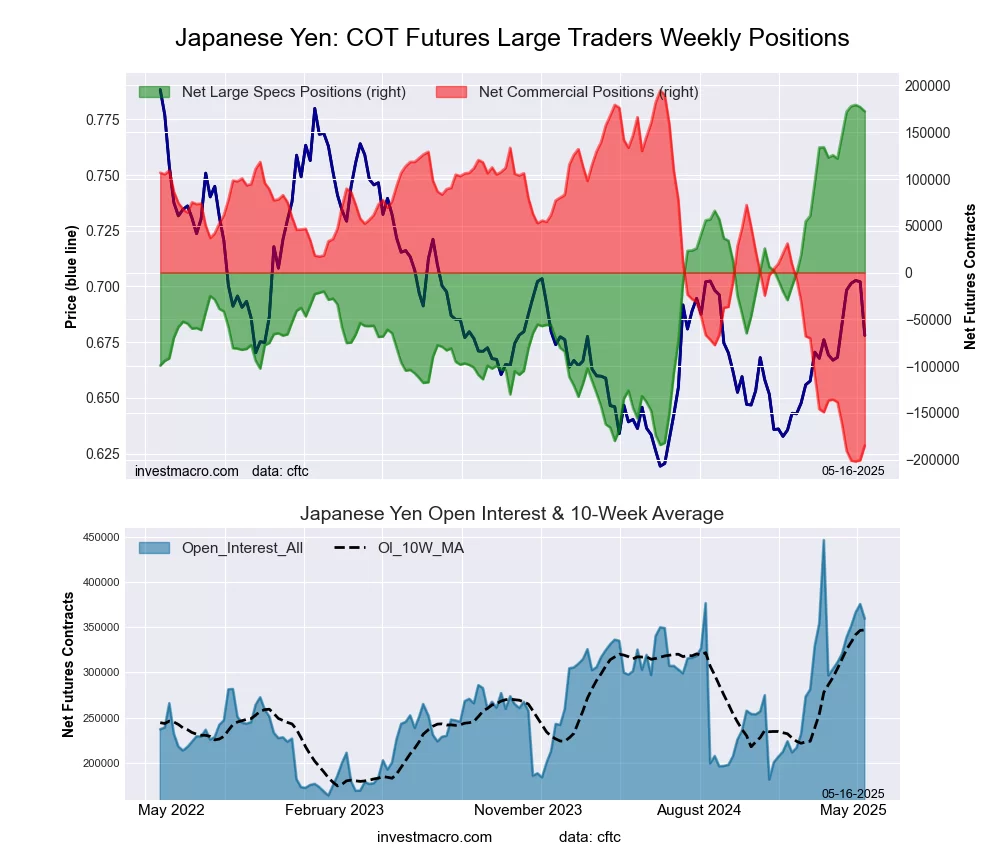 The Japanese Yen large speculator standing this week reached a net position of 172,268 contracts in the data reported through Tuesday. This was a weekly reduction of -4,591 contracts from the previous week which had a total of 176,859 net contracts.
This week’s current strength score (the trader positioning range over the past three years, measured from 0 to 100) shows the speculators are currently Bullish-Extreme with a score of 98.1 percent. The commercials are Bearish-Extreme with a score of 4.3 percent and the small traders (not shown in chart) are Bullish with a score of 74.4 percent.
Price Trend-Following Model: Uptrend
Our weekly trend-following model classifies the current market price position as: Uptrend.
| JAPANESE YEN Statistics | SPECULATORS | COMMERCIALS | SMALL TRADERS |
| – Percent of Open Interest Longs: | 54.0 | 28.1 | 11.1 |
| – Percent of Open Interest Shorts: | 6.1 | 79.6 | 7.6 |
| – Net Position: | 172,268 | -184,891 | 12,623 |
| – Gross Longs: | 194,226 | 101,140 | 40,015 |
| – Gross Shorts: | 21,958 | 286,031 | 27,392 |
| – Long to Short Ratio: | 8.8 to 1 | 0.4 to 1 | 1.5 to 1 |
| NET POSITION TREND: | |||
| – Strength Index Score (3 Year Range Pct): | 98.1 | 4.3 | 74.4 |
| – Strength Index Reading (3 Year Range): | Bullish-Extreme | Bearish-Extreme | Bullish |
| NET POSITION MOVEMENT INDEX: | |||
| – 6-Week Change in Strength Index: | 13.9 | -11.7 | -9.5 |
Swiss Franc Futures:
 The Swiss Franc large speculator standing this week reached a net position of -23,069 contracts in the data reported through Tuesday. This was a weekly rise of 505 contracts from the previous week which had a total of -23,574 net contracts.
This week’s current strength score (the trader positioning range over the past three years, measured from 0 to 100) shows the speculators are currently Bullish with a score of 54.1 percent. The commercials are Bearish with a score of 37.0 percent and the small traders (not shown in chart) are Bullish with a score of 79.1 percent.
Price Trend-Following Model: Uptrend
Our weekly trend-following model classifies the current market price position as: Uptrend.
| SWISS FRANC Statistics | SPECULATORS | COMMERCIALS | SMALL TRADERS |
| – Percent of Open Interest Longs: | 10.2 | 69.8 | 19.9 |
| – Percent of Open Interest Shorts: | 41.7 | 38.3 | 19.8 |
| – Net Position: | -23,069 | 22,999 | 70 |
| – Gross Longs: | 7,443 | 51,006 | 14,560 |
| – Gross Shorts: | 30,512 | 28,007 | 14,490 |
| – Long to Short Ratio: | 0.2 to 1 | 1.8 to 1 | 1.0 to 1 |
| NET POSITION TREND: | |||
| – Strength Index Score (3 Year Range Pct): | 54.1 | 37.0 | 79.1 |
| – Strength Index Reading (3 Year Range): | Bullish | Bearish | Bullish |
| NET POSITION MOVEMENT INDEX: | |||
| – 6-Week Change in Strength Index: | 39.9 | -43.6 | 30.0 |
Canadian Dollar Futures:
 The Canadian Dollar large speculator standing this week reached a net position of -82,156 contracts in the data reported through Tuesday. This was a weekly decline of -11,511 contracts from the previous week which had a total of -70,645 net contracts.
This week’s current strength score (the trader positioning range over the past three years, measured from 0 to 100) shows the speculators are currently Bullish with a score of 51.1 percent. The commercials are Bullish with a score of 52.6 percent and the small traders (not shown in chart) are Bearish-Extreme with a score of 16.1 percent.
Price Trend-Following Model: Uptrend
Our weekly trend-following model classifies the current market price position as: Uptrend.
| CANADIAN DOLLAR Statistics | SPECULATORS | COMMERCIALS | SMALL TRADERS |
| – Percent of Open Interest Longs: | 8.8 | 81.0 | 8.1 |
| – Percent of Open Interest Shorts: | 40.1 | 46.0 | 11.8 |
| – Net Position: | -82,156 | 91,895 | -9,739 |
| – Gross Longs: | 23,250 | 212,802 | 21,276 |
| – Gross Shorts: | 105,406 | 120,907 | 31,015 |
| – Long to Short Ratio: | 0.2 to 1 | 1.8 to 1 | 0.7 to 1 |
| NET POSITION TREND: | |||
| – Strength Index Score (3 Year Range Pct): | 51.1 | 52.6 | 16.1 |
| – Strength Index Reading (3 Year Range): | Bullish | Bullish | Bearish-Extreme |
| NET POSITION MOVEMENT INDEX: | |||
| – 6-Week Change in Strength Index: | 21.4 | -21.8 | 10.2 |
Australian Dollar Futures:
 The Australian Dollar large speculator standing this week reached a net position of -49,346 contracts in the data reported through Tuesday. This was a weekly decline of -974 contracts from the previous week which had a total of -48,372 net contracts.
This week’s current strength score (the trader positioning range over the past three years, measured from 0 to 100) shows the speculators are currently Bearish with a score of 41.3 percent. The commercials are Bullish with a score of 60.3 percent and the small traders (not shown in chart) are Bearish with a score of 45.0 percent.
Price Trend-Following Model: Strong Uptrend
Our weekly trend-following model classifies the current market price position as: Strong Uptrend.
| AUSTRALIAN DOLLAR Statistics | SPECULATORS | COMMERCIALS | SMALL TRADERS |
| – Percent of Open Interest Longs: | 14.1 | 66.5 | 11.8 |
| – Percent of Open Interest Shorts: | 41.5 | 38.3 | 12.6 |
| – Net Position: | -49,346 | 50,883 | -1,537 |
| – Gross Longs: | 25,507 | 119,964 | 21,268 |
| – Gross Shorts: | 74,853 | 69,081 | 22,805 |
| – Long to Short Ratio: | 0.3 to 1 | 1.7 to 1 | 0.9 to 1 |
| NET POSITION TREND: | |||
| – Strength Index Score (3 Year Range Pct): | 41.3 | 60.3 | 45.0 |
| – Strength Index Reading (3 Year Range): | Bearish | Bullish | Bearish |
| NET POSITION MOVEMENT INDEX: | |||
| – 6-Week Change in Strength Index: | 18.8 | -16.8 | 4.6 |
New Zealand Dollar Futures:
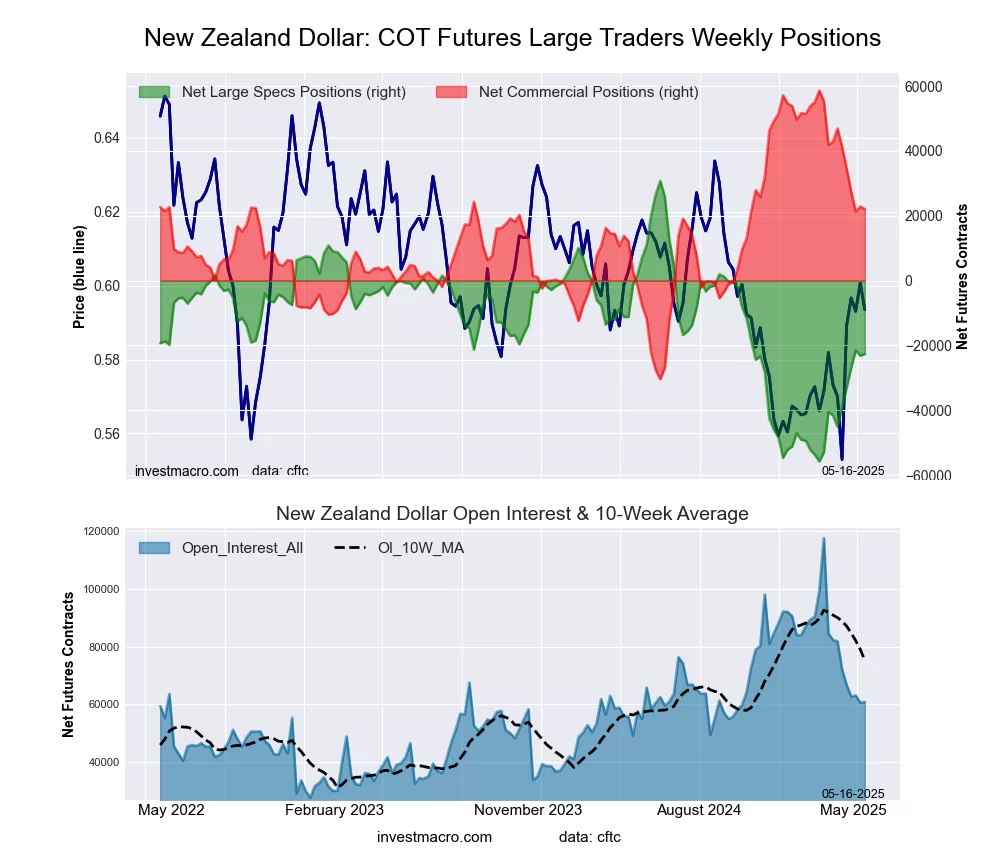 The New Zealand Dollar large speculator standing this week reached a net position of -22,612 contracts in the data reported through Tuesday. This was a weekly rise of 523 contracts from the previous week which had a total of -23,135 net contracts.
This week’s current strength score (the trader positioning range over the past three years, measured from 0 to 100) shows the speculators are currently Bearish with a score of 38.3 percent. The commercials are Bullish with a score of 59.0 percent and the small traders (not shown in chart) are Bullish with a score of 59.7 percent.
Price Trend-Following Model: Uptrend
Our weekly trend-following model classifies the current market price position as: Uptrend.
| NEW ZEALAND DOLLAR Statistics | SPECULATORS | COMMERCIALS | SMALL TRADERS |
| – Percent of Open Interest Longs: | 16.8 | 74.6 | 7.1 |
| – Percent of Open Interest Shorts: | 54.0 | 38.2 | 6.3 |
| – Net Position: | -22,612 | 22,116 | 496 |
| – Gross Longs: | 10,207 | 45,320 | 4,303 |
| – Gross Shorts: | 32,819 | 23,204 | 3,807 |
| – Long to Short Ratio: | 0.3 to 1 | 2.0 to 1 | 1.1 to 1 |
| NET POSITION TREND: | |||
| – Strength Index Score (3 Year Range Pct): | 38.3 | 59.0 | 59.7 |
| – Strength Index Reading (3 Year Range): | Bearish | Bullish | Bullish |
| NET POSITION MOVEMENT INDEX: | |||
| – 6-Week Change in Strength Index: | 25.9 | -27.8 | 29.8 |
Mexican Peso Futures:
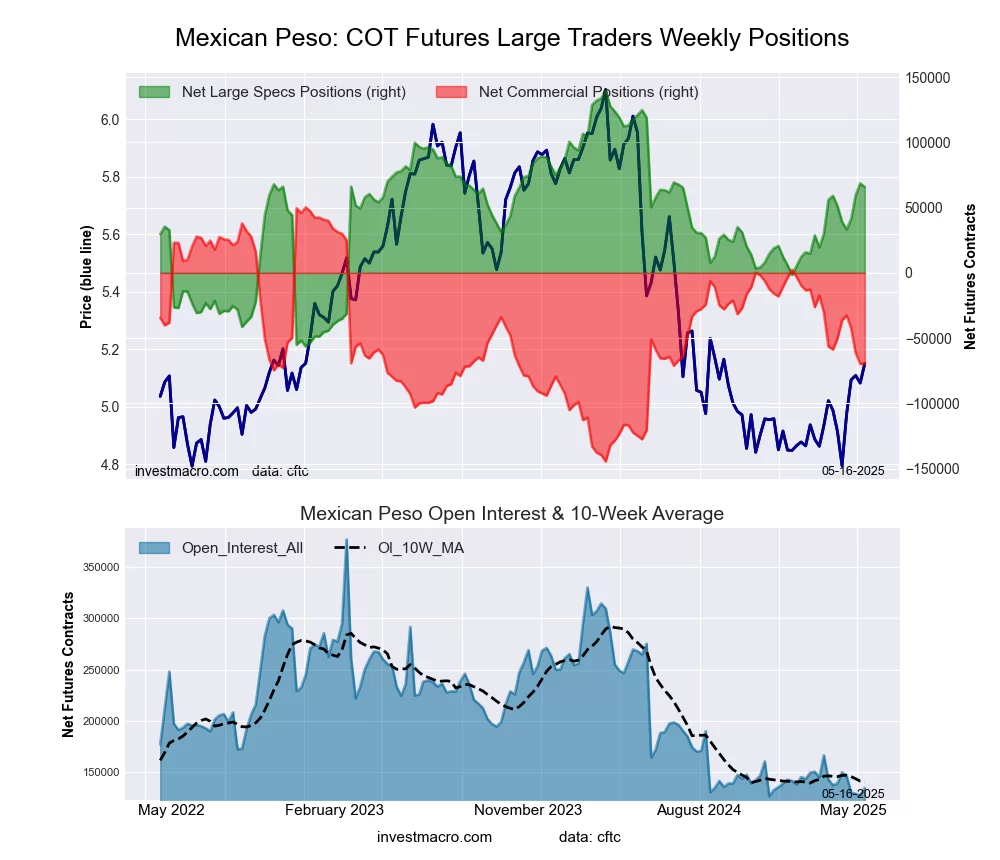 The Mexican Peso large speculator standing this week reached a net position of 65,706 contracts in the data reported through Tuesday. This was a weekly lowering of -2,849 contracts from the previous week which had a total of 68,555 net contracts.
This week’s current strength score (the trader positioning range over the past three years, measured from 0 to 100) shows the speculators are currently Bullish with a score of 62.3 percent. The commercials are Bearish with a score of 38.5 percent and the small traders (not shown in chart) are Bearish with a score of 44.0 percent.
Price Trend-Following Model: Strong Uptrend
Our weekly trend-following model classifies the current market price position as: Strong Uptrend.
| MEXICAN PESO Statistics | SPECULATORS | COMMERCIALS | SMALL TRADERS |
| – Percent of Open Interest Longs: | 66.9 | 26.7 | 5.3 |
| – Percent of Open Interest Shorts: | 18.2 | 78.2 | 2.4 |
| – Net Position: | 65,706 | -69,541 | 3,835 |
| – Gross Longs: | 90,191 | 35,941 | 7,084 |
| – Gross Shorts: | 24,485 | 105,482 | 3,249 |
| – Long to Short Ratio: | 3.7 to 1 | 0.3 to 1 | 2.2 to 1 |
| NET POSITION TREND: | |||
| – Strength Index Score (3 Year Range Pct): | 62.3 | 38.5 | 44.0 |
| – Strength Index Reading (3 Year Range): | Bullish | Bearish | Bearish |
| NET POSITION MOVEMENT INDEX: | |||
| – 6-Week Change in Strength Index: | 7.5 | -10.0 | 26.6 |
Brazilian Real Futures:
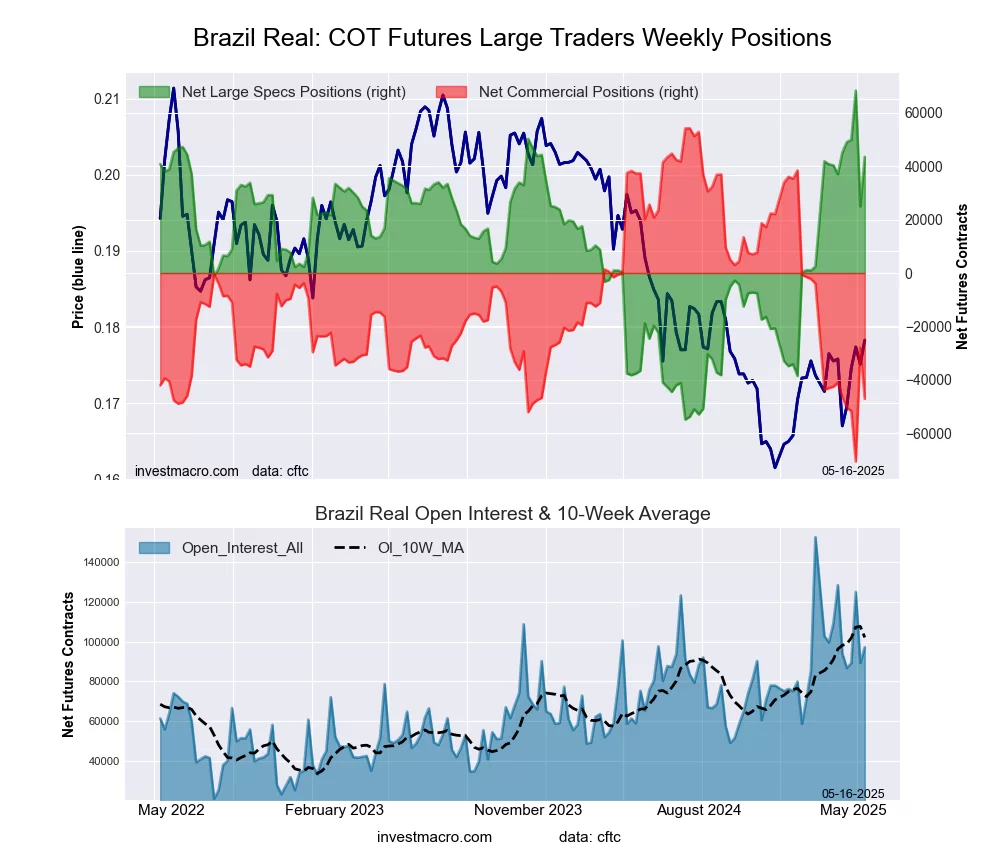 The Brazilian Real large speculator standing this week reached a net position of 43,515 contracts in the data reported through Tuesday. This was a weekly rise of 18,554 contracts from the previous week which had a total of 24,961 net contracts.
This week’s current strength score (the trader positioning range over the past three years, measured from 0 to 100) shows the speculators are currently Bullish with a score of 79.9 percent. The commercials are Bearish-Extreme with a score of 18.8 percent and the small traders (not shown in chart) are Bearish with a score of 40.9 percent.
Price Trend-Following Model: Uptrend
Our weekly trend-following model classifies the current market price position as: Uptrend.
| BRAZIL REAL Statistics | SPECULATORS | COMMERCIALS | SMALL TRADERS |
| – Percent of Open Interest Longs: | 63.9 | 30.7 | 4.9 |
| – Percent of Open Interest Shorts: | 19.1 | 79.1 | 1.2 |
| – Net Position: | 43,515 | -47,068 | 3,553 |
| – Gross Longs: | 62,123 | 29,847 | 4,729 |
| – Gross Shorts: | 18,608 | 76,915 | 1,176 |
| – Long to Short Ratio: | 3.3 to 1 | 0.4 to 1 | 4.0 to 1 |
| NET POSITION TREND: | |||
| – Strength Index Score (3 Year Range Pct): | 79.9 | 18.8 | 40.9 |
| – Strength Index Reading (3 Year Range): | Bullish | Bearish-Extreme | Bearish |
| NET POSITION MOVEMENT INDEX: | |||
| – 6-Week Change in Strength Index: | 5.3 | -4.8 | -2.6 |
Bitcoin Futures:
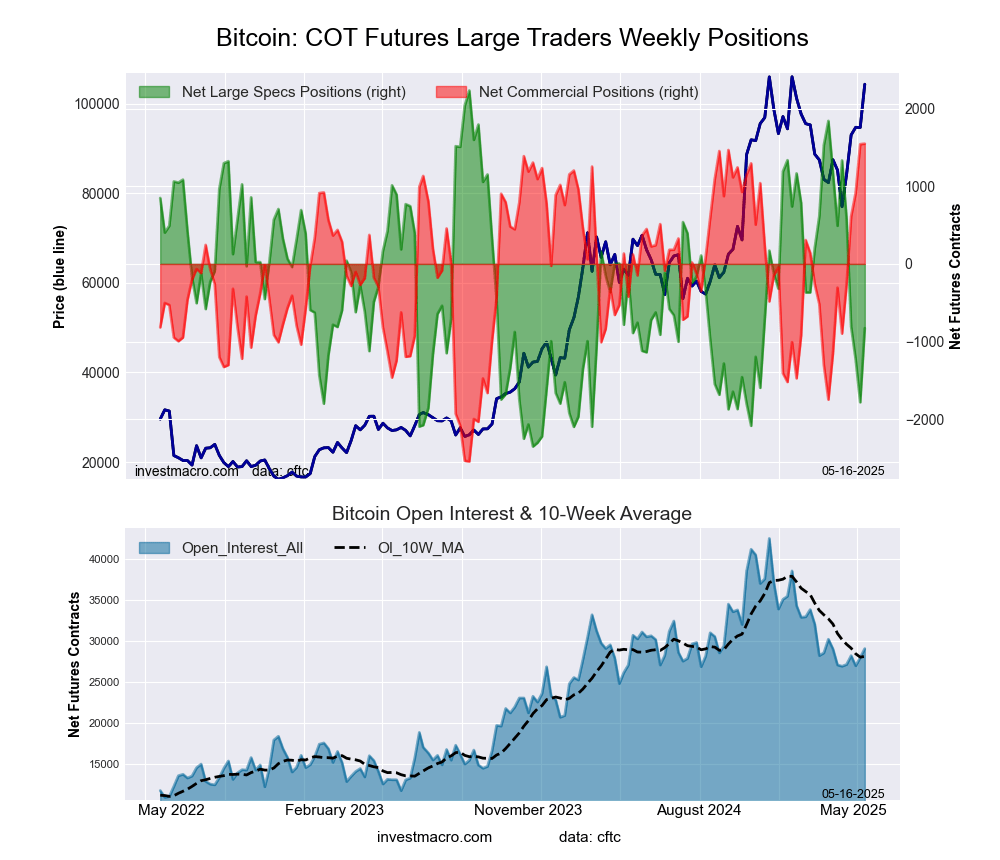 The Bitcoin large speculator standing this week reached a net position of -827 contracts in the data reported through Tuesday. This was a weekly increase of 954 contracts from the previous week which had a total of -1,781 net contracts.
This week’s current strength score (the trader positioning range over the past three years, measured from 0 to 100) shows the speculators are currently Bearish with a score of 33.3 percent. The commercials are Bullish-Extreme with a score of 100.0 percent and the small traders (not shown in chart) are Bearish-Extreme with a score of 0.0 percent.
Price Trend-Following Model: Weak Downtrend
Our weekly trend-following model classifies the current market price position as: Weak Downtrend.
| BITCOIN Statistics | SPECULATORS | COMMERCIALS | SMALL TRADERS |
| – Percent of Open Interest Longs: | 80.7 | 6.8 | 4.4 |
| – Percent of Open Interest Shorts: | 83.5 | 1.5 | 6.9 |
| – Net Position: | -827 | 1,548 | -721 |
| – Gross Longs: | 23,453 | 1,986 | 1,276 |
| – Gross Shorts: | 24,280 | 438 | 1,997 |
| – Long to Short Ratio: | 1.0 to 1 | 4.5 to 1 | 0.6 to 1 |
| NET POSITION TREND: | |||
| – Strength Index Score (3 Year Range Pct): | 33.3 | 100.0 | 0.0 |
| – Strength Index Reading (3 Year Range): | Bearish | Bullish-Extreme | Bearish-Extreme |
| NET POSITION MOVEMENT INDEX: | |||
| – 6-Week Change in Strength Index: | -28.8 | 45.3 | -27.8 |
Article By InvestMacro – Receive our weekly COT Newsletter
*COT Report: The COT data, released weekly to the public each Friday, is updated through the most recent Tuesday (data is 3 days old) and shows a quick view of how large speculators or non-commercials (for-profit traders) were positioned in the futures markets.
The CFTC categorizes trader positions according to commercial hedgers (traders who use futures contracts for hedging as part of the business), non-commercials (large traders who speculate to realize trading profits) and nonreportable traders (usually small traders/speculators) as well as their open interest (contracts open in the market at time of reporting). See CFTC criteria here.

- Bitcoin shows resilience to Middle East events. Oil market stabilizes Mar 5, 2026
- GBP/USD: Market Not Expecting BoE Rate Cut in March Mar 5, 2026
- Brent headed for $100? Mar 4, 2026
- Global stock indices continue sell-off due to Middle East conflict Mar 4, 2026
- USD/JPY to Quickly Return to Growth: Momentum Favours the US Dollar Mar 4, 2026
- European equities plunge amid Persian Gulf military conflict Mar 3, 2026
- Gold Rallies for Fifth Day, With External Risks Mounting Mar 3, 2026
- Iran Crisis: A Dangerous Turning Point Mar 2, 2026
- Oil prices have seen their largest surge in 4 years amid the military conflict in the Persian Gulf. Mar 2, 2026
- EUR/USD Reacts to Geopolitics and Data: Week Opens Nervously Mar 2, 2026