
By InvestMacro

Here are the latest charts and statistics for the Commitment of Traders (COT) reports data published by the Commodities Futures Trading Commission (CFTC).
The latest COT data is updated through Tuesday April 8th and shows a quick view of how large traders (for-profit speculators and commercial hedgers) were positioned in the futures markets.
Weekly Speculator Changes led by SOFR 3-Months, Fed Funds & Ultra Treasury Bonds

The COT bond market speculator bets were overall higher this week as six out of the nine bond markets we cover had higher positioning while the other three markets had lower speculator contracts.
Free Reports:
 Get our Weekly Commitment of Traders Reports - See where the biggest traders (Hedge Funds and Commercial Hedgers) are positioned in the futures markets on a weekly basis.
 Download Our Metatrader 4 Indicators – Put Our Free MetaTrader 4 Custom Indicators on your charts when you join our Weekly Newsletter
Leading the gains for the bond markets was the SOFR 3-Months (178,241 contracts) with the Fed Funds (68,611 contracts), the Ultra Treasury Bonds (53,719 contracts), the 2-Year Bonds (28,282 contracts), the US Treasury Bonds (14,494 contracts) and the 5-Year Bonds (102 contracts) also showing positive weeks.
The bond markets with declines in speculator bets for the week were the 10-Year Bonds (-215,207 contracts), the Ultra 10-Year Bonds (-46,367 contracts) and with the SOFR 1-Month (-35,300 contracts) also registering lower bets on the week.
Bonds Data:

Legend: Weekly Speculators Change | Speculators Current Net Position | Speculators Strength Score compared to last 3-Years (0-100 range)
Strength Scores led by Ultra Treasury Bonds & US Treasury Bonds

COT Strength Scores (a normalized measure of Speculator positions over a 3-Year range, from 0 to 100 where above 80 is Extreme-Bullish and below 20 is Extreme-Bearish) showed that the Ultra Treasury Bonds (98 percent) and the US Treasury Bonds (77 percent) lead the bond markets this week. The SOFR 1-Month (50 percent) comes in as the next highest in the weekly strength scores.
On the downside, the 5-Year Bond (0 percent), the 10-Year Bonds (6 percent) and the 2-Year Bonds (19.9 percent) come in at the lowest strength level currently and are in Extreme-Bearish territory (below 20 percent). The next lowest strength scores were the SOFR 3-Months (26 percent) and the Fed Funds (40 percent).
Strength Statistics:
Fed Funds (39.6 percent) vs Fed Funds previous week (26.9 percent)
2-Year Bond (19.9 percent) vs 2-Year Bond previous week (17.9 percent)
5-Year Bond (0.0 percent) vs 5-Year Bond previous week (0.0 percent)
10-Year Bond (6.2 percent) vs 10-Year Bond previous week (26.5 percent)
Ultra 10-Year Bond (46.3 percent) vs Ultra 10-Year Bond previous week (63.4 percent)
US Treasury Bond (77.1 percent) vs US Treasury Bond previous week (72.0 percent)
Ultra US Treasury Bond (97.9 percent) vs Ultra US Treasury Bond previous week (77.3 percent)
SOFR 1-Month (49.9 percent) vs SOFR 1-Month previous week (58.6 percent)
SOFR 3-Months (25.5 percent) vs SOFR 3-Months previous week (16.3 percent)
Ultra Treasury Bonds & SOFR 3-Months top the 6-Week Strength Trends

COT Strength Score Trends (or move index, calculates the 6-week changes in strength scores) showed that the Ultra Treasury Bonds (10 percent) and the SOFR 3-Months (3 percent) lead the past six weeks trends for bonds.
The Ultra 10-Year Bonds (-37 percent), the 10-Year Bonds (-36 percent), the 5-Year Bonds (-21 percent) and the US Treasury Bonds (-21 percent) lead the downside trend scores currently.
Strength Trend Statistics:
Fed Funds (-13.8 percent) vs Fed Funds previous week (-1.0 percent)
2-Year Bond (-3.4 percent) vs 2-Year Bond previous week (4.4 percent)
5-Year Bond (-20.6 percent) vs 5-Year Bond previous week (-14.8 percent)
10-Year Bond (-35.8 percent) vs 10-Year Bond previous week (-14.5 percent)
Ultra 10-Year Bond (-36.6 percent) vs Ultra 10-Year Bond previous week (-5.4 percent)
US Treasury Bond (-20.5 percent) vs US Treasury Bond previous week (-28.0 percent)
Ultra US Treasury Bond (10.5 percent) vs Ultra US Treasury Bond previous week (-3.0 percent)
SOFR 1-Month (0.2 percent) vs SOFR 1-Month previous week (-22.5 percent)
SOFR 3-Months (2.7 percent) vs SOFR 3-Months previous week (-5.7 percent)
30-Day Federal Funds Futures:
 The 30-Day Federal Funds large speculator standing this week equaled a net position of -81,232 contracts in the data reported through Tuesday. This was a weekly lift of 68,611 contracts from the previous week which had a total of -149,843 net contracts.
This week’s current strength score (the trader positioning range over the past three years, measured from 0 to 100) shows the speculators are currently Bearish with a score of 39.6 percent. The commercials are Bullish with a score of 55.5 percent and the small traders (not shown in chart) are Bullish with a score of 71.5 percent.
Price Trend-Following Model: Uptrend
Our weekly trend-following model classifies the current market price position as: Uptrend.
| 30-Day Federal Funds Statistics | SPECULATORS | COMMERCIALS | SMALL TRADERS |
| – Percent of Open Interest Longs: | 18.6 | 66.4 | 1.9 |
| – Percent of Open Interest Shorts: | 22.3 | 63.1 | 1.6 |
| – Net Position: | -81,232 | 73,959 | 7,273 |
| – Gross Longs: | 409,747 | 1,465,598 | 43,016 |
| – Gross Shorts: | 490,979 | 1,391,639 | 35,743 |
| – Long to Short Ratio: | 0.8 to 1 | 1.1 to 1 | 1.2 to 1 |
| NET POSITION TREND: | |||
| – Strength Index Score (3 Year Range Pct): | 39.6 | 55.5 | 71.5 |
| – Strength Index Reading (3 Year Range): | Bearish | Bullish | Bullish |
| NET POSITION MOVEMENT INDEX: | |||
| – 6-Week Change in Strength Index: | -13.8 | 15.0 | -10.0 |
Secured Overnight Financing Rate (3-Month) Futures:
 The Secured Overnight Financing Rate (3-Month) large speculator standing this week equaled a net position of -673,042 contracts in the data reported through Tuesday. This was a weekly advance of 178,241 contracts from the previous week which had a total of -851,283 net contracts.
This week’s current strength score (the trader positioning range over the past three years, measured from 0 to 100) shows the speculators are currently Bearish with a score of 25.5 percent. The commercials are Bullish with a score of 74.1 percent and the small traders (not shown in chart) are Bullish-Extreme with a score of 86.5 percent.
Price Trend-Following Model: Weak Uptrend
Our weekly trend-following model classifies the current market price position as: Weak Uptrend.
| SOFR 3-Months Statistics | SPECULATORS | COMMERCIALS | SMALL TRADERS |
| – Percent of Open Interest Longs: | 11.9 | 60.5 | 0.3 |
| – Percent of Open Interest Shorts: | 18.2 | 54.2 | 0.3 |
| – Net Position: | -673,042 | 667,863 | 5,179 |
| – Gross Longs: | 1,272,616 | 6,456,441 | 32,612 |
| – Gross Shorts: | 1,945,658 | 5,788,578 | 27,433 |
| – Long to Short Ratio: | 0.7 to 1 | 1.1 to 1 | 1.2 to 1 |
| NET POSITION TREND: | |||
| – Strength Index Score (3 Year Range Pct): | 25.5 | 74.1 | 86.5 |
| – Strength Index Reading (3 Year Range): | Bearish | Bullish | Bullish-Extreme |
| NET POSITION MOVEMENT INDEX: | |||
| – 6-Week Change in Strength Index: | 2.7 | -1.7 | -9.4 |
Individual Bond Markets:
Secured Overnight Financing Rate (1-Month) Futures:
 The Secured Overnight Financing Rate (1-Month) large speculator standing this week equaled a net position of -75,627 contracts in the data reported through Tuesday. This was a weekly decrease of -35,300 contracts from the previous week which had a total of -40,327 net contracts.
This week’s current strength score (the trader positioning range over the past three years, measured from 0 to 100) shows the speculators are currently Bearish with a score of 49.9 percent. The commercials are Bullish with a score of 50.6 percent and the small traders (not shown in chart) are Bullish-Extreme with a score of 80.5 percent.
Price Trend-Following Model: Uptrend
Our weekly trend-following model classifies the current market price position as: Uptrend.
| SOFR 1-Month Statistics | SPECULATORS | COMMERCIALS | SMALL TRADERS |
| – Percent of Open Interest Longs: | 21.8 | 64.3 | 0.1 |
| – Percent of Open Interest Shorts: | 27.4 | 58.6 | 0.2 |
| – Net Position: | -75,627 | 77,506 | -1,879 |
| – Gross Longs: | 295,104 | 871,651 | 1,010 |
| – Gross Shorts: | 370,731 | 794,145 | 2,889 |
| – Long to Short Ratio: | 0.8 to 1 | 1.1 to 1 | 0.3 to 1 |
| NET POSITION TREND: | |||
| – Strength Index Score (3 Year Range Pct): | 49.9 | 50.6 | 80.5 |
| – Strength Index Reading (3 Year Range): | Bearish | Bullish | Bullish-Extreme |
| NET POSITION MOVEMENT INDEX: | |||
| – 6-Week Change in Strength Index: | 0.2 | -2.0 | 19.6 |
2-Year Treasury Note Futures:
 The 2-Year Treasury Note large speculator standing this week equaled a net position of -1,198,109 contracts in the data reported through Tuesday. This was a weekly gain of 28,282 contracts from the previous week which had a total of -1,226,391 net contracts.
This week’s current strength score (the trader positioning range over the past three years, measured from 0 to 100) shows the speculators are currently Bearish-Extreme with a score of 19.9 percent. The commercials are Bullish with a score of 78.5 percent and the small traders (not shown in chart) are Bullish with a score of 76.5 percent.
Price Trend-Following Model: Uptrend
Our weekly trend-following model classifies the current market price position as: Uptrend.
| 2-Year Treasury Note Statistics | SPECULATORS | COMMERCIALS | SMALL TRADERS |
| – Percent of Open Interest Longs: | 15.1 | 76.3 | 6.0 |
| – Percent of Open Interest Shorts: | 44.9 | 49.7 | 2.8 |
| – Net Position: | -1,198,109 | 1,070,287 | 127,822 |
| – Gross Longs: | 606,624 | 3,069,452 | 240,732 |
| – Gross Shorts: | 1,804,733 | 1,999,165 | 112,910 |
| – Long to Short Ratio: | 0.3 to 1 | 1.5 to 1 | 2.1 to 1 |
| NET POSITION TREND: | |||
| – Strength Index Score (3 Year Range Pct): | 19.9 | 78.5 | 76.5 |
| – Strength Index Reading (3 Year Range): | Bearish-Extreme | Bullish | Bullish |
| NET POSITION MOVEMENT INDEX: | |||
| – 6-Week Change in Strength Index: | -3.4 | 5.2 | -4.7 |
5-Year Treasury Note Futures:
 The 5-Year Treasury Note large speculator standing this week equaled a net position of -2,021,575 contracts in the data reported through Tuesday. This was a weekly rise of 102 contracts from the previous week which had a total of -2,021,677 net contracts.
This week’s current strength score (the trader positioning range over the past three years, measured from 0 to 100) shows the speculators are currently Bearish-Extreme with a score of 0.0 percent. The commercials are Bullish-Extreme with a score of 96.4 percent and the small traders (not shown in chart) are Bullish-Extreme with a score of 92.4 percent.
Price Trend-Following Model: Uptrend
Our weekly trend-following model classifies the current market price position as: Uptrend.
| 5-Year Treasury Note Statistics | SPECULATORS | COMMERCIALS | SMALL TRADERS |
| – Percent of Open Interest Longs: | 7.2 | 84.2 | 6.5 |
| – Percent of Open Interest Shorts: | 38.3 | 56.4 | 3.2 |
| – Net Position: | -2,021,575 | 1,805,555 | 216,020 |
| – Gross Longs: | 466,812 | 5,463,500 | 422,475 |
| – Gross Shorts: | 2,488,387 | 3,657,945 | 206,455 |
| – Long to Short Ratio: | 0.2 to 1 | 1.5 to 1 | 2.0 to 1 |
| NET POSITION TREND: | |||
| – Strength Index Score (3 Year Range Pct): | 0.0 | 96.4 | 92.4 |
| – Strength Index Reading (3 Year Range): | Bearish-Extreme | Bullish-Extreme | Bullish-Extreme |
| NET POSITION MOVEMENT INDEX: | |||
| – 6-Week Change in Strength Index: | -20.6 | 22.5 | 9.3 |
10-Year Treasury Note Futures:
 The 10-Year Treasury Note large speculator standing this week equaled a net position of -1,078,470 contracts in the data reported through Tuesday. This was a weekly lowering of -215,207 contracts from the previous week which had a total of -863,263 net contracts.
This week’s current strength score (the trader positioning range over the past three years, measured from 0 to 100) shows the speculators are currently Bearish-Extreme with a score of 6.2 percent. The commercials are Bullish-Extreme with a score of 90.9 percent and the small traders (not shown in chart) are Bullish-Extreme with a score of 100.0 percent.
Price Trend-Following Model: Weak Uptrend
Our weekly trend-following model classifies the current market price position as: Weak Uptrend.
| 10-Year Treasury Note Statistics | SPECULATORS | COMMERCIALS | SMALL TRADERS |
| – Percent of Open Interest Longs: | 9.3 | 78.0 | 10.0 |
| – Percent of Open Interest Shorts: | 31.3 | 59.2 | 6.7 |
| – Net Position: | -1,078,470 | 916,013 | 162,457 |
| – Gross Longs: | 452,496 | 3,813,010 | 489,903 |
| – Gross Shorts: | 1,530,966 | 2,896,997 | 327,446 |
| – Long to Short Ratio: | 0.3 to 1 | 1.3 to 1 | 1.5 to 1 |
| NET POSITION TREND: | |||
| – Strength Index Score (3 Year Range Pct): | 6.2 | 90.9 | 100.0 |
| – Strength Index Reading (3 Year Range): | Bearish-Extreme | Bullish-Extreme | Bullish-Extreme |
| NET POSITION MOVEMENT INDEX: | |||
| – 6-Week Change in Strength Index: | -35.8 | 32.9 | 31.1 |
Ultra 10-Year Notes Futures:
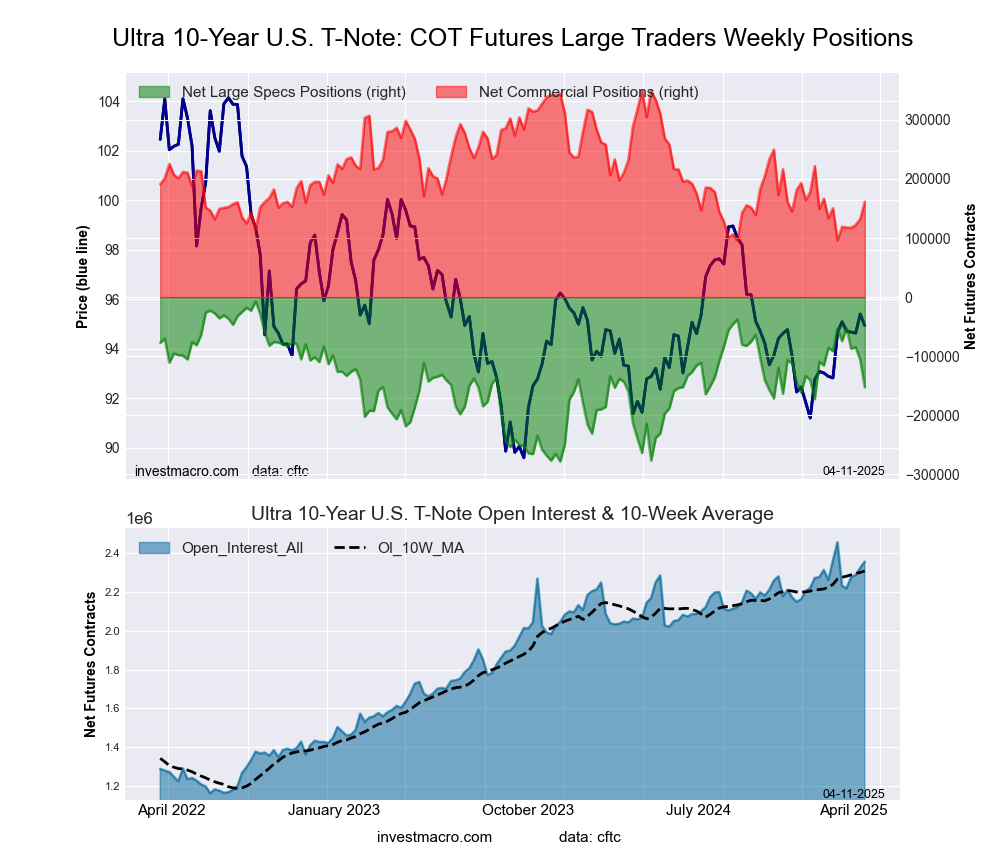 The Ultra 10-Year Notes large speculator standing this week equaled a net position of -152,350 contracts in the data reported through Tuesday. This was a weekly fall of -46,367 contracts from the previous week which had a total of -105,983 net contracts.
This week’s current strength score (the trader positioning range over the past three years, measured from 0 to 100) shows the speculators are currently Bearish with a score of 46.3 percent. The commercials are Bearish with a score of 25.8 percent and the small traders (not shown in chart) are Bullish-Extreme with a score of 100.0 percent.
Price Trend-Following Model: Weak Uptrend
Our weekly trend-following model classifies the current market price position as: Weak Uptrend.
| Ultra 10-Year Notes Statistics | SPECULATORS | COMMERCIALS | SMALL TRADERS |
| – Percent of Open Interest Longs: | 15.2 | 74.0 | 10.4 |
| – Percent of Open Interest Shorts: | 21.6 | 67.1 | 10.7 |
| – Net Position: | -152,350 | 161,266 | -8,916 |
| – Gross Longs: | 357,035 | 1,741,444 | 244,020 |
| – Gross Shorts: | 509,385 | 1,580,178 | 252,936 |
| – Long to Short Ratio: | 0.7 to 1 | 1.1 to 1 | 1.0 to 1 |
| NET POSITION TREND: | |||
| – Strength Index Score (3 Year Range Pct): | 46.3 | 25.8 | 100.0 |
| – Strength Index Reading (3 Year Range): | Bearish | Bearish | Bullish-Extreme |
| NET POSITION MOVEMENT INDEX: | |||
| – 6-Week Change in Strength Index: | -36.6 | 25.7 | 24.4 |
US Treasury Bonds Futures:
 The US Treasury Bonds large speculator standing this week equaled a net position of -18,154 contracts in the data reported through Tuesday. This was a weekly gain of 14,494 contracts from the previous week which had a total of -32,648 net contracts.
This week’s current strength score (the trader positioning range over the past three years, measured from 0 to 100) shows the speculators are currently Bullish with a score of 77.1 percent. The commercials are Bearish-Extreme with a score of 15.5 percent and the small traders (not shown in chart) are Bullish-Extreme with a score of 85.9 percent.
Price Trend-Following Model: Strong Downtrend
Our weekly trend-following model classifies the current market price position as: Strong Downtrend.
| US Treasury Bonds Statistics | SPECULATORS | COMMERCIALS | SMALL TRADERS |
| – Percent of Open Interest Longs: | 14.5 | 71.7 | 12.5 |
| – Percent of Open Interest Shorts: | 15.4 | 76.0 | 7.2 |
| – Net Position: | -18,154 | -80,689 | 98,843 |
| – Gross Longs: | 266,449 | 1,321,385 | 230,900 |
| – Gross Shorts: | 284,603 | 1,402,074 | 132,057 |
| – Long to Short Ratio: | 0.9 to 1 | 0.9 to 1 | 1.7 to 1 |
| NET POSITION TREND: | |||
| – Strength Index Score (3 Year Range Pct): | 77.1 | 15.5 | 85.9 |
| – Strength Index Reading (3 Year Range): | Bullish | Bearish-Extreme | Bullish-Extreme |
| NET POSITION MOVEMENT INDEX: | |||
| – 6-Week Change in Strength Index: | -20.5 | 15.5 | 4.0 |
Ultra US Treasury Bonds Futures:
 The Ultra US Treasury Bonds large speculator standing this week equaled a net position of -200,310 contracts in the data reported through Tuesday. This was a weekly boost of 53,719 contracts from the previous week which had a total of -254,029 net contracts.
This week’s current strength score (the trader positioning range over the past three years, measured from 0 to 100) shows the speculators are currently Bullish-Extreme with a score of 97.9 percent. The commercials are Bearish-Extreme with a score of 0.0 percent and the small traders (not shown in chart) are Bullish with a score of 65.5 percent.
Price Trend-Following Model: Strong Downtrend
Our weekly trend-following model classifies the current market price position as: Strong Downtrend.
| Ultra US Treasury Bonds Statistics | SPECULATORS | COMMERCIALS | SMALL TRADERS |
| – Percent of Open Interest Longs: | 7.6 | 81.0 | 9.7 |
| – Percent of Open Interest Shorts: | 18.5 | 72.3 | 7.5 |
| – Net Position: | -200,310 | 159,486 | 40,824 |
| – Gross Longs: | 138,304 | 1,483,087 | 178,385 |
| – Gross Shorts: | 338,614 | 1,323,601 | 137,561 |
| – Long to Short Ratio: | 0.4 to 1 | 1.1 to 1 | 1.3 to 1 |
| NET POSITION TREND: | |||
| – Strength Index Score (3 Year Range Pct): | 97.9 | 0.0 | 65.5 |
| – Strength Index Reading (3 Year Range): | Bullish-Extreme | Bearish-Extreme | Bullish |
| NET POSITION MOVEMENT INDEX: | |||
| – 6-Week Change in Strength Index: | 10.5 | -24.5 | 46.4 |
Article By InvestMacro – Receive our weekly COT Newsletter
*COT Report: The COT data, released weekly to the public each Friday, is updated through the most recent Tuesday (data is 3 days old) and shows a quick view of how large speculators or non-commercials (for-profit traders) were positioned in the futures markets.
The CFTC categorizes trader positions according to commercial hedgers (traders who use futures contracts for hedging as part of the business), non-commercials (large traders who speculate to realize trading profits) and nonreportable traders (usually small traders/speculators) as well as their open interest (contracts open in the market at time of reporting). See CFTC criteria here.

- Bitcoin shows resilience to Middle East events. Oil market stabilizes Mar 5, 2026
- GBP/USD: Market Not Expecting BoE Rate Cut in March Mar 5, 2026
- Brent headed for $100? Mar 4, 2026
- Global stock indices continue sell-off due to Middle East conflict Mar 4, 2026
- USD/JPY to Quickly Return to Growth: Momentum Favours the US Dollar Mar 4, 2026
- European equities plunge amid Persian Gulf military conflict Mar 3, 2026
- Gold Rallies for Fifth Day, With External Risks Mounting Mar 3, 2026
- Iran Crisis: A Dangerous Turning Point Mar 2, 2026
- Oil prices have seen their largest surge in 4 years amid the military conflict in the Persian Gulf. Mar 2, 2026
- EUR/USD Reacts to Geopolitics and Data: Week Opens Nervously Mar 2, 2026