By RoboForex Analytical Department
Gold prices surged to a new record high of 2,729 USD per troy ounce on Monday, driven by escalating conflicts in the Middle East and the heightened uncertainty surrounding the upcoming US presidential election. These persistent geopolitical factors, particularly the closely contested race between Donald Trump and Kamala Harris, have bolstered investor demand for safe-haven assets like gold.
The intensification of hostilities in the Middle East, particularly with Israel’s ongoing discussions about further actions against Iran, has significantly influenced market sentiment. Despite calls from US President Joe Biden for a ceasefire, Israel’s reluctance to make concessions has only added to the geopolitical tensions affecting global markets.
As the US election day on 5 November approaches, investors are increasingly repositioning their portfolios, favouring the stability and security that gold provides during political uncertainty. Preliminary polls indicate that the election could be one of the closest in recent history, further enhancing gold’s appeal as a protective investment.
Market analysts are now revising their expectations for gold upwards, with some speculating that prices could reach 3,000 USD per troy ounce by Q4 2025. This optimistic outlook is further supported by the surge in interest in silver, which has reached its highest price since 2012 due to similar bullish sentiments in the precious metals market.
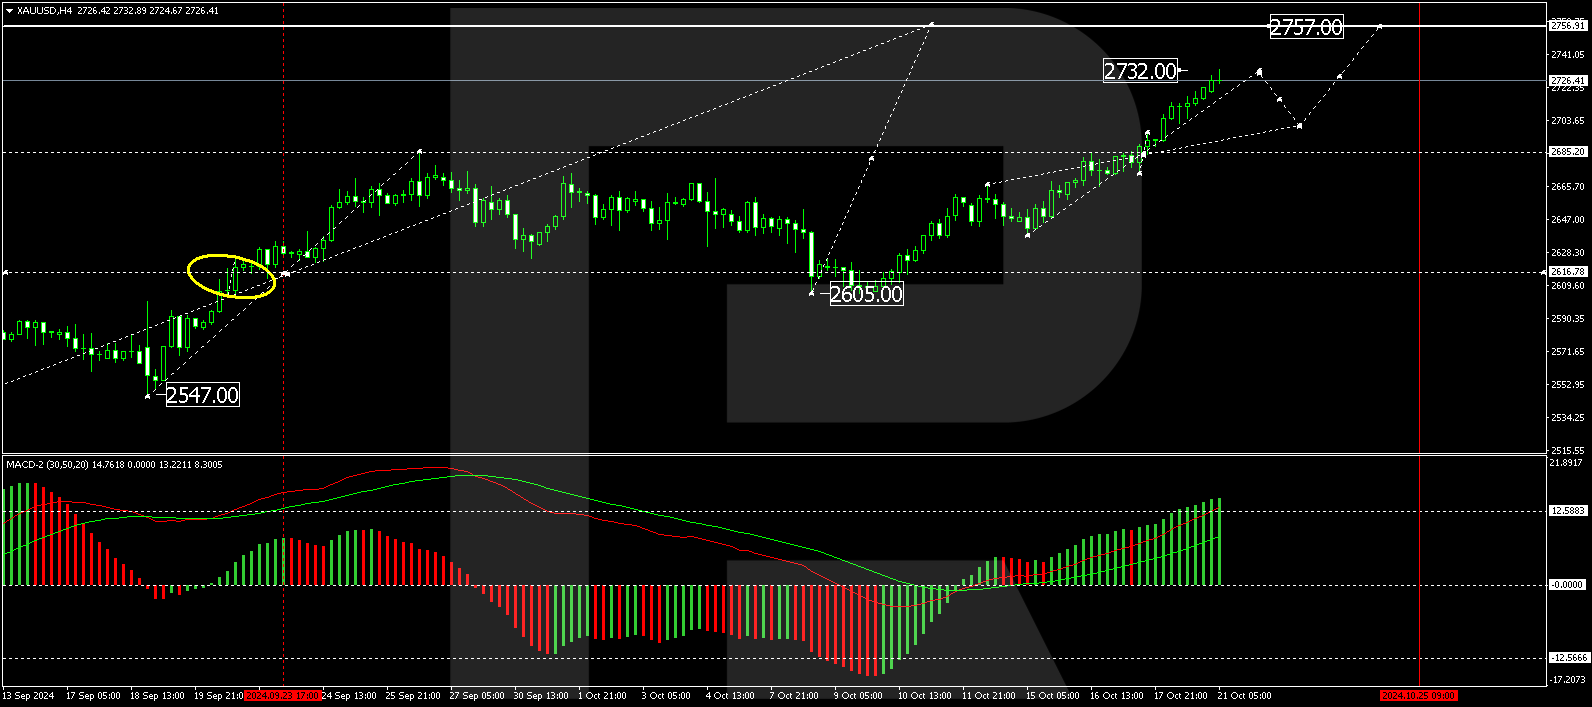
Technical analysis of gold (XAU/USD)
Free Reports:
The gold market has successfully breached the 2,685 level, paving the way for upward movement. After achieving a local high of 2,732, the market is currently targeting the 2,757 level. A corrective pullback to at least 2,700 is anticipated before potentially resuming the upward trajectory towards 2,757. This bullish outlook is supported by the MACD indicator, whose signal line is significantly above zero and climbing, indicating strong upward momentum.
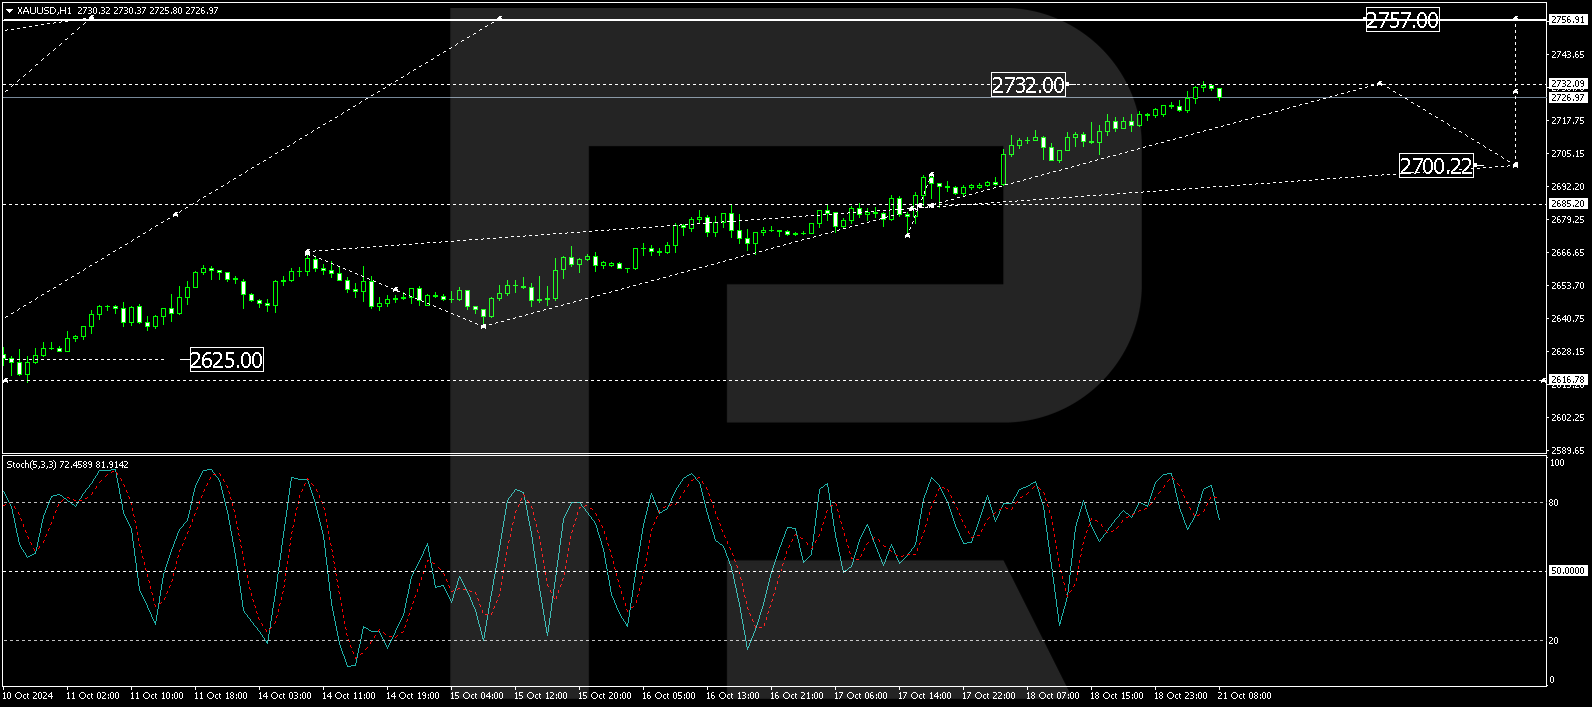
On the hourly chart, gold has established a growth wave, peaking at 2,732, with a consolidation pattern forming just below this level. A downward correction towards 2,700 is expected shortly. Upon completing this correction, the market may initiate another upward phase, targeting a retest of 2,733, potentially extending towards 2,757. The Stochastic oscillator corroborates this scenario, currently positioned above 80 but pointing downwards, suggesting a brief consolidation or correction may occur before further gains.
Disclaimer
Any forecasts contained herein are based on the author’s particular opinion. This analysis may not be treated as trading advice. RoboForex bears no responsibility for trading results based on trading recommendations and reviews contained herein.
By ForexTime FXTM’s USDInd ↑ 2% MTD Dollar best performing G10 currency MTD Geopolitical risk…
By JustMarkets The US stock market concluded Thursday’s session in the red as the escalating…
By Analytical Department RoboForex EUR/USD is holding near 1.1620 on Friday, with the US dollar…
By JustMarkets The US stock market rose on Wednesday. By the end of the day,…
By Daniele D'Alvia, Queen Mary University of London When a conflict escalates, financial markets respond…
By Analytical Department RoboForex GBP/USD contracted to 1.3350 on Thursday, with the pound remaining under…
This website uses cookies.