
By InvestMacro
Here are the latest charts and statistics for the Commitment of Traders (COT) data published by the Commodities Futures Trading Commission (CFTC).
The latest COT data is updated through Tuesday August 13th and shows a quick view of how large traders (for-profit speculators and commercial entities) were positioned in the futures markets.
Weekly Speculator Changes led by VIX
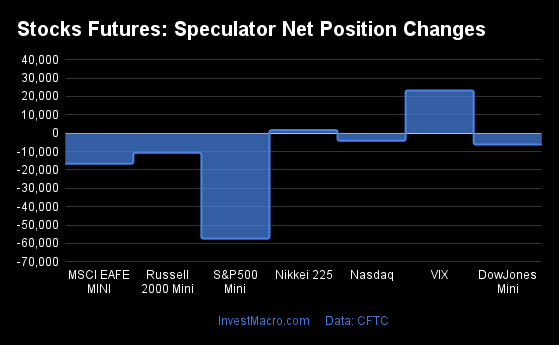
The COT stock markets speculator bets were lower this week as just two out of the seven stock markets we cover had higher positioning while the other five markets had lower speculator contracts.
Free Reports:
 Download Our Metatrader 4 Indicators – Put Our Free MetaTrader 4 Custom Indicators on your charts when you join our Weekly Newsletter
 Get our Weekly Commitment of Traders Reports - See where the biggest traders (Hedge Funds and Commercial Hedgers) are positioned in the futures markets on a weekly basis.
Leading the gains for the stock markets was the VIX (23,283 contracts) with the Nikkei 225 (1,652 contracts) also showing a positive week.
The markets with the declines in speculator bets this week were the S&P500-Mini (-57,441 contracts), the MSCI EAFE-Mini (-16,647 contracts), the Russell-Mini (-10,661 contracts), the DowJones-Mini (-6,132 contracts) and with the Nasdaq-Mini (-4,127 contracts) also registering lower bets on the week.
Stock Market Net Speculators Leaderboard
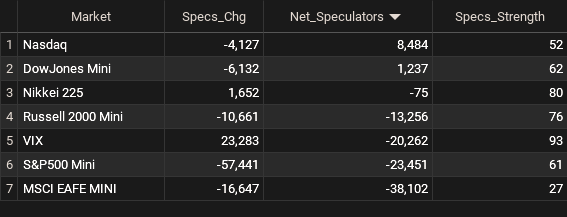
Legend: Weekly Speculators Change | Speculators Current Net Position | Speculators Strength Score compared to last 3-Years (0-100 range)
Strength Scores led by VIX & Nikkei 225
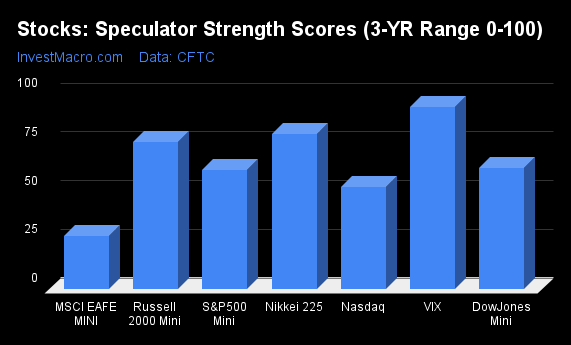
COT Strength Scores (a normalized measure of Speculator positions over a 3-Year range, from 0 to 100 where above 80 is Extreme-Bullish and below 20 is Extreme-Bearish) showed that the VIX (93 percent) and the Nikkei 225 (80 percent) lead the stock markets this week. The Russell-Mini (76 percent) and the DowJones-Mini (62 percent) come in as the next highest in the weekly strength scores.
On the downside, the MSCI EAFE-Mini (27 percent) comes in at the lowest strength level currently.
Strength Statistics:
VIX (93.2 percent) vs VIX previous week (68.0 percent)
S&P500-Mini (61.2 percent) vs S&P500-Mini previous week (69.8 percent)
DowJones-Mini (62.3 percent) vs DowJones-Mini previous week (72.3 percent)
Nasdaq-Mini (52.3 percent) vs Nasdaq-Mini previous week (58.7 percent)
Russell2000-Mini (75.7 percent) vs Russell2000-Mini previous week (83.3 percent)
Nikkei USD (79.5 percent) vs Nikkei USD previous week (65.4 percent)
EAFE-Mini (27.0 percent) vs EAFE-Mini previous week (44.2 percent)
Russell-Mini & Nikkei 225 top the 6-Week Strength Trends
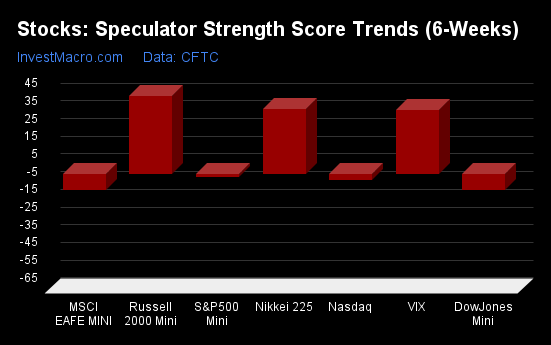
COT Strength Score Trends (or move index, calculates the 6-week changes in strength scores) showed that the Russell-Mini (44 percent) leads the past six weeks trends for the stock markets. The Nikkei 225 (37 percent) and the VIX (36 percent) are the next highest positive movers in the latest trends data.
The MSCI EAFE-Mini (-9 percent) and the DowJones-Mini (-9 percent) lead the downside trend scores currently.
Strength Trend Statistics:
VIX (35.9 percent) vs VIX previous week (18.9 percent)
S&P500-Mini (-1.7 percent) vs S&P500-Mini previous week (14.8 percent)
DowJones-Mini (-8.9 percent) vs DowJones-Mini previous week (12.8 percent)
Nasdaq-Mini (-3.6 percent) vs Nasdaq-Mini previous week (8.1 percent)
Russell2000-Mini (44.1 percent) vs Russell2000-Mini previous week (33.6 percent)
Nikkei USD (36.6 percent) vs Nikkei USD previous week (27.1 percent)
EAFE-Mini (-9.1 percent) vs EAFE-Mini previous week (3.5 percent)
Individual Stock Market Charts:
VIX Volatility Futures:
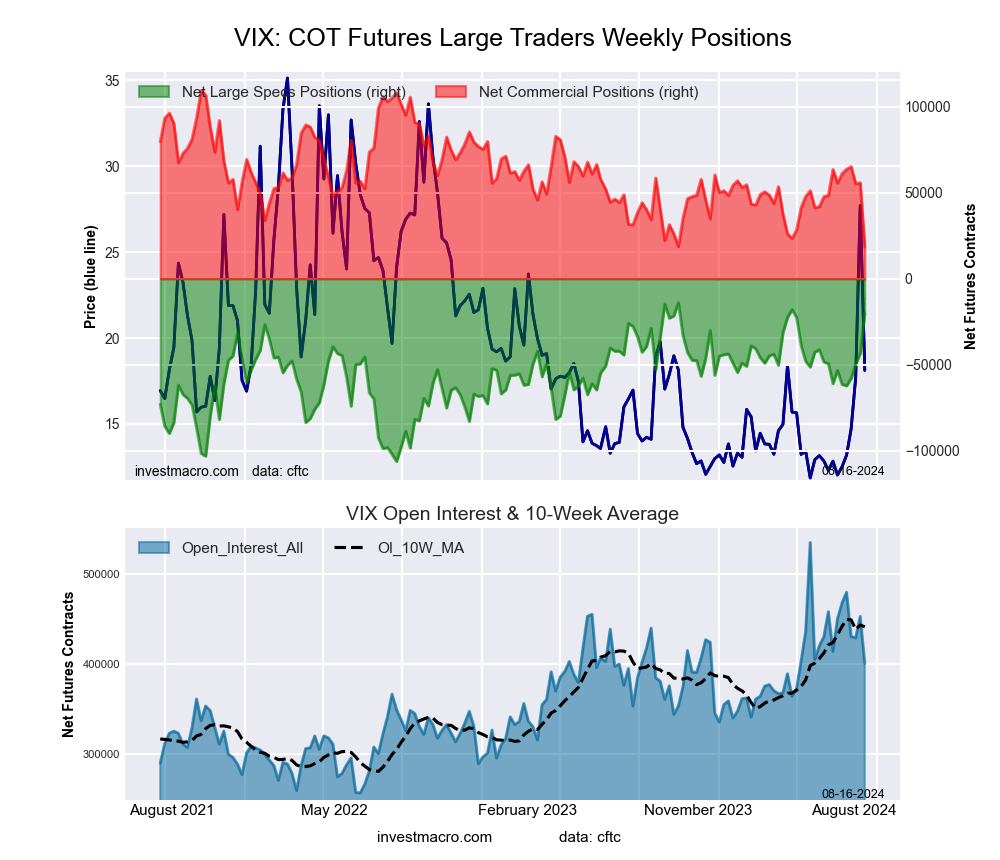 The VIX Volatility large speculator standing this week reached a net position of -20,262 contracts in the data reported through Tuesday. This was a weekly lift of 23,283 contracts from the previous week which had a total of -43,545 net contracts.
This week’s current strength score (the trader positioning range over the past three years, measured from 0 to 100) shows the speculators are currently Bullish-Extreme with a score of 93.2 percent. The commercials are Bearish-Extreme with a score of 0.0 percent and the small traders (not shown in chart) are Bullish-Extreme with a score of 100.0 percent.
Price Trend-Following Model: Uptrend
Our weekly trend-following model classifies the current market price position as: Uptrend. The current action for the model is considered to be: Hold – Maintain Long Position.
| VIX Volatility Futures Statistics | SPECULATORS | COMMERCIALS | SMALL TRADERS |
| – Percent of Open Interest Longs: | 23.9 | 45.6 | 6.7 |
| – Percent of Open Interest Shorts: | 28.9 | 41.0 | 6.2 |
| – Net Position: | -20,262 | 18,416 | 1,846 |
| – Gross Longs: | 95,786 | 182,837 | 26,785 |
| – Gross Shorts: | 116,048 | 164,421 | 24,939 |
| – Long to Short Ratio: | 0.8 to 1 | 1.1 to 1 | 1.1 to 1 |
| NET POSITION TREND: | |||
| – Strength Index Score (3 Year Range Pct): | 93.2 | 0.0 | 100.0 |
| – Strength Index Reading (3 Year Range): | Bullish-Extreme | Bearish-Extreme | Bullish-Extreme |
| NET POSITION MOVEMENT INDEX: | |||
| – 6-Week Change in Strength Index: | 35.9 | -40.9 | 19.8 |
S&P500 Mini Futures:
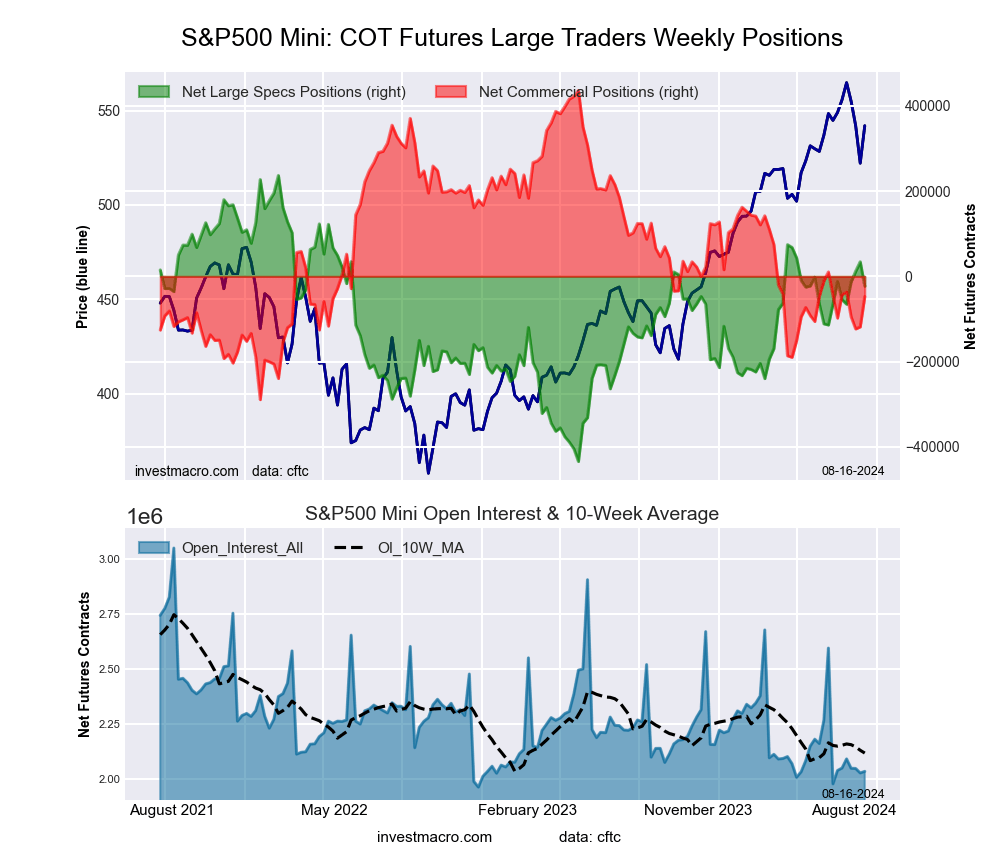 The S&P500 Mini large speculator standing this week reached a net position of -23,451 contracts in the data reported through Tuesday. This was a weekly decline of -57,441 contracts from the previous week which had a total of 33,990 net contracts.
This week’s current strength score (the trader positioning range over the past three years, measured from 0 to 100) shows the speculators are currently Bullish with a score of 61.2 percent. The commercials are Bearish with a score of 33.3 percent and the small traders (not shown in chart) are Bullish with a score of 66.7 percent.
Price Trend-Following Model: Strong Uptrend
Our weekly trend-following model classifies the current market price position as: Strong Uptrend. The current action for the model is considered to be: Hold – Maintain Long Position.
| S&P500 Mini Futures Statistics | SPECULATORS | COMMERCIALS | SMALL TRADERS |
| – Percent of Open Interest Longs: | 14.1 | 70.9 | 12.3 |
| – Percent of Open Interest Shorts: | 15.2 | 73.2 | 8.9 |
| – Net Position: | -23,451 | -47,518 | 70,969 |
| – Gross Longs: | 285,987 | 1,441,253 | 250,900 |
| – Gross Shorts: | 309,438 | 1,488,771 | 179,931 |
| – Long to Short Ratio: | 0.9 to 1 | 1.0 to 1 | 1.4 to 1 |
| NET POSITION TREND: | |||
| – Strength Index Score (3 Year Range Pct): | 61.2 | 33.3 | 66.7 |
| – Strength Index Reading (3 Year Range): | Bullish | Bearish | Bullish |
| NET POSITION MOVEMENT INDEX: | |||
| – 6-Week Change in Strength Index: | -1.7 | 7.0 | -15.7 |
Dow Jones Mini Futures:
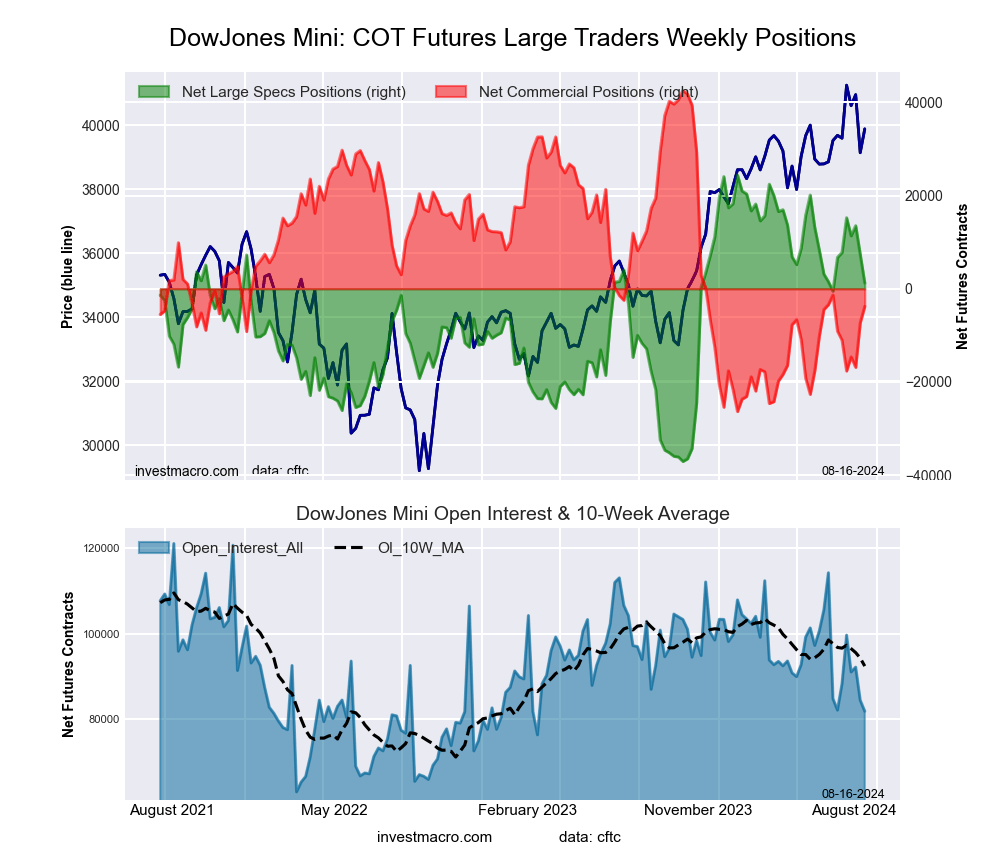 The Dow Jones Mini large speculator standing this week reached a net position of 1,237 contracts in the data reported through Tuesday. This was a weekly reduction of -6,132 contracts from the previous week which had a total of 7,369 net contracts.
This week’s current strength score (the trader positioning range over the past three years, measured from 0 to 100) shows the speculators are currently Bullish with a score of 62.3 percent. The commercials are Bearish with a score of 32.7 percent and the small traders (not shown in chart) are Bullish with a score of 60.7 percent.
Price Trend-Following Model: Strong Uptrend
Our weekly trend-following model classifies the current market price position as: Strong Uptrend. The current action for the model is considered to be: Hold – Maintain Long Position.
| Dow Jones Mini Futures Statistics | SPECULATORS | COMMERCIALS | SMALL TRADERS |
| – Percent of Open Interest Longs: | 22.0 | 59.6 | 16.5 |
| – Percent of Open Interest Shorts: | 20.5 | 64.2 | 13.4 |
| – Net Position: | 1,237 | -3,784 | 2,547 |
| – Gross Longs: | 18,012 | 48,794 | 13,516 |
| – Gross Shorts: | 16,775 | 52,578 | 10,969 |
| – Long to Short Ratio: | 1.1 to 1 | 0.9 to 1 | 1.2 to 1 |
| NET POSITION TREND: | |||
| – Strength Index Score (3 Year Range Pct): | 62.3 | 32.7 | 60.7 |
| – Strength Index Reading (3 Year Range): | Bullish | Bearish | Bullish |
| NET POSITION MOVEMENT INDEX: | |||
| – 6-Week Change in Strength Index: | -8.9 | 7.7 | 1.0 |
Nasdaq Mini Futures:
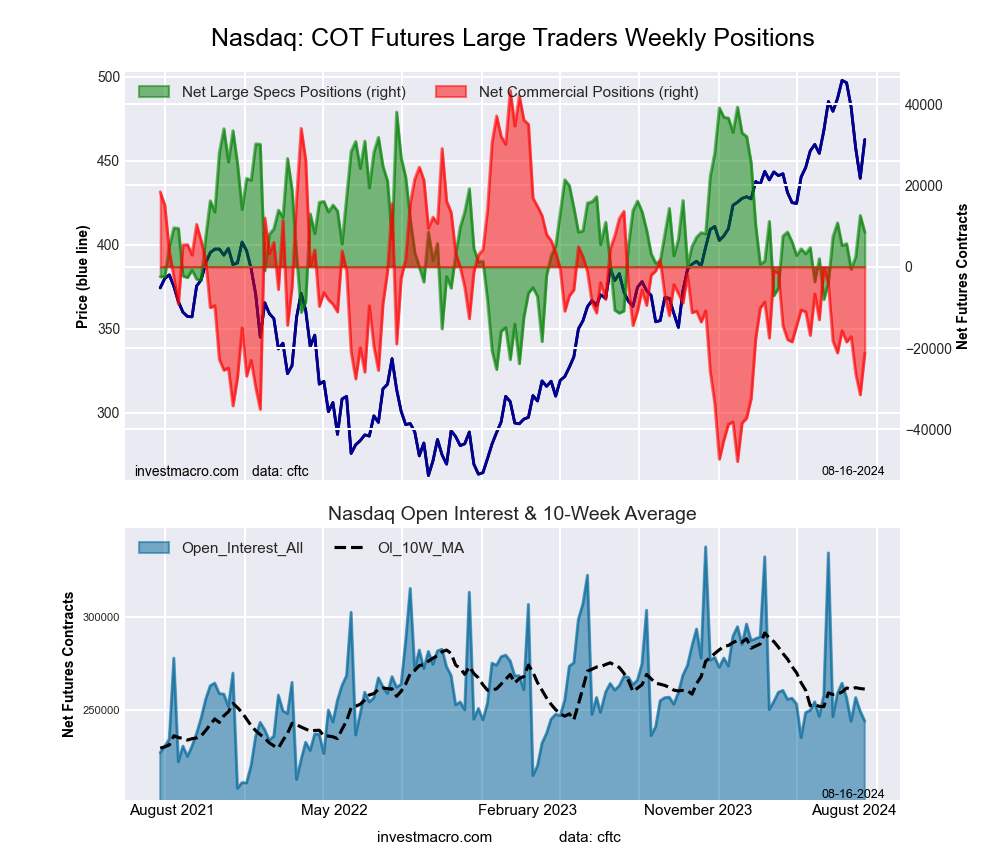 The Nasdaq Mini large speculator standing this week reached a net position of 8,484 contracts in the data reported through Tuesday. This was a weekly decline of -4,127 contracts from the previous week which had a total of 12,611 net contracts.
This week’s current strength score (the trader positioning range over the past three years, measured from 0 to 100) shows the speculators are currently Bullish with a score of 52.3 percent. The commercials are Bearish with a score of 29.2 percent and the small traders (not shown in chart) are Bullish with a score of 78.8 percent.
Price Trend-Following Model: Uptrend
Our weekly trend-following model classifies the current market price position as: Uptrend. The current action for the model is considered to be: Hold – Maintain Long Position.
| Nasdaq Mini Futures Statistics | SPECULATORS | COMMERCIALS | SMALL TRADERS |
| – Percent of Open Interest Longs: | 20.1 | 60.9 | 16.7 |
| – Percent of Open Interest Shorts: | 16.6 | 69.6 | 11.5 |
| – Net Position: | 8,484 | -21,221 | 12,737 |
| – Gross Longs: | 49,051 | 148,524 | 40,833 |
| – Gross Shorts: | 40,567 | 169,745 | 28,096 |
| – Long to Short Ratio: | 1.2 to 1 | 0.9 to 1 | 1.5 to 1 |
| NET POSITION TREND: | |||
| – Strength Index Score (3 Year Range Pct): | 52.3 | 29.2 | 78.8 |
| – Strength Index Reading (3 Year Range): | Bullish | Bearish | Bullish |
| NET POSITION MOVEMENT INDEX: | |||
| – 6-Week Change in Strength Index: | -3.6 | -0.0 | 4.4 |
Russell 2000 Mini Futures:
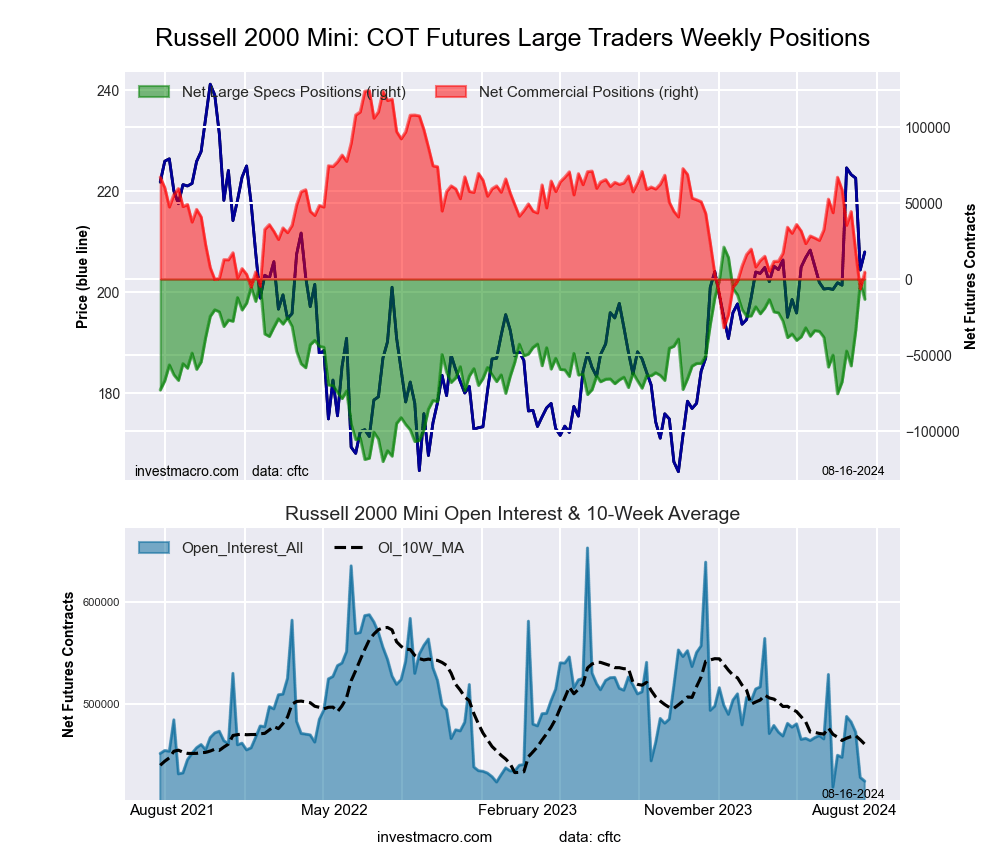 The Russell 2000 Mini large speculator standing this week reached a net position of -13,256 contracts in the data reported through Tuesday. This was a weekly decrease of -10,661 contracts from the previous week which had a total of -2,595 net contracts.
This week’s current strength score (the trader positioning range over the past three years, measured from 0 to 100) shows the speculators are currently Bullish with a score of 75.7 percent. The commercials are Bearish with a score of 23.4 percent and the small traders (not shown in chart) are Bullish with a score of 58.2 percent.
Price Trend-Following Model: Strong Uptrend
Our weekly trend-following model classifies the current market price position as: Strong Uptrend. The current action for the model is considered to be: Hold – Maintain Long Position.
| Russell 2000 Mini Futures Statistics | SPECULATORS | COMMERCIALS | SMALL TRADERS |
| – Percent of Open Interest Longs: | 15.4 | 76.3 | 7.0 |
| – Percent of Open Interest Shorts: | 18.5 | 75.2 | 5.0 |
| – Net Position: | -13,256 | 4,580 | 8,676 |
| – Gross Longs: | 65,225 | 323,855 | 29,794 |
| – Gross Shorts: | 78,481 | 319,275 | 21,118 |
| – Long to Short Ratio: | 0.8 to 1 | 1.0 to 1 | 1.4 to 1 |
| NET POSITION TREND: | |||
| – Strength Index Score (3 Year Range Pct): | 75.7 | 23.4 | 58.2 |
| – Strength Index Reading (3 Year Range): | Bullish | Bearish | Bullish |
| NET POSITION MOVEMENT INDEX: | |||
| – 6-Week Change in Strength Index: | 44.1 | -40.0 | 0.7 |
Nikkei Stock Average (USD) Futures:
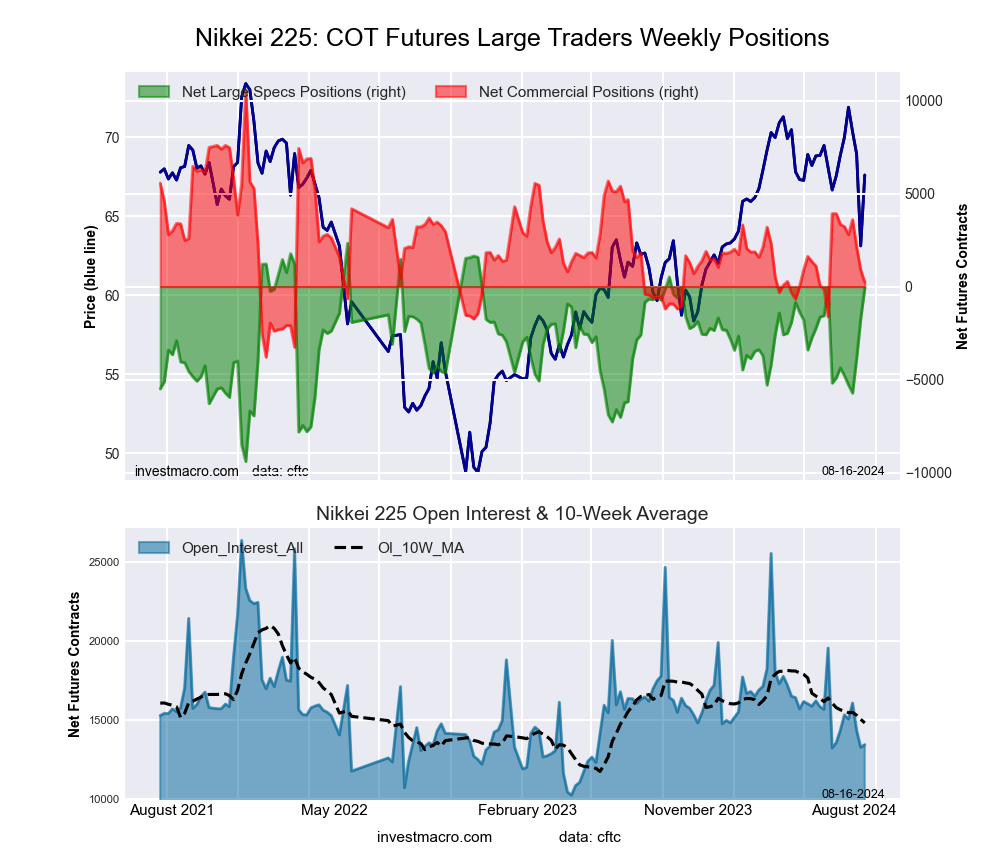 The Nikkei Stock Average (USD) large speculator standing this week reached a net position of -75 contracts in the data reported through Tuesday. This was a weekly boost of 1,652 contracts from the previous week which had a total of -1,727 net contracts.
This week’s current strength score (the trader positioning range over the past three years, measured from 0 to 100) shows the speculators are currently Bullish with a score of 79.5 percent. The commercials are Bearish with a score of 28.0 percent and the small traders (not shown in chart) are Bearish with a score of 40.3 percent.
Price Trend-Following Model: Weak Downtrend
Our weekly trend-following model classifies the current market price position as: Weak Downtrend. The current action for the model is considered to be: Hold – Maintain Short Position.
| Nikkei Stock Average Futures Statistics | SPECULATORS | COMMERCIALS | SMALL TRADERS |
| – Percent of Open Interest Longs: | 17.9 | 60.9 | 21.2 |
| – Percent of Open Interest Shorts: | 18.5 | 59.2 | 22.3 |
| – Net Position: | -75 | 223 | -148 |
| – Gross Longs: | 2,405 | 8,179 | 2,846 |
| – Gross Shorts: | 2,480 | 7,956 | 2,994 |
| – Long to Short Ratio: | 1.0 to 1 | 1.0 to 1 | 1.0 to 1 |
| NET POSITION TREND: | |||
| – Strength Index Score (3 Year Range Pct): | 79.5 | 28.0 | 40.3 |
| – Strength Index Reading (3 Year Range): | Bullish | Bearish | Bearish |
| NET POSITION MOVEMENT INDEX: | |||
| – 6-Week Change in Strength Index: | 36.6 | -21.8 | -22.4 |
MSCI EAFE Mini Futures:
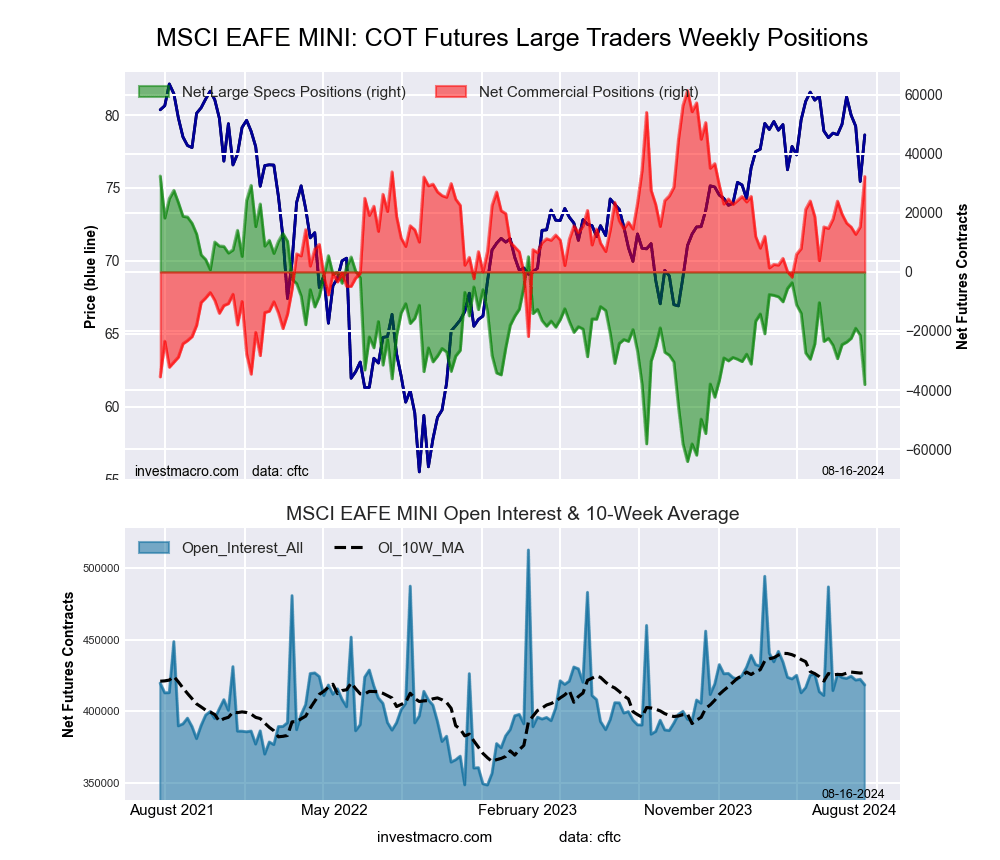 The MSCI EAFE Mini large speculator standing this week reached a net position of -38,102 contracts in the data reported through Tuesday. This was a weekly lowering of -16,647 contracts from the previous week which had a total of -21,455 net contracts.
This week’s current strength score (the trader positioning range over the past three years, measured from 0 to 100) shows the speculators are currently Bearish with a score of 27.0 percent. The commercials are Bullish with a score of 70.0 percent and the small traders (not shown in chart) are Bearish with a score of 45.9 percent.
Price Trend-Following Model: Strong Uptrend
Our weekly trend-following model classifies the current market price position as: Strong Uptrend. The current action for the model is considered to be: New Buy – Long Position.
| MSCI EAFE Mini Futures Statistics | SPECULATORS | COMMERCIALS | SMALL TRADERS |
| – Percent of Open Interest Longs: | 6.3 | 90.6 | 2.8 |
| – Percent of Open Interest Shorts: | 15.4 | 82.9 | 1.5 |
| – Net Position: | -38,102 | 32,301 | 5,801 |
| – Gross Longs: | 26,554 | 379,042 | 11,882 |
| – Gross Shorts: | 64,656 | 346,741 | 6,081 |
| – Long to Short Ratio: | 0.4 to 1 | 1.1 to 1 | 2.0 to 1 |
| NET POSITION TREND: | |||
| – Strength Index Score (3 Year Range Pct): | 27.0 | 70.0 | 45.9 |
| – Strength Index Reading (3 Year Range): | Bearish | Bullish | Bearish |
| NET POSITION MOVEMENT INDEX: | |||
| – 6-Week Change in Strength Index: | -9.1 | 8.6 | 2.0 |
Article By InvestMacro – Receive our weekly COT Newsletter
*COT Report: The COT data, released weekly to the public each Friday, is updated through the most recent Tuesday (data is 3 days old) and shows a quick view of how large speculators or non-commercials (for-profit traders) were positioned in the futures markets.
The CFTC categorizes trader positions according to commercial hedgers (traders who use futures contracts for hedging as part of the business), non-commercials (large traders who speculate to realize trading profits) and nonreportable traders (usually small traders/speculators) as well as their open interest (contracts open in the market at time of reporting). See CFTC criteria here.

- Investors run to safe-haven assets amid Middle East escalation Mar 6, 2026
- EUR/USD Under Pressure: Middle East Risks Outweigh All Else Mar 6, 2026
- Bitcoin shows resilience to Middle East events. Oil market stabilizes Mar 5, 2026
- GBP/USD: Market Not Expecting BoE Rate Cut in March Mar 5, 2026
- Brent headed for $100? Mar 4, 2026
- Global stock indices continue sell-off due to Middle East conflict Mar 4, 2026
- USD/JPY to Quickly Return to Growth: Momentum Favours the US Dollar Mar 4, 2026
- European equities plunge amid Persian Gulf military conflict Mar 3, 2026
- Gold Rallies for Fifth Day, With External Risks Mounting Mar 3, 2026
- Iran Crisis: A Dangerous Turning Point Mar 2, 2026